


As the majority of providers in the English higher education sector focus on developing their new access and participation plans (APP), we have an opportunity to refresh our thinking about the barriers to equality of opportunity and outcome. With that in mind, I wanted to share a growing frustration of mine, regarding the way in which our sector approaches and discusses issues of educational inequality.
Under the new APP framework, providers are asked to reflect on risks to equality across three stages of the student lifecycle – Access, On Course, and Progression (ie graduate outcomes). With regard to On Course risks, the metrics we should be focused on are:
- Continuation – are students remaining in higher education from one year to the next?
- Completion – are students completing the qualification they signed up for?
- Attainment – what proportion of students achieve a first class or 2:1 degree?
My frustration is that the only outcome gap which we regularly discuss is the attainment (or, as it is more commonly called, awarding) gap – to the extent we have regular, high-profile conferences and detailed reports about it. Now, these events and reports are, on their own terms, brilliant resources. But they also offer a very narrow window on the deeper educational inequalities we face as a sector, and are oriented around what I consider to be the most problematic of all the outcome metrics. While I wouldn’t dispute the importance of looking at the profile of first and 2:1 awards across student groups as a way of understanding inequalities of outcome, continuation and completion gaps seem even more important – do students actually stay on and complete their courses?
Persistent and pervasive
OfS’ own data for the sector show that we have persistent and pervasive gaps for continuation, completion, and progression, as well as attainment. With regard to continuation and completion gaps, it is worth reflecting on the implications of this for how we interpret our attainment gap data. For example, across the sector, for 2020-21, there was a 5.8 per cent continuation gap between black and white students. Not only is this important to address in its own right, the fact that black students are more likely to drop out of their course without completing means that the awarding gap data which we discuss in our institutions might actually be underestimating the scale of the problem. To state the obvious, if students drop out before completing their course, they don’t appear in your attainment metrics.
At an institutional level, then, it is critical that we look at outcome data and gaps across the whole student lifecycle, not just attainment. If you see an improvement in your awarding gap for a specific student group, have you checked this isn’t the result of a spike in non-continuation rates for that student group a few years prior? It would be a hollow victory if you reduced your awarding gap because fewer of your students from certain groups were making it to graduation.
While I accept that it is possible I’m simply not hanging out with the right people in the right places when I bemoan what I see as a lack of sophistication and nuance in discussions about outcome gaps, I do have some (totally unscientific) evidence to support this view. If you do a quick search in Google for “BAME awarding gap”, you will quickly discover a range of reports, events (both past and forthcoming), and articles. Then try running a search for “BAME continuation (or completion) gap.” What you’ll find is… a very similar set of results, linking to results on attainment/awarding gaps. I would love to be proven wrong, but this really does feel like a huge oversight across the sector – we’ve focused on a narrow definition of a desirable outcome (achieving a first or a 2:1 degree), at the expense of a broader and more meaningful discussion of why many disadvantaged and underrepresented student groups are not even making it through their course.
Worked example
To illustrate this point, let’s imagine a provider has two groups of students – A and B. The chart, below, shows two different scenarios. In Scenario 1, there is no difference in completion (90 per cent of all students complete their course). Of those who do complete, Group A have a 20 per cent higher rate of firsts and 2:1 awards – in other words, a 20 per cent attainment or awarding gap. The adjusted figures in the chart show what happens if you calculate attainment while including the 10 per cent of students in both groups who did not complete – and both groups A and B, you can see that the attainment rates drop, and the awarding gap actually shrinks slightly.
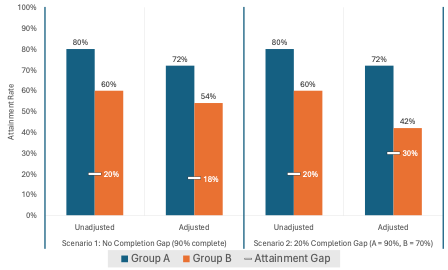
In scenario B, the only difference is that Group B students have a completion rate of 70 per cent, while 90 per cent of Group A complete their course. Out of those students in both groups who do graduate, there is still a 20 per cent attainment gap. The interesting thing is what happens once you adjust the attainment gap by including those who did not complete. As the panel on the right of the chart shows, this adjusted attainment gap jumps from 20 per cent to 30 per cent.
Bigger picture
In short, the problems we should be trying to tackle with regard to equality of outcome and opportunity are far more complex than simply counting how many students are getting a first or a 2:1. There are differences in outcome at every stage of the student journey – from access, right the way through to graduate outcomes. And differences which emerge earlier in the student journey compound the differences at later stages, despite this not being immediately apparent in the way that attainment metrics are reported.
At London South Bank University, as a first wave provider submitting our new APP last year, we grasped the opportunity to get into these discussions of our own institutional data with both hands. As an institution with social mobility at the heart of what we do, we were pleased that the OfS agreed with us that there were no meaningful Access targets to set. This makes us one of the first, if not the first, provider not to have regulated Access targets in their APP (although we have included a range of commitments to access and outreach activity, which we continue to deliver as part of our mission). The targets which we have set take a view across the whole student journey, and reflect the diversity of our student community. This has led to targets being set which, I am confident, will ensure we not only continue to reduce and eliminate inequalities of outcome for our students, but will do so in a systematic and sustainable way.
If I have a recommendation to make to colleagues currently working on their own APPs, it would be to take this opportunity to really reflect on whether your own institutional mindset on inequality is as broad and meaningful as it should be. If you find that you have been focused too heavily on awarding gaps, then now would be a good moment to reflect on why such gaps exist, and how they could be eliminated.


An excellent article that highlights the importance of looking over the whole life-cycle. My problem is that this is still focussing on gaps once in higher education and missing the access (and progression) gaps which exist most notably those affecting white working class boys, until we consider all of the gaps we will not achieve equality
Thanks Richard. And I agree entirely re: access – we aren’t making adequate progress on who gets in, as well as who gets on (to borrow a Jim Dickinson turn of phrase, I believe). Joining these conversations up across the whole student journey is critical – particularly for providers where access is the primary problem today. Because if you manage to address your issues with access and diversify your intake, you’d hope that the on-course experience had been planned in advance to prevent inequalities of outcome arising later down the line.
An important reminder of the gap in discussions of the award gap and one that highlights the need to monitor early warning indicators such as submission rates, first-time pass rates, etc. to ensure meaningful interventions while there’s still time to make a difference.
Thank you Janice – I couldn’t agree more about the importance of early intervention. These regulatory indicators, while important, only tell us what has already happened. Interventions to improve first time pass rates are, to my mind, particularly important – for students who might not feel they naturally belong in HE, making sure they have early opportunities to succeed can be transformational.
This is an excellent article highlighting how the issue of equality in the HE sector has become focused on one measure (whether a student graduates with a 2:1 degree or higher) and pays much less attention to other ways there can be major inequalities between groups. Probably one of the most important points in this article is that drop-out rates and attainment gaps can not be treated independently. What the attainment gap is between any two groups is crucially dependent on the different drop-out rates between these two groups. We could, for example, have no attainment gap at all between two groups, but a large difference in drop-out rates. If our “target metric” is closing the attainment gap, everything will look good, but of course it is not.
I’m really confused , i’ve read this a few times and still unclear on the main point. Is the article saying we shouldn’t look at the awarding gap and focus on continuation and completion without focusing on who achieves a 2.1 or 1st?
Hi Nathan, I’m suggesting we need to look at all of these things – and that as a sector we’re overly fixated on attainment/awarding gaps. There is inequity of outcome for students who continue and complete their degrees, who obviously then never even make it into the calculation of degree awarding gaps (and if you adjust the awarding gap to account for these non-completes, the awarding gap would be even larger). In short, we need to consider the entire student lifecycle from access through to graduate outcomes.
I do also happen to think that, of all the different metrics, the awarding gap (who gets a 1st or 2:1) is the most problematic, as it makes a value judgement about ‘good and bad awards’. Whereas something like the continuation gap is an objectively more valid measure – students dropping out is definitely not a good thing.
Thanks for your article Tony-lots of good food for thought and useful comments from others too. (sorry for the very short comment above-pressed “comment” before I should have!). I’m guessing (but I might be wrong) that the fixation with 2:1 and 1st class degrees may have come from employers using degree classification as a selection/sifting mechanism for graduate level job applications-but I think this may be less of an issue these days…interesting to know what others think on this. At SHU we have been looking at when awarding/attainment gaps start appearing in-level, on modules, on courses where the degree awarding gaps are largest. Unfortunately they start to be seen quite early on in UG study on some courses. But-a benefit of this is that then interventions can be made.
Adjusting attainment outcomes by completion outcomes biases the conclusions. Attainment refers specifically to those who did complete their studies. Including non-completers is actually misleading, because their portion of the data on which attainment is calculated adds a zero attainment (presumably, Fail), which is a projection of how these students would have attained had they not discontinued. The completion and attainment measures consider two different things and I see no justifiable reason to lump them together. It is not factual to suggest that because a group has a 20% completion gap with its comparator, it’s gap on another measure where completion is a pre-requisite, would be larger than it actually is. If you up completion rates, how do you know that attainment rates would change, and what direction they’d change in? I’d rather the measures are considered separately – they do after all have very specific factors affecting them independently. Or, if you insist, check how the measures regress on factors thought as instrumental for the observed gaps. The rest is mere speculation and conjecture, which in my opinion doesn’t add much to APP work. Also, it simply isn’t right to claim that much less or no work goes towards raising continuation and completion. The flood of research and evaluation of interventions around belonging, whole-provider approach to student support, mental health and financial support, flexible learning and other curricular and pedagogic practices, etc., suggest otherwise.