


The most recent release of the HESA Staff record open data concerns the 2022-23 academic year.
It was a year that started with the brief and fiscally calamitous Liz Truss administration, and ended with rapidly climbing inflation – so the attention of universities was very much centred on rising costs, and the affordability of every aspect of provision.
Widespread (though not national) industrial action on pay, pensions, and conditions will also have played a part in staffing changes during this period.
In the majority of these charts we examine academic staff numbers only – HESA Staff data is optionally submitted by providers in England and Northern Ireland, and is therefore less usable for analysis.
Academic staffing changes
We can see changes at a provider level – expanding student numbers, in general, made for an increase in academic staff headcount at most providers.
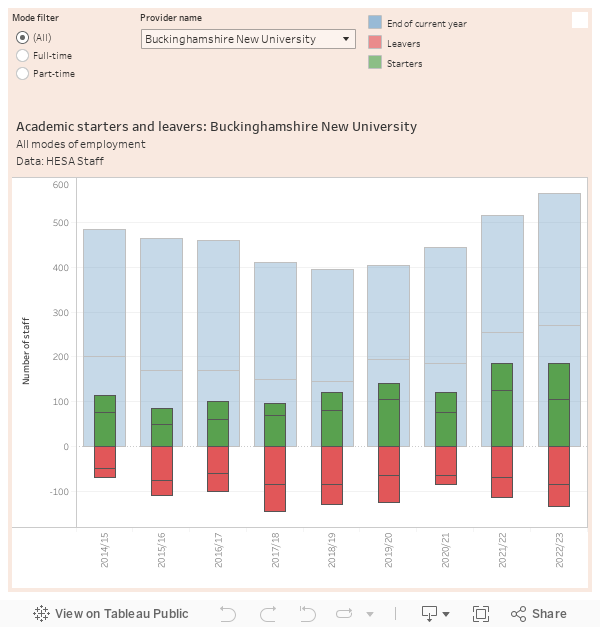
This chart shows total academic staff numbers (headcount) for each year in pale blue. The thinner green bars show new staff appointed in year, while the red bar shows staff attrition during the year in question. All bars are split to show mode of employment (full time/part time) when the “(all)” option is selected on the mode filter. You can select the provider you are interested in (or “Total” for the whole sector, at the top).
Bearing in mind the usual caveats, we can also see staff numbers and year on year changes by academic cost centre. The sector-wide story appears to be an increase in the use of academic contracts in central services – which means roles like deans, faculty officers, senior leaders and other roles not attached to a single cost-centre.
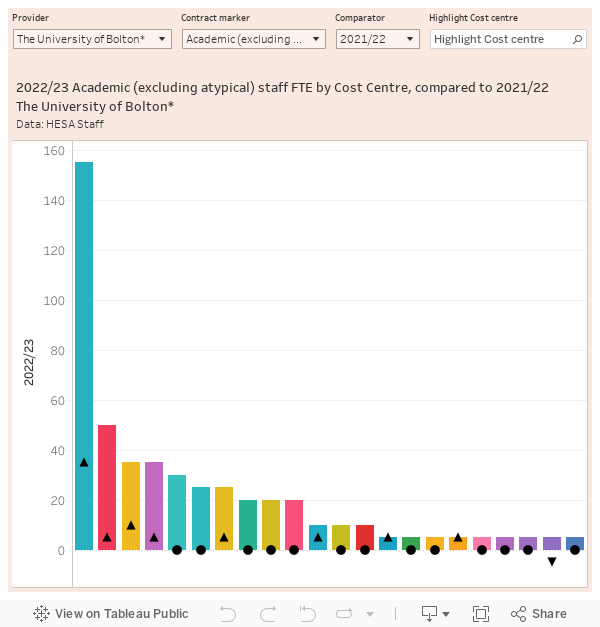
Select your provider of interest using the filter on the top left, and then the contract-marker (which groups of staff to include) next to it. The coloured bars on the chart shows full-time equivalent (FTE) staff associated with each cost-centre (you can highlight cost centres of interest using the highlighter on the top left). The arrows compare FTE this year with either 2021-22 (last year) or 2019-20 (last pre-pandemic year), you can choose which via the comparator control.
I’ve included non-academic staff data here where it is available – a star against a provider name indicates where non-academic data has not been submitted for 2022-23, so for these providers “contract marker” options including non-academic staff will not work.
Terms and conditions
As I noted earlier in January, there’s been a small decline in the number of “research only” academic staff, alongside rises in “teaching only” and “teaching and research” contracts. Research only contracts are most prevalent in Russell Group providers – and interestingly Russell Group and other pre-92 (traditional) universities have the overwhelming majority of (usually part-time) teaching only roles. And the teaching and research contracts are proportionally more likely to be found in both the teaching-focused Million Plus and vocationally-focused University Alliance.
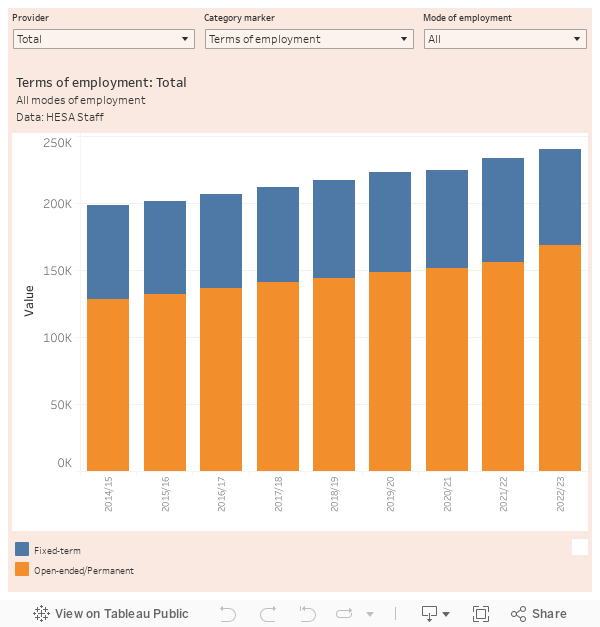
This chart shows academic staff headcount information – again, you can choose a provider of interest (or “Total”) at the top left, and mode of employment at the top right. The central filter gives you a choice of categories relating to terms and conditions, you can select academic employment function, contract level, terms of employment, and source of basic salary – and also see a split by sex.
One interesting facet of the terms of employment chart is that it shows a decline in the number of staff on fixed-term contracts, from a record 77,555 to a 71,420 – the latter being the lowest number since 2017-18. However, some 41 per cent of academic staff in the “big 7” universities (the seven with an annual turnover of £1bn or more – Oxford, Cambridge, Imperial, UCL, KCL, Manchester, Edinburgh) are on fixed-term contracts, though this is slightly lower than in recent years.
What we don’t know (as UCU notes today) from the HESA data is the academic functions linked to such contracts, or whether staff on such contracts are effectively on open-ended contracts though move from project to project. Similar numbers of staff where the basic salary comes from outside the institution (an arrangement that has declined in popularity over recent years) suggests that external contracts may be the source of much of fixed term employment in the sector.
Staff characteristics
To the nearest 5, there were 210 black professors on academic contracts (of 21,645 in total) in 2022-23. This is a rise of 35 over last year, but still makes for just 0.94% of the professoriate.
In 2022-23, three in ten professors were women – and this is the highest number on record. More than half of all academics on non-senior contracts were women.
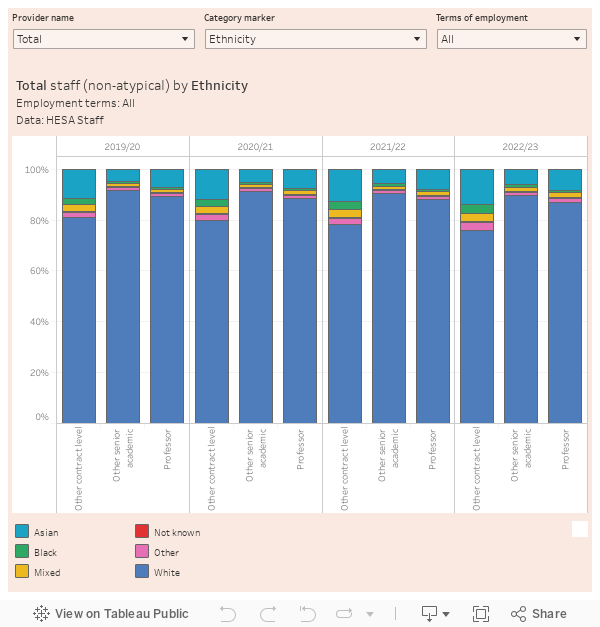
This chart shows academic headcount, excluding atypical staff. You can choose a provider of interest (or “total” for the whole sector) on the left, characteristics of interest in the middle, and filter by terms of employment (fixed term or open ended) at the right. The bar shows proportions, though numbers (rounded as always to the nearest 5) are available with the mouse-over.


It is a shame that we do not get more information on whether research only staff are PIs or RAs which could be invaluable for anyone trying to understand the quite different proportions of research only staff in apparently quite similar providers. I believe these data are collected but not published meaning anyone wanting any kind of insight would need to commission bespoke analysis from Jisc.
Using Contract salary range data can give a reasonable proxy.
Regarding the decline of FT staff, anecdotally I wonder if it related to the non-renewal of FT teaching contracts as a cost saving measure in response to COVID and other external shocks? The two institutions I worked at during COVID both let a lot of FT teaching staff go (in one of them all but 1 of the dozen or so FT contract staff were let go) when many of them might have been renewed for another year. FTers also bore the brunt of other measures to mitigate COVID and the growing financial pressures, e.g. suspension of internal research fellowship schemes, and reduction in amount of casual sessional teaching available. These were my experiences, not sure how representative they were, but may account for a portion of the decline given that these measures were likely replicated at other institutions given the financial climate.