When does spring start?
Some people go by the first snowdrop they see – I go by the first HESA data release – “Student numbers and characteristics”. So in 2020 spring began on 16 January, and will continue right through to the official start of summer, some time in May (the release of HESA Estates data).
The HESA data release calendar is a bit of a niche way to mark the passage of the seasons, but it works for me. And how fitting that one of the first green shoots of data that we see are from a particularly hardy perennial.
Degree classifications
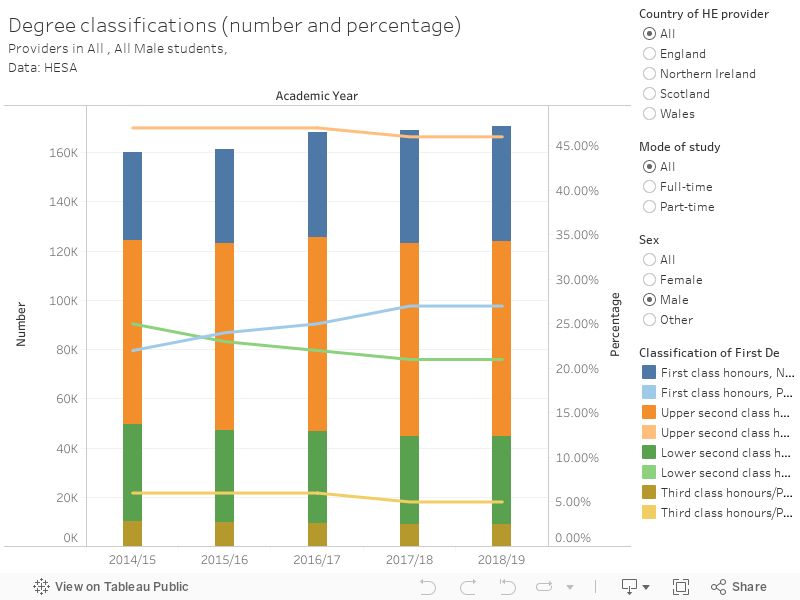
Much attention has already been drawn to the percentage point stasis – first class honours degrees were awarded to 28 per cent of graduates in 18-19, the same proportion as in 17-18. But, as always with these things – closer attention brings rewards.
The raw number of first class degrees has risen in line with a growth in the number of graduates. But most of this rise is among female graduates – the number of male graduates with first class degrees grew by only 765 (rounding applies), the number of female graduates with first class degrees grew by nearly 3,000. Indeed – 29 per cent of female graduates saw a first in 2018-19, compared to 27 per cent of male graduates.
This pattern is not new – but the gap is growing.
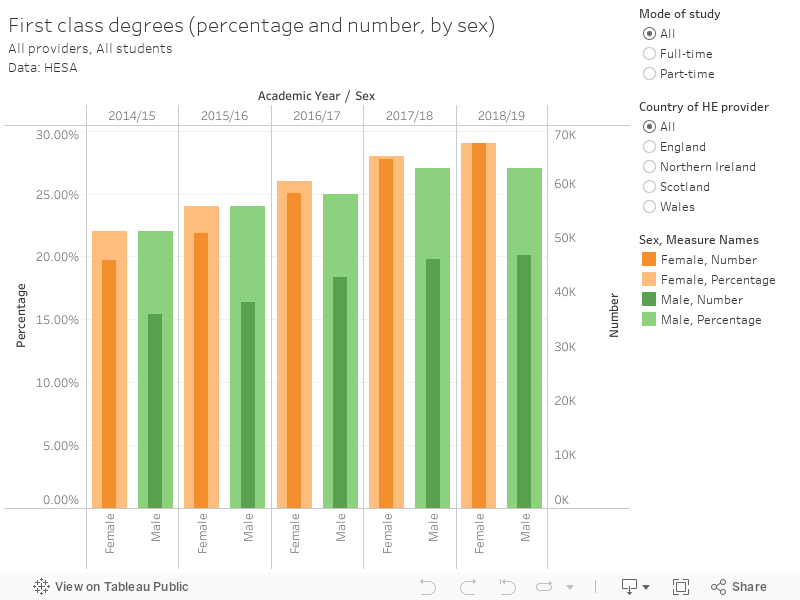
(If you’re wondering about non-binary students, numbers are growing sharply but there are not yet enough in the sample to do statistics with. It appears, however, that non-binary students may be more likely to achieve a first class degree than male or female students.)
Participation markers
There’s been a lot of discussion about what the participation markers in this release show us – but before we dive in we should note the incomplete data (these numbers do not include students studying at providers in the increasingly vague category of “alternate providers”). It’s also worth bearing in mind that some of these measures are drawn together based on student self-reporting, so may not be entirely reliable.
Participation data shifts slowly, not least because of a lag effect as students move through their course. But by setting filters to examine only students in the first year of their first undergraduate degree, we get something more kinetic – demonstrating, for example that on 70 more Scottish-domiciled students from SIMD (Scottish Index of Multiple Deprivation) Q2 than Q1 started their first year in 2018-19. This latter happened within an overall growth in student numbers, but nonetheless demonstrates progress towards widening access and participation goals
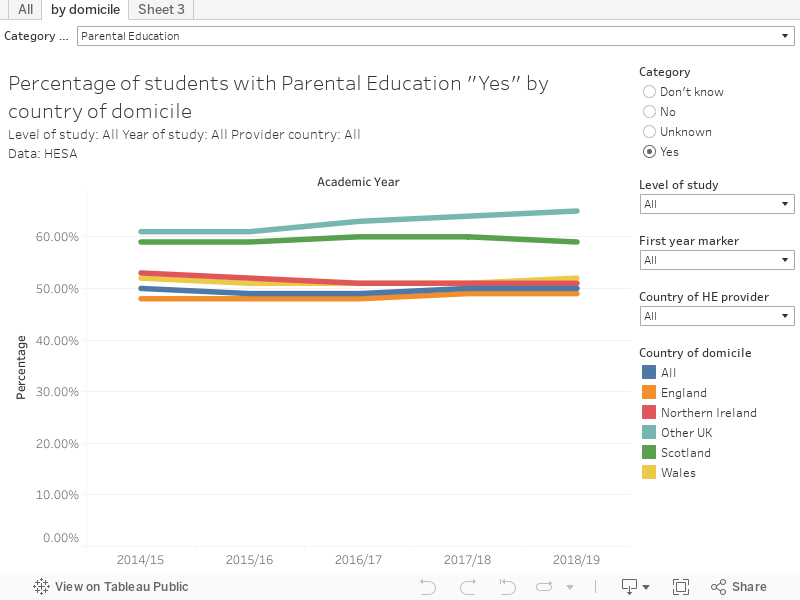
I was fascinated by the “parental education” marker, which is a rough (student reported) measure of whether a parent or guardian had a higher education qualification. This is a much bigger deal in Scotland than the rest of the UK at first glance (59 per cent had a parent with a HE qualification, compared to 49 per cent in England and 52 per cent in Wales).
But recall, of course, that this data does not include students studying HE in Scottish FE colleges – a common route into HE for many students who may otherwise be less likely to participate. So we can expect this omission to have an impact here, but also in the SIMD case detailed above.
Subject of study
Looking at students in their first year of taught postgraduate study we see a steep and continuing decline in students studying education. This demonstrates the the impact of the move to school-centred initial teacher training (SCITT) – the PGCE that was once the dominant route to a teaching career is fading away. But we also see the way education departments in universities are responding to this, there’s a small but significant rise in students starting postgraduate research courses in education.
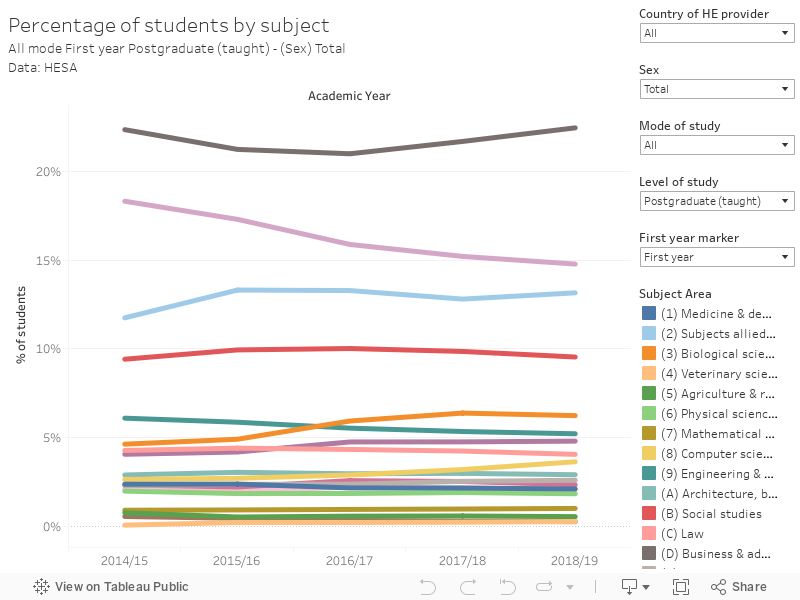
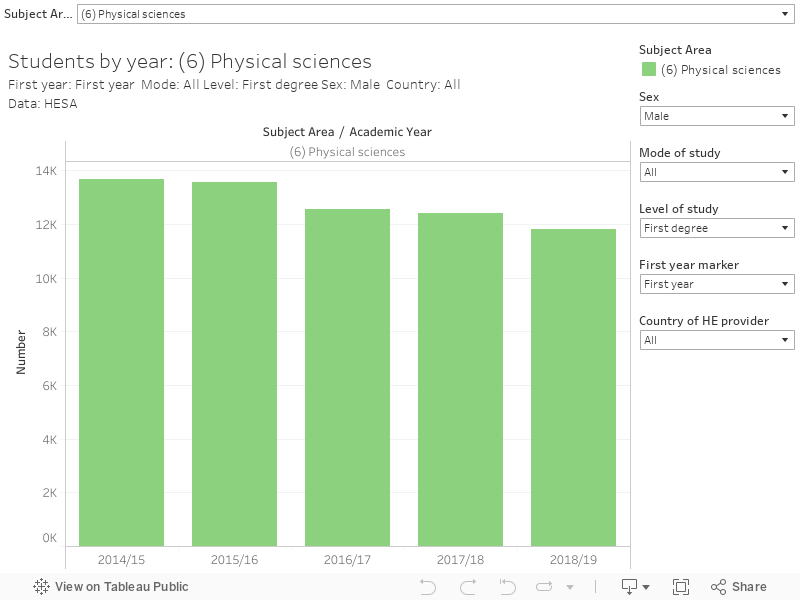
What I’ve not seen talked about elsewhere is an even five year decline in new undergraduate physics students – a decline even more notable for occurring primarily in male students. Here I’ve no simple theory as to what is going on – clearly initiatives to encourage women to study sciences are having an impact, but the trend among men is clear (although the numbers are still small).