The Graduate Labour Market Survey (GLMS) is a graduate salary monitoring dataset from a more elegant age. Eschewing the experimental big data method of the Longitudinal Education Outcomes (LEO) dataset, it uses a considered and defensible approach via the wider Labour Force Survey (LFS) to cast light on the outcomes and average earnings of all graduates within a given age range.
Employment rates
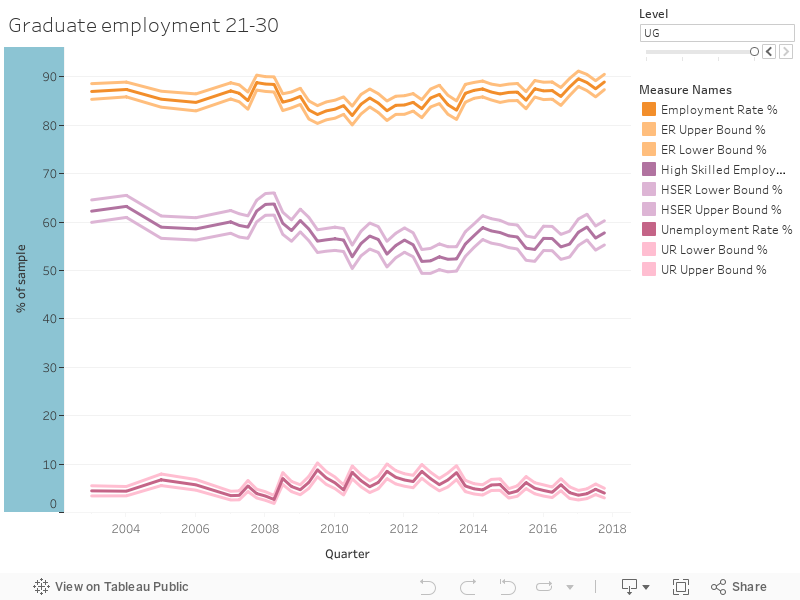
For 2018, we see guardedly good news. Graduate employment continues the slow rise from the depths of the 2008 financial crisis, and there is corresponding growth in high-skilled employment. Graduate outcomes continue to look rosy when seen against comparable non-graduates.
Covering England only, we’re provided with quarterly destinations for two demographic slices of graduates:
- Aged 21-30: Covering what could fairly be described as “recent graduates”
- Aged 16-64: All graduates of working age
With GLMS we can also compare undergraduates (UG) with non-graduates (NG) and post-graduates (PG) of comparable ages. This first chart shows employment, high-skill employment, and unemployment rates – you can filter to see different cohorts, and switch between the two age ranges.
Demographic splits
The following dashboard allows you to see a range of data about first degree graduates with particular demographic or study characteristics. Again, you can filter between the two age ranges as you examine median salary, employment and skilled employment rates, unemployment, and inactivity rates by:
- Degree class
- Disability
- Ethnicity
- Subject Group: STEM, LEM (Law, Economics, Maths), and OSSAH (other Social Sciences, Arts and Humanities)
- Occupation (derived from SOC codes)
- Industry (from the LFS user guide)
- Region (in which a graduate is living)
For each of these, a zero value means that no data is available for what you are looking at (I’d recommend you view this one full screen).
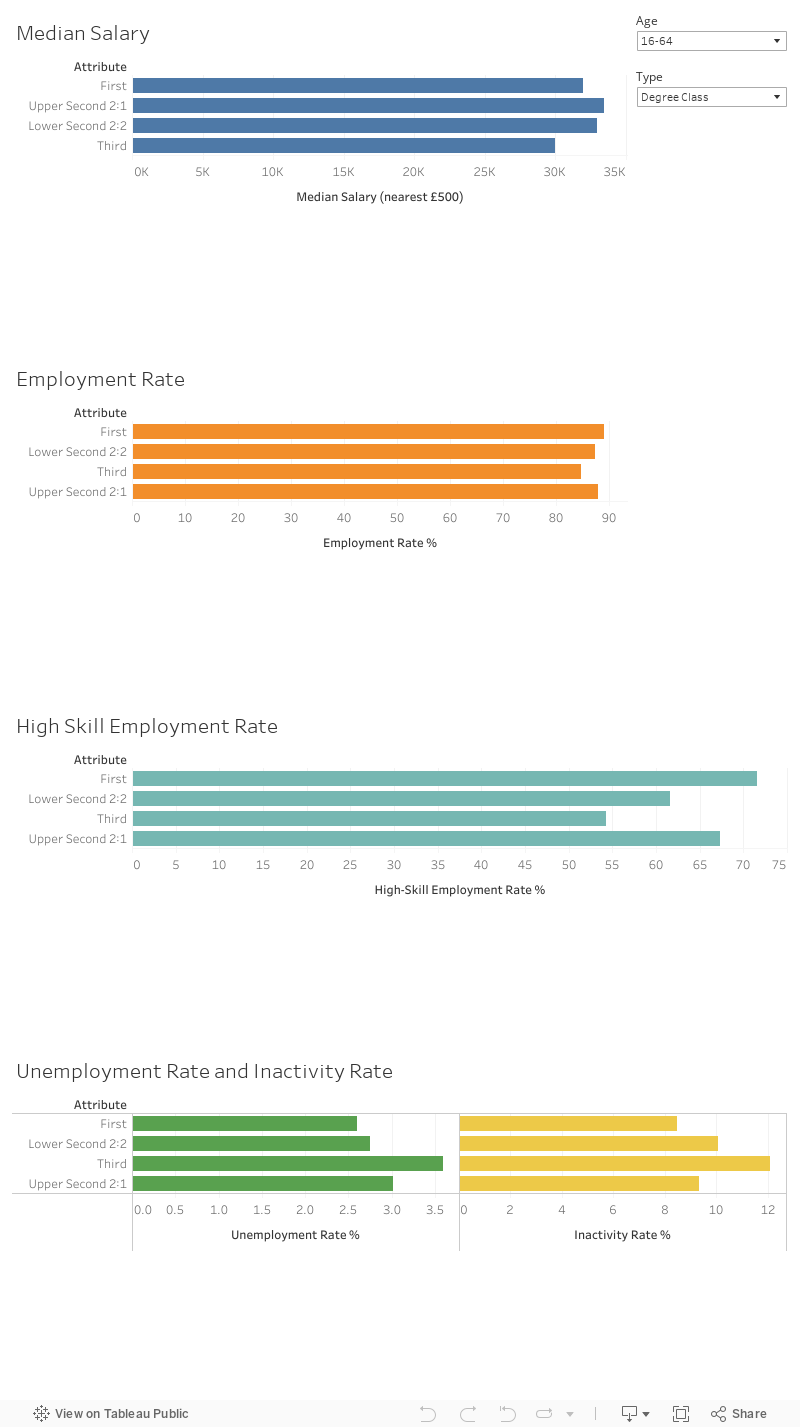
There’s a good illustration of a London effect on salary, and a London and South East effect on employment. One interesting statistical artefact is that for the 16-64 age group graduates with second-class degrees earn more than those with first-class degrees!
GLMS and LEO
LEO, in contrast with GLMS, looks at a particular cohort of graduates from a single year, but gathers as much data as possible for them from HMRC tax returns. This approach has strengths – the sheer volume of data for one, and the (eventual) ability to track individual cohorts across multiple years. But it also has weaknesses – the sheer volume of data and its raw nature mean that a casual reader can be given an unfair impression of exactitude.
The GLMS sampling methodology allows us to be more confident about how representative the data is – it has been weighted and controlled to a very high standard via the annually updated LFS protocol. The data is carefully caveated and presented at a usable level of abstraction.
It’s not that one is better than the other, it’s just that they do very different things. But, for me, GLMS is a well-designed temperature check on graduate performance in the job market – whereas LEO (even given all of the big data mystique) requires we set our own caveats and assumptions carefully.