


How annoyed (or delighted) are students studying for a degree in one provider but registered at another? How blissful (or despondent) do franchise arrangements make students? Until now it has not been possible to answer these questions in anything approaching a reliable way.
Franchise students are those registered at one provider and taught at another. This is not the same thing as validation arrangement – the data doesn’t allow us to look at the former group, even obliquely. Trends in the satisfaction of franchise students are complex, but a careful analysis of the NSS dataset, using some probably unintended facets of the data, can get us close to them. The fidelity isn’t perfect, the data is rough around the edges, but if nothing else it points to areas where further investigation is needed.
We see these students twice in the data, once attached to the registering provider they are franchised out from, the other from the taught provider they are franchised in to. Numbers are not large – 3,419 students could have their satisfaction visible on courses franchised in, but because of the way the data is published 7,882 are in the sample where provision is franchised out. Here we’re looking at responses to NSS question 27 (on overall satisfaction).
What do we see?
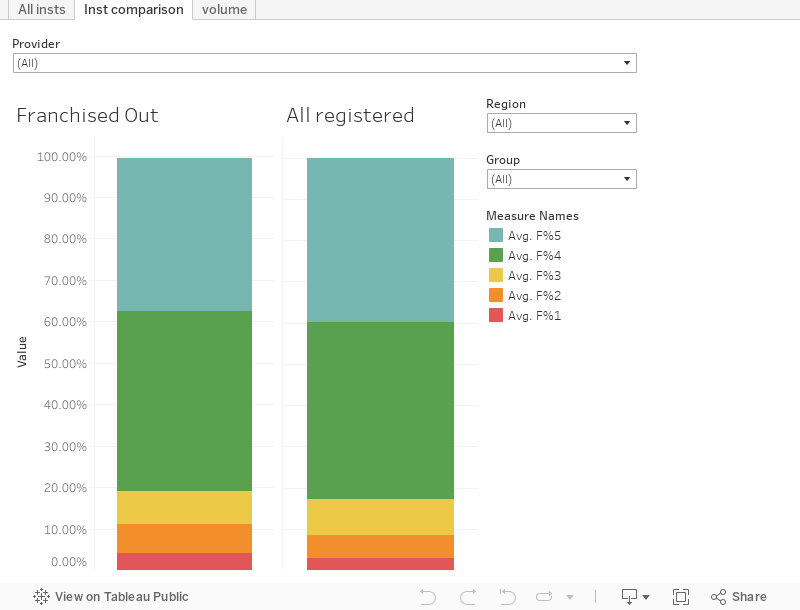
Franchised out [full screen]

Franchised in [full screen]
The good news is that on a sector-wide level there isn’t a stark difference in satisfaction – though franchise students are likely to be slightly less satisfied than the general population (a percentage point or two down at most). The interest comes when you look at an institutional level.
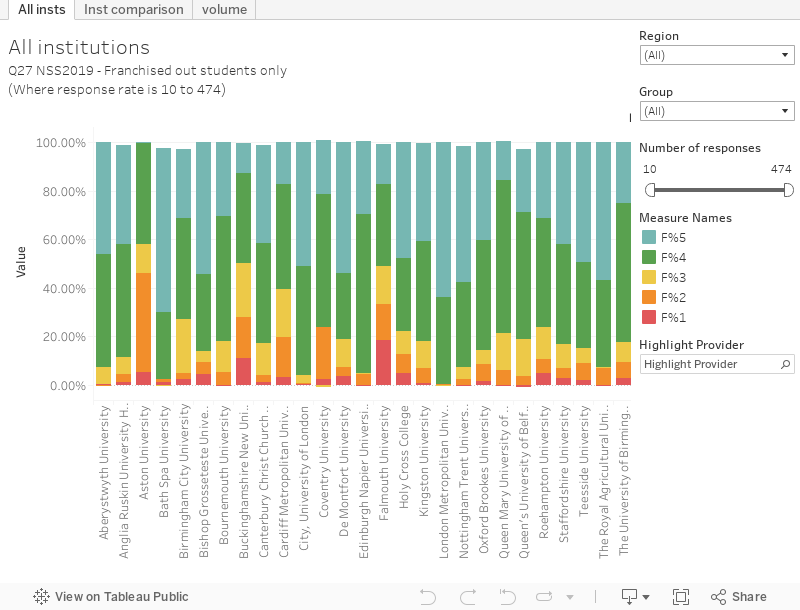
Franchised out [full screen]
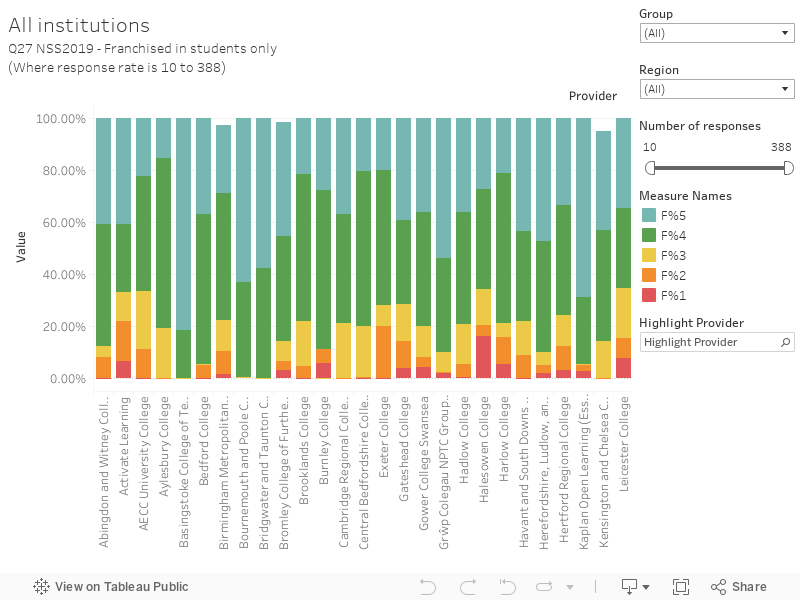
Franchised in [full screen]
Small sample sizes mean we need to be careful in drawing conclusions, but to my eyes the relationship with the registering (franchising out) provider has the most impact on satisfaction. There are several of these offering evidence of sharply above-average student dissatisfaction (more scores of one or two) – at least part of the effect may be because the cohort is larger than is taught in any individual provider.
Why might this be? My suspicion is that a well designed and well constructed course is a more satisfying experience for students – the “nuts and bolts” of the course experience comes from the institution franchising back. No matter how inspirational lecturers are, and how good the resources are, a course that doesn’t “make sense” is hard to love.
As you would perhaps expect it is traditional universities that tend to franchise out, with FECs and alternative providers tending to franchise in. But there are exceptions – though some may express flaws in the data rather than interesting new developments.
Holy Cross College and University Centre, in Bury, appears to franchise out 94 students despite not having degree awarding powers (remember, NSS only looks at final year undergraduate students). Wherever they are taught, they are within the margin of error of the national average for satisfaction. A handful of other FECs also have students registered to them taught elsewhere, though response rates are low.
Three more established HE providers teach groups of students registered elsewhere – Leicester, Liverpool Hope (nearly 100), and AECC University College. In each case, students studying under such arrangements are slightly less satisfied than students taught and registered at the same institution.
But the kings of franchise would have to be the UK College of Business and Computing – 666 students studying there are part of such an arrangement – nearly two thirds of the student body (the rest may well study under a validation agreement. And clearly something is going right – though the response rate for all students is low, franchise students express a 90% satisfaction rate, though this is below the 92% rate for all taught students.
For each visualisation, I’ve only included information on institutions who franchise in or out. On the main view I’ve excluded those who have completed surveys from less than 10 students – the institution comparison includes all data, so results should be treated with care where the number of responses is very low.
Methodology
This is where it gets tricky. Strap in.
We’ve always got two sets of data from the NSS – one covering students registered to a provider, the other covering students taught at a provider. This choice of dataset, while very welcome, is probably one of the most underused components of the release, and this is mostly due to a lack of understanding regarding what the two categories mean.
OfS’s own frequently asked question pages shed some light here:
The registering provider represents the organisation to which a student pays fees. This is not necessarily where the student is taught. A registering provider can sub-contract the teaching of a course to another higher education provider in which case the registering and teaching providers will be different. For the NSS, teaching provider is defined as the organisation supplying the majority of teaching in the penultimate year of the course.
The distinctions come from data returned to the bleak festering hellscape that is the data underpinning unistats – specifically the various forms of REGUKPRN and TEACHUKPRN.
If you think about it for a second, what is published is a spectacularly unhelpful presentation of data. There’s really three groups we might be interested in.
- Students registered at and taught at the same provider. This is the overwhelming majority of students, especially at mainstream public HEIs.
But also:
- Students on a validated course (i.e. the Massiveshire University says to Titchy Parva College “yes, you can award a degree in Subject with our name on it because you don’t have degree awarding powers but you have to design, deliver and quality assure it yourselves and the students will be registered with you”), are linked to the college for both registered and taught data.
- Students on a franchised course (i.e. the Massiveshire University says to Titchy Parva College “here’s this degree we’ve developed and a cohort of students, can you teach them please”), will appear under the university for the registered provider data and under the college for taught provider data.
For the latter two of these a HEI might be interested in questions around course organisation and resourcing as these will be in the remit of the registering provider, and an FEC would have an interest in questions relating directly to the student experience.
None of this is visible to your average curious reader/nosy journalist because the results do not separate out groups two and three from group one. Instead, both offer a view across all students – but in registered you’ll find franchise students under the name of the registered provider, and for teaching you’ll find them under the name of the taught provider. We can never look directly at the satisfaction of validated students, but we can squint at the experiences of franchise students using the raw power of maths:.
Registered – Taught = Franchised (+ for franchised in, – for franchised out)
(Two caveats – the main one is that small cohorts, and low return rates, are never published, so we will be missing a few students – to be precise, 4480 more students are in registered than taught. We don’t see the 8 students at Titchy Parva College in taught data – too small a cohort – but we do see them at Massiveshire in registered data.
Second caveat – I’m assuming that no institution both franchises in and franchises out, so students are only flowing in one direction. I’m pretty sure this is true in most cases, but there’s always someone… you’ll spot some weird names at the “probably data noise” ends of the table)
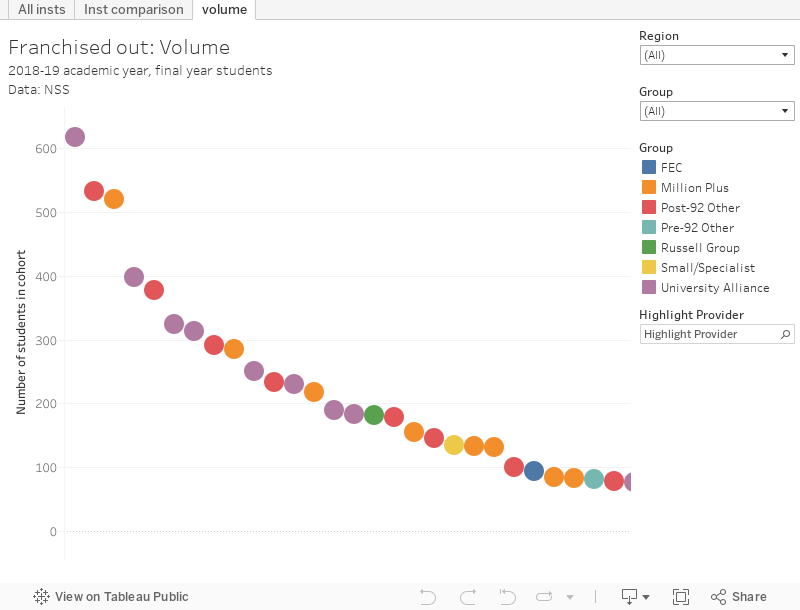
This gives us a dataset where negative values show franchise students where they are taught, and positive values show them where they are registered. So, at least, we can see the raw numbers of students (we can look at those surveyed, and those who responded) in this position at each provider, as below:

This is all interesting stuff, but how do we get to an understanding of how satisfied or otherwise these students might be. Looking at everyone’s favourite “overall satisfaction” (Q27), for each public dataset, we can see the percentage of student respondents who selected options one through five, plus the number of respondents who selected N/A (not applicable). OfS warns us that:
The data presented to providers and public is rounded to the nearest whole percentage point
Which you’d think means that we are dealing with very low fidelity data, and our quest would come to a disappointing end. But wonderfully, they’ve not rounded down properly – they’ve just used the “percentage” cell format in Excel. So we actually have percentages with up to four decimals (4.2376%, not just 4% as we might expect).
This isn’t perfect, but we can use this with the number of respondents minus the number answering N/A to give us something close to the actual number of students giving each answer. We get numbers like 75.0026 students – not perfect but near enough for what we are about to do.
(It would be irresponsible of me to present these actual numbers, as individual students could be identified. So even though I’ve got these through manipulation of publicly available data (in other words, this is OfS’ fault) I won’t present them here.)
With the same “registered-taught” manipulation I did above we get these numbers for franchise students at both ends of the graph, and then it is trivial to reconvert them into percentages. Voila – student satisfaction for franchise students, from both angles.
What we don’t know from this examination is who is franchising what to whom. That information is likely to be retrievable from the Unistats spaghetti data somewhere – some fun for the summer, perhaps.


Hi David. Can you please supply the definition you are using for the term ‘franchise’ in this piece?
Hi David – see the methodology section.
Interesting. I’m not actually surprised that students at partner institutions may be more satisfied. My experience of collaborative partners was that they were (generally) smaller cohorts of students than the ‘home’ equivalent and so there was a greater chance of making a student fell like a valued individual. Some of the private sector organisations also made sure to give students what they wanted, even on occasions when that wasn’t in their best interest (permitting a significant volume of re-assessment whilst taking a full semester’s worth of new modules, for example).