


Sometimes, in quantitative research, you can want a particular result so much you can lose sight of what it means in context.
The drop out rate for students who accepted unconditional offers is 7.08 per cent, and a detailed Office for Students model suggests we would have seen a non-continuation rate of 6.44 per cent if those same students had received a conditional offer – a percentage point difference of 0.65, and a change (as widely reported) of ten percent.
But an unconditional offer doesn’t present as big a risk of non-continuation as getting AAA rather than A*A*A* at A level. Or studying maths.
OfS has been very keen to demonstrate that unconditional offers are bad – specifically, that unconditional offers make students work less hard at their A levels (which is bad in itself) and then this lack of A level grinding makes them less successful at university (doubly bad).
This walks the line between an educational harm argument and a moral argument – I’m reminded of some of the grit or resilience arguments from a couple of years back. Student success is forged in the crucible of an eighteenth year spending 18 hours a day studying. If you don’t have those two years of pain and suffering you’ll never be a great student. Or something.
That’s the story that’s being sold – let’s kick the tyres and decide whether or not we want to buy it.
It’s a model – is it looking good?
The first thing to remember about these non-continuation figures is that they are compared with a modelled performance, not the actual performance of other students. The 185 students in question would not have been expected to drop out given their provider, course, and personal characteristics. That they did drop out is therefore put down to their offer type.
So how good is the model? It starts with individual student data for those entering HE in 2015-16 and 2016-17. You’ll recall that this January OfS looked at similar data from those entering in 2014-15 and 2015-16 – and identified a statistically insignificant difference in continuation for those with an unconditional offer.
OfS then takes data on the individual students that actually dropped out, and traces them back through the characteristics data to find which characteristics are more likely to be found in students that don’t continue.
All reasonable so far, but the model has changed between the January and October publication. I’m told that this is to bring it in line with the Association Between Characteristics of Students (ABCs), what it means in practice is that we get more coefficient estimates in the disability and ethnicity categories, and a new IMD category. This is not just a presentational change – it’s a material difference between the two models.
For those of you who read a lot of quantitative papers there’s probably some alarm bells ringing about population sizes too. A significant difference is harder to identify in a smaller population than a larger one. And unconditional offer numbers have grown substantially between the two periods measured. Because we only have two datasets under analysis, and both of them contain a chunk of the same data (the 2015-16 entry data), any effect we are seeing is due to one new year of data. Which is interesting in itself, but feels a bit unsafe.
So after adding a load more data and changing the model, the effects of an unconditional offer is still less than the effects of studying health and social care.
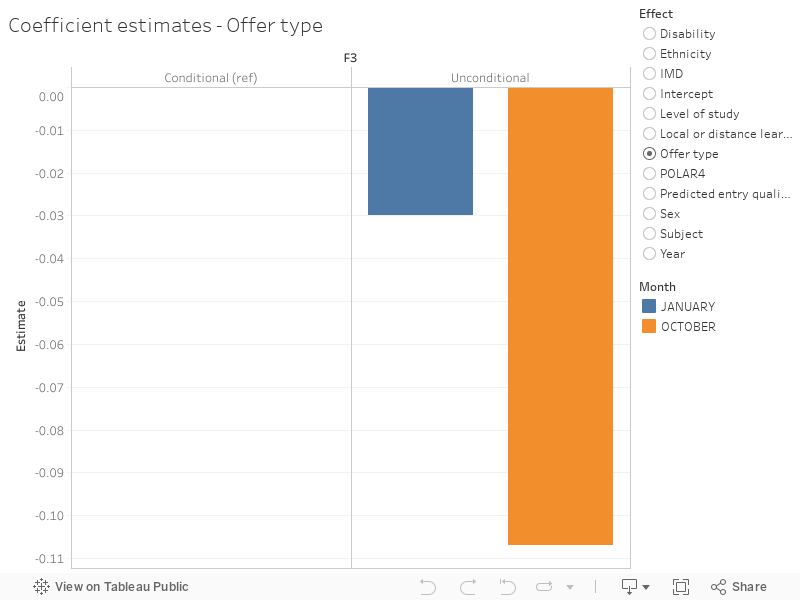
To compare the two periods you have to dig back into the (recently updated) “Data analysis of unconditional offer-making” publication from back in January. Table C3 in Annex C shows the coefficient, standard error, and p value for a number of student characteristics including offer type – table D3 in the annexes to the new publication is directly comparable. I’ve plotted them here if you don’t fancy digging through the annexes.
Stats chat
In a nutshell, we’re looking at the likely effect of each student characteristics on the likelihood of a student dropping out. Each of the tables lists, for various characteristics:
- A coefficient estimate – this, broadly speaking, is the effect of a change in a given characteristic compared to the “reference value” if all of the other statistics are “held fixed” (assumed to be the normal value that is stated in the table). A higher value means that characteristic in question has more of an effect.
- The standard error – this is an indication of how wrong this estimate might be. Note that it includes both a negative (actual coefficient is less than the estimate) or positive (actual coefficient is more than the estimate). A higher value means a bigger likely error – and is often linked to there being small amounts of relevant data.
- A p value – a measure of the likelihood that a finding can be attributed to chance rather than the variable under investigation – a p value of 0.001 means there being at most a 0.001 probability of observing getting this result solely by chance.
So what does this all mean in context? You’ll see, for example, in the January data release unconditional offers have a p value of 0.30 – which at first glance is low but believable. OfS found that for the 14-15 and 15-16 data a student is very slightly more likely to drop out if an unconditional offer. Alas, the standard error is larger than the effect size, and the p value is high, so it is not going to be a meaningful finding.
One weirdness is that the October estimate is looking at the likelihood of continuation and the January data is looking at the likelihood of non-continuation. I’m not clear why this change has been made, but I’ve reversed the October one in the visualisation to make it easier to compare.
Because we know that there were more unconditional offers in 15-16 than there were in 14-15 we can be confident that most of this effect is due to the 15-16 data. And as this same data is included in the October publication we can be equally clear that any change to any effect – and the new headline finding of a small but significant negative effect from unconditional offers – is primarily due to adding the 16-17 data.
Predicting the present, not the future
But there’s a lot more fun to be had with the coefficient estimates. Oh yes. For instance – forget unconditional offers – in the latest data a mathematical studies course is far more likely to see students fail to complete. But entry qualifications have a far larger effect. As does being Black or from a minority ethnicity. But POLAR quintiles don’t have as big an effect as you might imagine.
All this is potentially actionable data – it could be used to design and target interventions to stop students dropping out of their studies. It’s only two years of data but you could imagine building it year on year to do a fairly decent piece of research that could have a real student benefits.
I suppose the continuation of a moral panic over unconditional offers is useful to some people too. Just not students, or those who support them.


Two other reflections on the analysis.
First, it only includes predicted grades in the model so one of the explanations for the findings will be that there is a correlation between accepting an unconditional offer and missing your predicted grades as previously reported by the OfS (causation will run both ways though: slacking off knowing you don’t need to hit any particular grades and being more likely to accept an unconditional offer if you are not confident about hitting your predicted grades). An important finding but it’s not necessarily “doubly bad” – just the impact of achieving lower A-level grades hitting home.
Second, (I think I’m right in saying) it excludes all entrants who accept a conditional offer but miss it and are then placed through clearing. This would bias the non-continuation rate of those who accept a conditional offer downwards as such entrants would have higher non-continuation rates given their characteristics than those who hit a conditional offer. In other words, the impact of an unconditional offer would be smaller than implied by the analysis.
Your definition of a p value is badly wrong. Please correct.
indeed. Perhaps better to express as – a p value of 0.001 means there being at most a 0.001 probability of observing getting data this extreme solely by chance (if there is no real effect).
Shame, as great article otherwise
Incidentally, didn’t know about the high drop out rate for maths – could it make the relatively high numbers of higher classifications for maths a survivorship bias thing?
To follow up on Pete’s point, the OfS report compares the non-arrival rate of clearing entrants and unconditional entrants, but not the drop out rate. Given that without the use of unconditional offers, many of the institutions using them would accept far higher number of clearing entrants, the net drop out rate may well be higher if they were not used.
@Maan @Cath you are right, that is dreadful. I’ve fixed the definition based on Cath’s comment. Really sorry, can’t think where the original came from!
@Pete, @paul you raise an interesting point the lack of data on the drop-out rates of clearing entrants.
@david It isn’t just about the lack of data: it’s a serious methodological flaw.
The hypothesis being tested is that having an unconditional offer as a firm choice encourages students to slack off in the Upper Sixth and that this results in them being more likely to drop-out.
Testing this requires *everyone* with a Conditional Firm choice to be included in the Conditional dataset. But they aren’t if they do worse than expected in their A-levels and either end up in clearing (completely excluded) or accepting an Unconditional Insurance offer (and so in the Unconditional dataset).
Yet everyone who has an Unconditional Firm offer or who ends up accepting an Unconditional Insurance offer having missed their grades on a Conditional Firm offer is included.
I agree with Pete.
I had an unconditional offer. Interestingly enough I ended up getting higher A Level grades than was required for those given a conditional offer for the same course as me. I am also aware that I was not the norm amongst the group of students I associated with who also all received unconditional offers to our university (we formed a social group because we all knew in March we were attending that university, compared to our Conditional Offer peers who had to wait til August), but I do often credit my unconditional offer for my higher A Level grades. I do not do well in exams under pressure and no longer having to worry about them made my revision far easier. I also credit my ability to plan an extra six months in advance and make friends with my future peers so much earlier for my ability to stay at University.
None of us who received our unconditional offers dropped out. We all achieved very respectable degrees and, for the most part now hold down respectable jobs, the only ones not currently employed at a graduate level are dealing with medical issues. And this was a range of students, from across the country, vastly different backgrounds, doing very varied courses. The only thing that united us was that we attended the same university and we all had an Unconditional Offer.
Obviously there is a time and a place for unconditional offers. They should be used for academic potential, not to bribe students to attend lesser institutions. But they do have a purpose, and for some they offer a form of support that some of us genuinely need.
To understand drop out rates, it is vital to analyse what happens in the first year and especially the first term. It would be reprehensible if universities making a lot of UOs did not also review their student arrival and transitioning policies. Since HEIs do have incentives to retain students, they may be doing this as the differences in outcomes for UOs reported in the post are very small. From s statistical perspective, the lack of a control for institutional induction and monitoring arrangements is a weakness and a multi-level model is needed to accommodate these institutional fixed effects.
I concur with the unconditional support response. I have written numerous blogs on it. Interestingly, Mark Corver in his presentation at Wonkfest on Tuesday 5 November looked at the retention rates of first year students with conditional and unconditional offers and they were the same. There may be pressure selling in some areas but it really is important to not lose sight of the concept. It is essential to look at where unconditional offers are made and why conditional unconditional offers occur.