When we get the UCAS end-of-clearing report each September, it always feels like the real action is happening off-stage.
While the big national headline figures – percentage points on participation rates, numbers against previous years – do the rounds, planners and senior managers await the email that confirms the good (or bad) news that their systems are already telling them.
As well as can be expected
The 2018 cycle has long been characterised as make-or-break for a number of courses, departments, and even institutions. The demographics are briefly against HE for the next couple of years before we ride the oncoming wave early in the 2020s. There are more institutions in the system than ever before and there are concerns about international recruitment for the year that spans the uncertainty of Brexit. Competition – always fierce – has been almost lethal.
The sector should take some satisfaction in the participation rate among 18 year olds being higher in England than ever before. This comes after two years of near-daily negative stories about universities. Despite concerns around everything from employment rates to free speech, higher study is still a hugely attractive option. There has also been an 8% proportional increase in students over 25 – though strong performance elsewhere in the UK hides a worrying 4% drop in England.
Good news in Scotland?
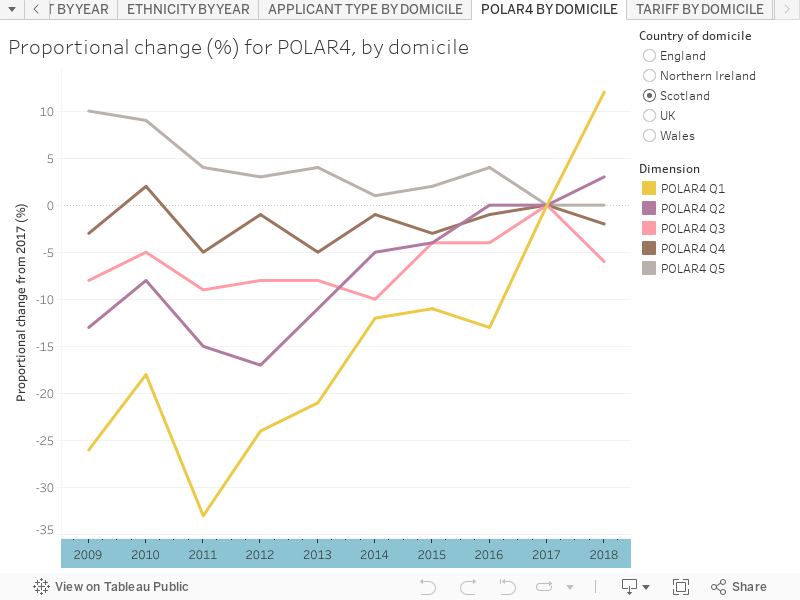
The biggest surprise for me is an amazing 12% proportion increase for POLAR4Q1 students in Scotland. The more usually used SIMD data still show the highest proportional increase in Q1. Whereas there is still clearly a lot of work to be done, this shows that what is being done is having a positive effect – encouraging indeed given that UCAS figures exclude HE delivered in Scottish FE colleges.
Other patterns in the data are largely as expected – patterns around ethnicity, tariff, and subject choice continue from previous years. A record 14,410 students applied directly to clearing – a trend we’ve been keeping an eye on as perhaps the purest expression of a higher education marketplace.
Visualising the data
There’s a whole range of visualisations for you to work with, for maximum viewing pleasure I’d recommend you click here.
In order –
- The “CYCLE” and “COMPARE BY DATE” tabs allow you to look at the complete clearing period for each year, or compare all years by a given time after (English) A-level results day. You can use the filters to look at pretty much any aspect of the data in both cases – where data is not available the graph will be blank.
- Further tabs are provided to quickly show some of the issues described above – you can view “SUBJECT BY YEAR”, “ETHNICITY BY YEAR”, “APPLICANT TYPE BY DOMICILE” (which shows differing clearing participation by domicile), “POLAR4 BY DOMICILE” and “TARIFF BY DOMICILE”. For each only a limited range of useful filters are available.
UCAS chose in its press release – as you would expect – to emphasise good participation rates, and also note proportional international recruitment increases, from both inside and outside the EU. It puts a rosy glow on what was always going to be a difficult year. The sector has done well, but we don’t yet know where it didn’t do well enough.
This year, more than ever, we await the end of cycle data by institution – 31 January should be circled red in our calendars. There’ll also be some more detailed analysis of sector-level data from UCAS towards the end of this year.