


Compared to the huge splash made with coverage of the recent data release on degree classifications, you’d be forgiven for not spotting the OfS’ update of the student characteristics outcomes data.
This is a real shame, as this unassuming release is probably one of the most useful timeseries the regulator maintains.
Inconvenient truths
Did you know, for instance, that:
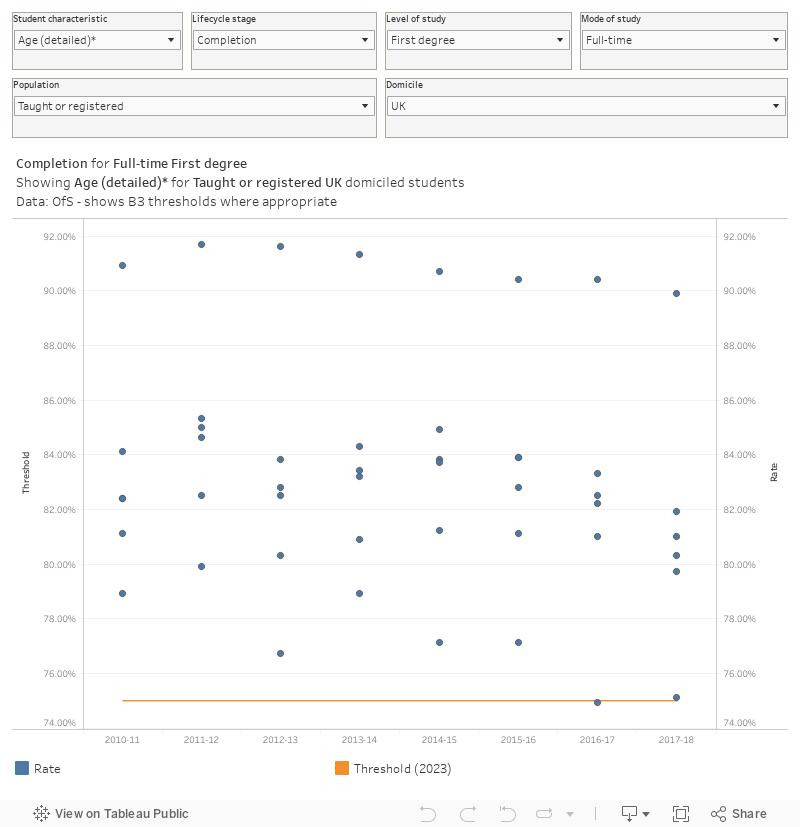
- Mature (21 and over) full time first degree students are 9 percentage points less likely to continue their studies beyond year one than their younger peers?
- Those studying a first degree full time at their local university are 5.1 percentage points less likely to progress to a “good” destination than those who study at a university not local to their pre-application address?
- Those from the most deprived quintile of small areas are 18 percentage points less likely than their less deprived peers to get a “good” full time first degree?
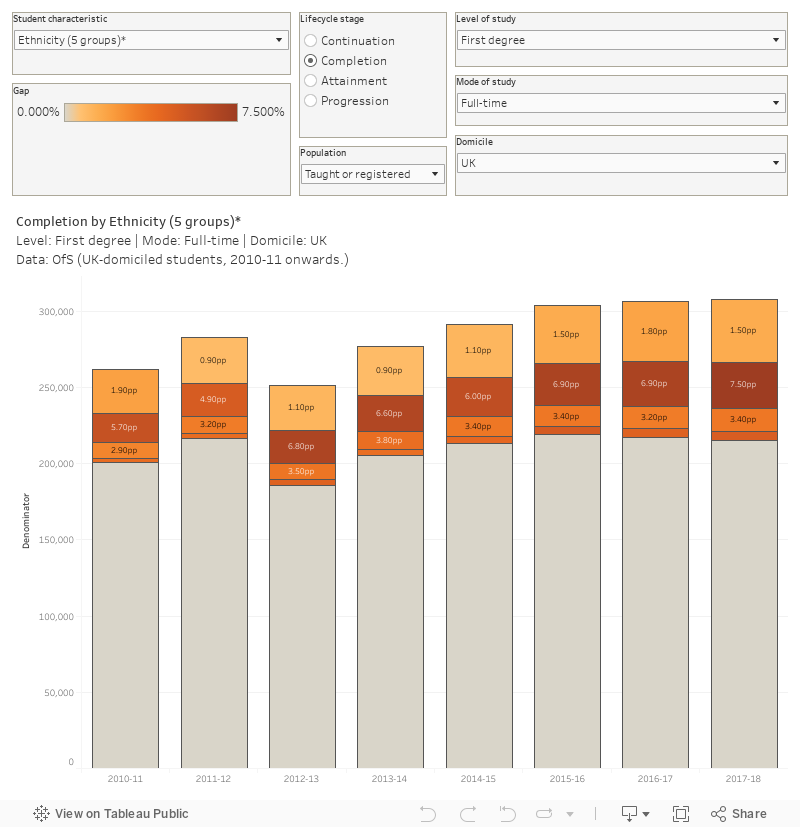
- Black students are 7.5 percentage points less likely to complete their full time first degree than their white peers?
- And that all of the above gaps have widened between the last two available years of data?
Here’s a dashboard to help you explore the data further.
Regulatory action
If you spend 10 minutes with that tableau you can easily find a significant number of shocking and upsetting differentials across all four of the provide lifecycle points. And you’d expect that detailed, research-informed, regulatory action is underway to compel higher education providers to address these problems.
You’d be wrong.
Instead, the Office for Students is investigating subject areas and course types where these same outcomes measures dip below a baseline threshold for (usually) a subject or mode of study group in a provider. It is looking, to be fair, at access and participation plans (but not explicit sector-level data-driven targets) across characteristics groups, but not to the extent of putting “boots on the ground.”
Here’s those thresholds as a reminder.
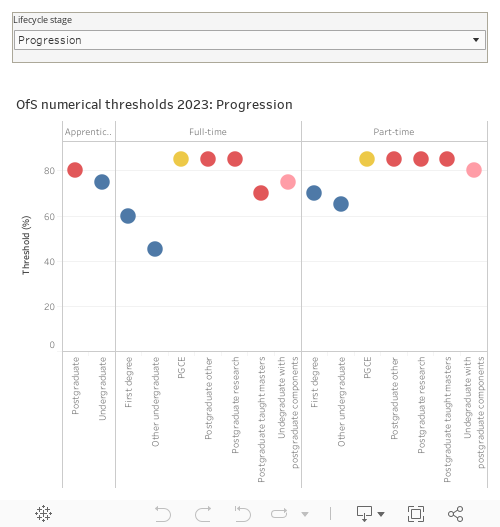
The idea seems to be, say, that OfS turns up at the business studies department of your local university and asks why so few students complete their course – with the likely response being “ah well, loads of Black students do this course and they are more likely not to finish their course nationally”. OfS then sets a target to improve continuation for that group of courses – something which could be achieved by investing heavily in teaching and student support, or by recruiting less Black students.
That’s a deliberately extreme example, because in reality we know that the OfS actually examines contextual factors like this before the boots are even laced up. The problem here is the messaging – the the treble-clef-mnemonic style absolutism of “every student deserves good outcomes” erases wider structural issues in a hurry to put the blame on a subject team at a provider.
For instance – is your course particularly appealing to those over 51? It could negatively affect your completion score. You could improve your course, or recruit younger students.
It’s really up to you.
Quasi-characteristics
A student’s entry qualifications or choice of subject sit on the boundary between a characteristic and a choice. Natural ability is just one of many possible explanations of level three results, and subject of study is heavily socio-culturally coded. Perhaps for this reason, OfS separates these two factors into a different data release. I’ve plotted it for you anyway.
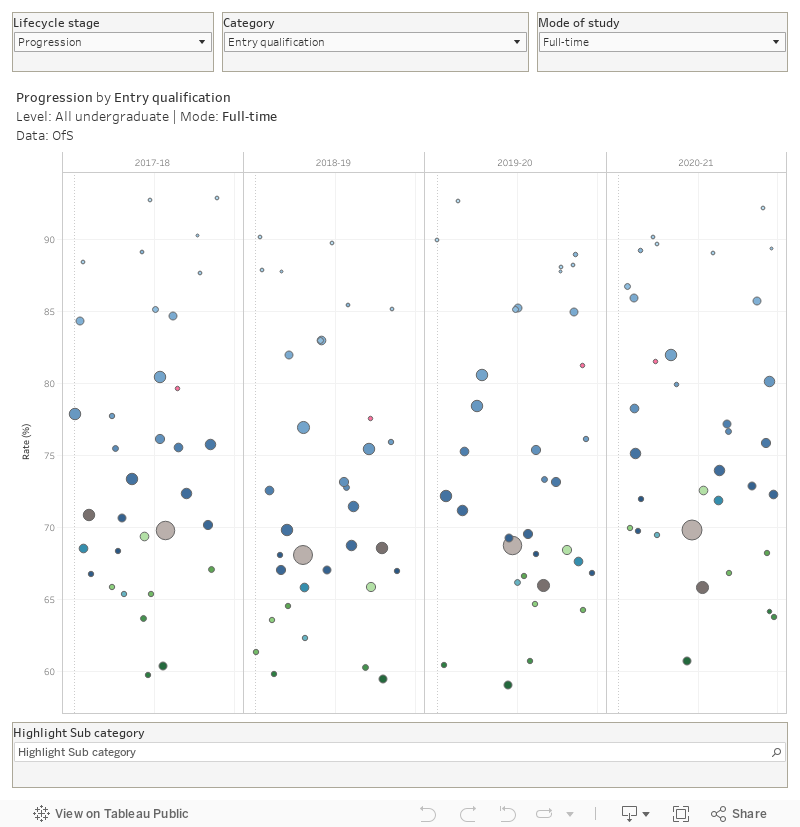
This dataset covers UK-domiciled undergraduate students, so we can apply the thresholds above to learn that you probably shouldn’t be recruiting BTEC students with three merits or below.