


We don’t get many prospective students reading Wonkhe – but just on the off-chance, don’t read this article until you have spoken to your firm and insurance choices, had a look on Clearing, and (if needed) spoken to your school about an appeal. There is nothing in this article that is more important than you doing those things.
For the rest of you, we will start with the thing everyone is talking about – the difference between the estimates that teachers made of grades and the awarded grades from the Qfqual report.
Estimates and awards
A huge number of A levels have been adjusted from the initial teacher estimates, and the majority of these have been adjusted downwards.
Extent of adjustment
| Down 3+ grades | Down 2 grades | Down 1 grade | Unadjusted | Up 1 grade | Up 2 grades | Up 3+ grades | Total | |
|---|---|---|---|---|---|---|---|---|
| % of A levels adjusted | 0.2 | 3.3 | 35.6 | 58.7 | 2.2 | <0.1 | <0.1 | 718,276 |
However, the estimates, on aggregate, were substantially above 2018 and 2019 attainment. In any year we would see grades awarded lower than the estimates on a UCAS form, so – on aggregate – we are on trend.
Difference between 2018, 2019, 2020 CEG, 2020 awards
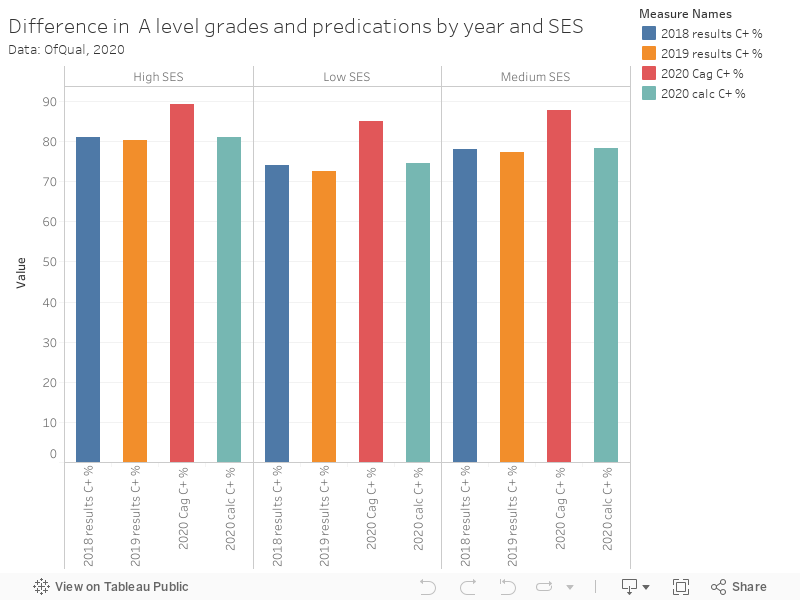
We keep saying “on aggregate” because that was the request that DfE made to Ofqual – to keep this year’s calculated results in line with previous years. Ofqual has achieved that goal, but the howls of despair from students, parents, and teachers suggest that this victory is a hollow one.
Those results in full
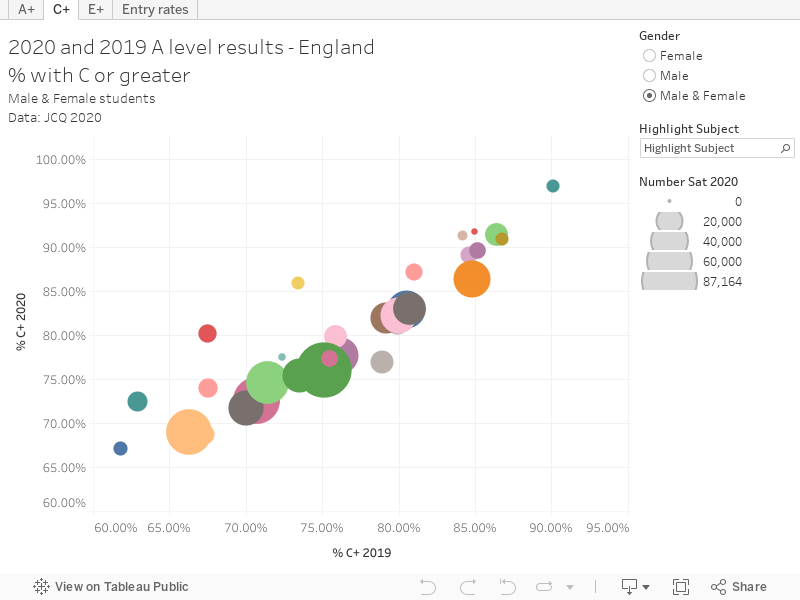
These graphs compare 2019 performance to 2020 as a scatter plot by subject, with the “size” (2020 entries) of each subject also shown. Only in a very few subjects do we see an aggregate fall in attainment over last year.
Results compared to 2019, for England
Results compared to 2019, for UK
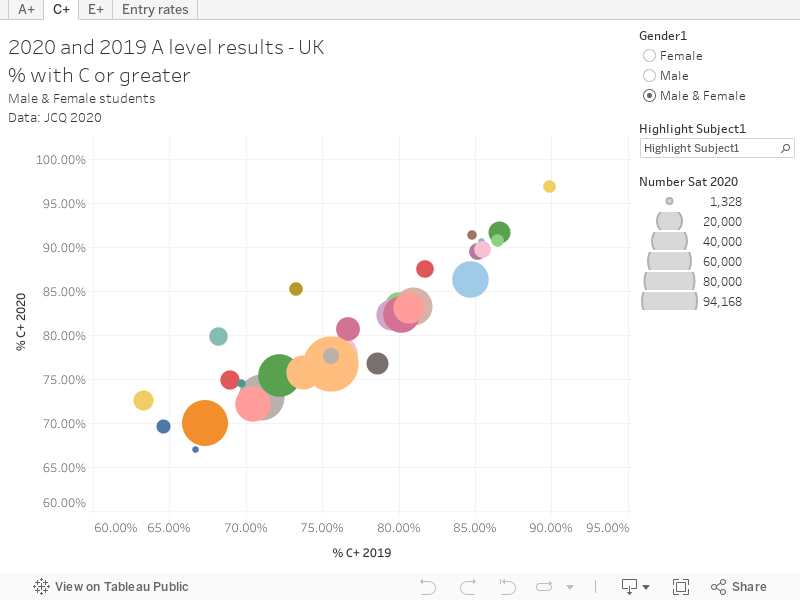
Welsh students learned yesterday that their calculated A levels would not be lower than their AS grades – with the latter qualification still commonly taken the year before A levels as it was in England until Gove’s reforms. This means that results in Wales are based on a conventional exam and assessed coursework, although calculations similar to the English and Scottish models still play a part. Though a similar promise about grades has not been made in Northern Ireland, students there also benefit from assessed coursework and AS level marks. Full data from JCQ is here.
Just as good/bad as any other year?
Ofqual has released a detailed analysis of the 2020 results, most of which comprises evidence that the number of ways in which A levels highlight structural inequalities in other years are also true for 2020.
Comparisons by characteristic
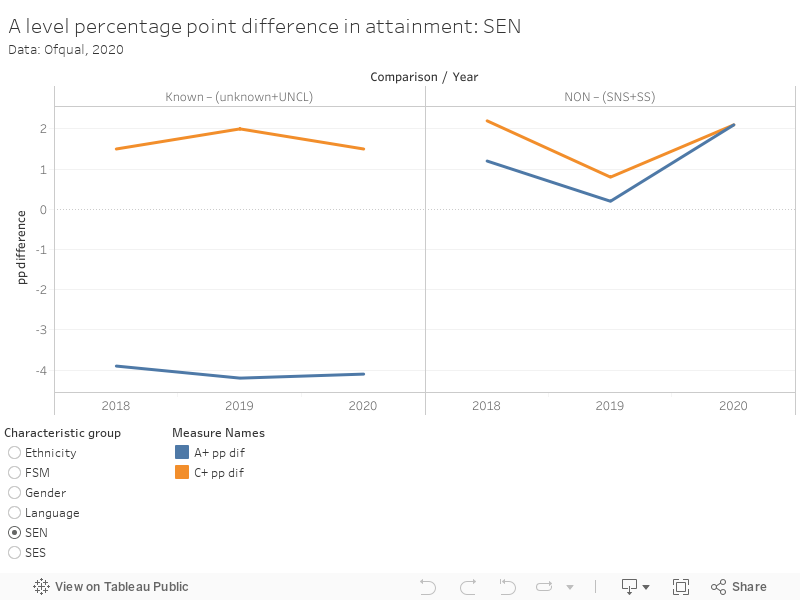
But it is not universally as normal. As you can see above, the difference in attainment between students with statements of need and other students has risen sharply this year, and there is a similar leap in the difference between students on free school meals and those that do not.
What this looks like is an expression of the difference at centre level – centres with large numbers of students on free school meals and students with statements tend to perform worse at A level. We don’t get quite the data we need to see that, but we do get some interesting overall data on centre type.
Attainment by centre type

What’s striking here is the rise in public school attainment. Some of these will have been smaller centres (where teacher estimated grades would have been used without change), and there is an element of historic high performance – but none of this explains why the percentage of students getting an A level at C or above has risen to 48.6 this year.
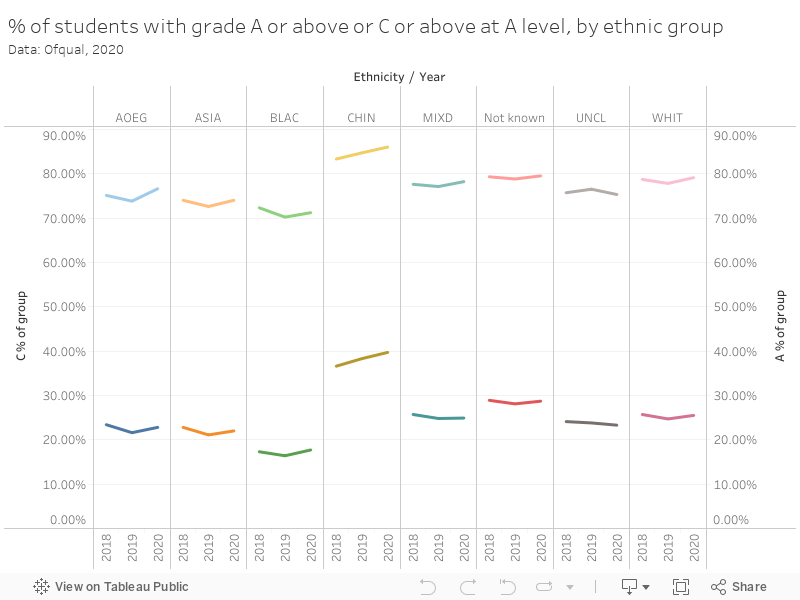
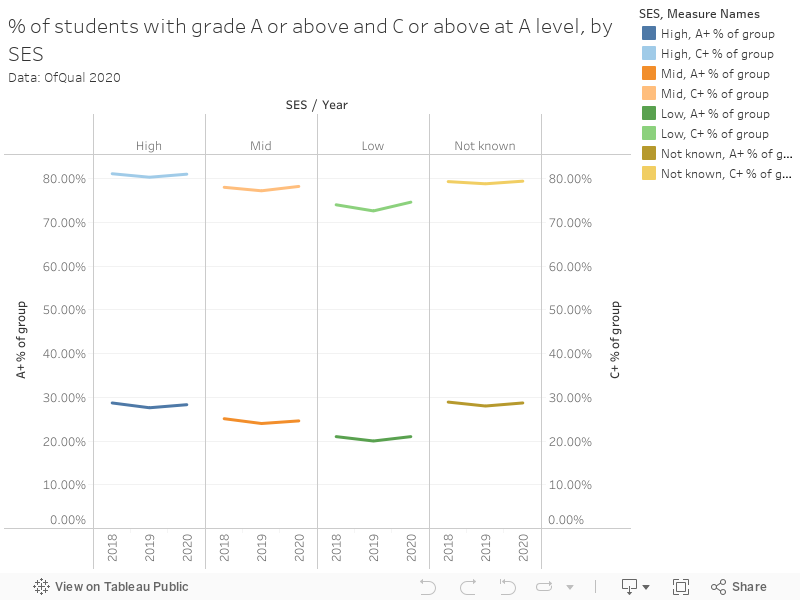
The changes are not as striking by ethnicity and background (SES, at three levels), but it is still worth noting the underlying disadvantage faced by students with less well off backgrounds.
Attainment by ethnicity
Attainment by SES
Of course, all of this is based on the raw, calculated, results – and does not take into account the impact of the many expected appeals. We should be concerned about the further boost this could offer sharper elbowed better-off families and schools with good track records – the ability to write a good appeal is not necessarily correlated with how much a regrade is deserved, and the fees levied for unsuccessful appeals will be off-putting without the financial resources to swallow the cost.
The sector responds
The overarching theme of the flurry of statements put out today is one of congratulations and pride. Reading them, you could be convinced that this year was the same as any other, the same noting of progress made closing important gaps, the same pushing of the organisation’s special service (whether it’s Clearing Plus or Discover Uni), the gentle reminder that even if you didn’t get the grade you wanted it’s not all over. Only the widespread acknowledgement of the rise in nursing admissions hints that this year is not standard.
At best, you have assurances, from the likes of the Russell Group or University Alliance, that universities understand that this year is complex and that their members will be flexible. But it seems that no one will even mention that after watching the Scottish government flail for a week, Gavin Williamson has decided that he’d quite like to do the same. Even the UCAS statement, with its barrage of statistics, can’t bring itself to print the one that will dominate the day’s news. For all the assurances that things will work out, that more students from the most disadvantaged backgrounds have been admitted to university and that they should be proud of their achievements, two-fifths of students have woken up today to see that the government has lowered their grade. It would be nice if people at least acknowledged it.
Meanwhile, at UCAS
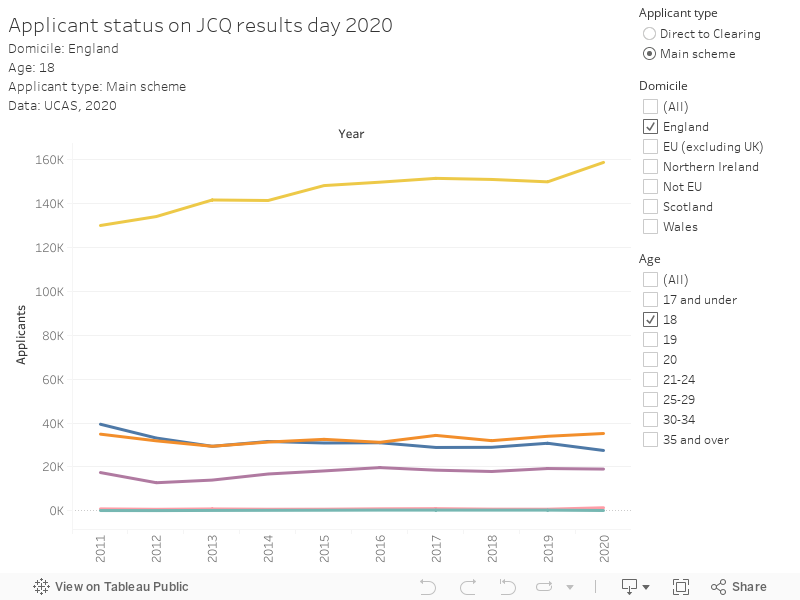
These A level results have been used to place students already, and the good news for many nervous applicants is that there are more students with places at this point in the cycle than in any of the last 10 years. There is a rise in students of all ages holding an offer (who have a place that they have yet to accept) but as you would expect we don’t see this at age 18.
UK wide we see a sharp increase in applicants entering clearing directly, but an unexpected fall in applicants from the main scheme free to be placed in clearing.
Applicant status
If there is going to be a rush of deferred entries, we can’t see it yet. We’re down on this point last year, suggesting that students have not been making decisions about starting in 2021 before results are available.
Deferrals
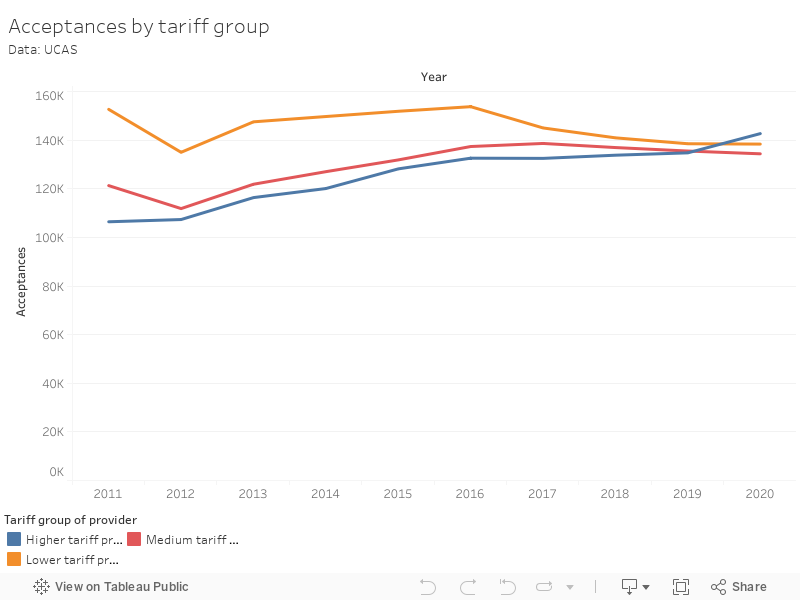
Perhaps the most noticeable trend that we did expect is the growth in placed students at this point in the cycle at high tariff providers. It has long been expected that providers who may be facing a sharp and financially painful drop in international applications would use these spaces to recruit UK students – the sharp shift in the curve suggests that conditional grades at these providers have been lower than in previous years
Tariff group
One good news story is a sharp rise in early recruitment for nursing and other subjects allied to medicine. The rate of increase beats even last year’s growth, with subjects allied to medicine above biological sciences on results day for the first time since 2014. With the news that providers in England are now able to recruit as many students in this subject area as they have space for (which makes something of a mockery of the summer’s additional student numbers competition).
Subject
What’s next?
UCAS’s clearing data will be fascinating over the next few weeks, and we’ll be keeping an eye on the trends as you would expect. There’s been a lot of talk about clearing being larger and more competitive and ever – we’re in the second year of “self release” and the first year of the Clearing Plus recommendation service which will both have an impact, but the main drive will come from providers looking to fill spaces that would otherwise be empty. This will particularly involve the kind of highly selective provider that, in the past, would take very few students from clearing.
Politically, we’ve written off Gavin Williamson many times before, but surely he cannot survive the events of the last couple of days. There have been rumours of a reshuffle all summer – and the chaos in the education system at the moment suggests that all current ministers (including Michelle Donelan and Schools Minister Nick Gibb) must be particularly precarious.


It is the attainment by centre type table that maps – in the real world of admissions – onto my experience today: total silence from the independent school advisers and heads who are usually on the phone first and colleagues from large FEs and selective grammars (of which we have a fair few on our patch) who say the their young people are devastated. So sad.
The Ofqual data on attainment by socio economic status and ethnicity needs to be treated with caution because 16% records were unknown – my very strong suspicion is that these relate to independent school students not on the National Pupil Database. Ofqual made an assertion that the 2020 result process avoided differentiation by class on inadequate data.
The data on centre type (state comprehensive, state selective etc) is also pretty shonky. I’ve complained about this classification to UCAS and offered help to come up with a better one UCAS referred me to DFE. Ofqual say they got the centre classifications from JCQ. Some of the obvious errors are:
* secondaries that converted to academy status have been lumped in a single group (combining selective and non selective)
* this splits the state selective group (c165 schools) and state comprehensive group in two.
* a large and growing number of 11-18 secondaries are comprehensive at 11+ but selective at 16+
* there are 150 centres in the Other camp
* the Independent group is a single group, ranging from hyper selective schools for the very rich to any institution which isn’t directly state funded.
If you believe that there was ‘In most cases, your rank (by subject and school) would determine your position (and thus grade) on a curve defined by previous groups’ you are mistaken. My son’s school was in the top 5% for A-level achievement and has jumped through all the hoops and hurdles thrown at (and has had an Outstanding Ofstead report for over 10 years). It has not had a U grade for over 10 years and very few E’s or D’s for, yet being in the West Country, the grades were drastically chopped – BCC down to DDU.
I therefore can’t agree any previous attainment at all was used…
Smells (rather stinks) a bit fishy to me..