


The UK’s student finance systems are commonly compared through loan outlay, repayment rates and the Resource Accounting and Budgeting (RAB) charge. But those measures don’t fully capture the underlying fiscal question.
Since September 2019, the Office for National Statistics has treated the portion of a student loan that isn’t expected to be repaid as public expenditure when the loan is issued. It records that amount as a capital transfer from government to the borrower.
In this analysis, “student-loan expenditure” means the expenditure recorded in the national accounts from student lending – principally the amount that isn’t expected to be repaid, together with later adjustments affecting existing loans. It’s different from “loan outlay”, which is the cash actually lent to students.
This produces a clearer measure of the national-accounts expenditure associated with student lending than the face value of loans issued. It also exposes a large difference between two possible definitions of equivalence.
HM Treasury doesn’t provide a population-based, freely usable allocation corresponding to England’s recognised student-loan expenditure. Instead, devolved lending is governed through separate controls over loan outlay and subsidy costs, and the resulting budget cover remains tied to loan outlay, impairment and valuation effects. The forecasts, modelling and ministerial advice used in applying these controls are unpublished, and HM Treasury refused a Freedom of Information request for them in 2026.
An alternative population-based test would ask what level of student-loan expenditure would be recorded for each nation if England’s expenditure per resident were used as the benchmark.
These methods produce very different results.
Between 2012–13 and 2024–25, ONS recorded £82.887 billion of student-loan expenditure for England. Scaling that spending to the populations of Wales, Scotland and Northern Ireland produces a devolved population-share equivalent of £15.353 billion.
The expenditure attributed to the three devolved nations was £5.986 billion. The difference was £9.367 billion.
This isn’t money to which the devolved administrations were formally entitled under the existing funding rules. It measures the additional student-loan expenditure that would have been recorded for the devolved nations if their expenditure per resident had matched England’s. It isn’t a redistribution of the existing UK total and doesn’t establish that this amount was available under the actual funding settlement.
The central distinction therefore isn’t between generous and ungenerous systems. It’s between a fiscal system in which the costs associated with student lending are recognised through dedicated loan-budget arrangements and one that would provide equivalent fiscal capacity irrespective of whether support was delivered through loans, grants or direct institutional funding.
The devolution settlement didn’t give each nation a population share of England’s student-finance expenditure. From the early devolved period, loan finance was treated separately from ordinary devolved programme budgets: the subsidy and bad-debt cost of lending was modelled within the spending-control system, while the cash advanced through student loans was financed separately and was later formalised in AME.
The modern comparability regime preserves that basic structure: loan-related cover follows the lending and costs a devolved system actually generates, rather than providing a population-based sum that can be used another way. Once ONS partitioning made expected non-repayment visible as national-accounts expenditure, including retrospectively, the territorial consequence became measurable.
In this deep dive…
- ▸ What counts as student-loan expenditure
- ▸ The ONS country-level expenditure series
- ▸ Annual ONS-recorded student-loan expenditure
- ▸ Cumulative ONS-recorded expenditure since 2012
- ▸ A population-share counterfactual
- ▸ Why Treasury equivalence gives a different result
- ▸ How the architecture developed through the 2012 reforms
- ▸ What the £9.367 billion difference does and doesn’t mean
- ▸ Limitations of the ONS series
- ▸ Policy options
- ▸ Not neutral
- ▸ Sources
What counts as student-loan expenditure
When government issues an income-contingent student loan, it doesn’t expect to recover the full face value. The ONS “partitions” the transaction into:
- a financial loan expected to be repaid
- a capital transfer representing the amount not expected to be repaid
The transfer component is recorded as public expenditure at the point the loan is issued.
This is conceptually different from loan outlay. If a government advances £10,000 but expects to recover only £7,000 in present-value terms, the public expenditure isn’t the full £10,000. Nor is it zero. The initial capital transfer is approximately £3,000.
The transfer proportion is therefore the share of loan outlay classified as expenditure in the national accounts.
ONS introduced this partitioned treatment in September 2019 following concerns that the previous treatment understated both government borrowing and the economic cost of student lending.
The transfer proportion is related to, but not identical to, the RAB charge.
The RAB charge is a budgeting measure based on the estimated government cost of new lending using HM Treasury’s financial-instrument discount rate. The transfer proportion is a national-accounts measure using the effective interest rates applying to borrowers.
The two measures can diverge because they apply different discounting conventions and serve different accounting purposes.
The expected cost of non-repayment wasn’t unknown before 2019. HM Treasury’s Public Expenditure Statistical Analyses 2000–01 explicitly said that the cost of student loans was included in DEL on the basis of an assessment of the subsidy implied by lending and the bad-debt provision required.
The problem was different: the national accounts didn’t recognise expected non-repayment upfront as public expenditure. The 2019 partitioned treatment changed that and, applied retrospectively, made it possible to see both the scale and territorial distribution of that expenditure.
The ONS country-level expenditure series
England publishes annual transfer proportions through the Department for Education’s student loan forecasts.
Comparable headline rates aren’t routinely published for Wales, Scotland or Northern Ireland. However, the ONS Country and regional public sector finances supplementary tables contain the amount of student-loan expenditure recorded for each UK nation.
Table S8 reports this under “capital accounting adjustments for student loans”.
The annual figure isn’t simply the expected non-repayment attached to loans issued that year. It can also include later adjustments when actual repayments differ from earlier estimates, significant policy changes affect existing loans, or loan sales produce a gain or loss against the value recorded in the public finances. Routine updates to economic forecasts can change the recorded value of the loan stock without changing public expenditure.
The figures for Wales, Scotland and Northern Ireland are country-level figures supplied to ONS rather than amounts produced by simply dividing the UK total by population. They don’t, however, show that every amount was incurred by the relevant devolved administration or arose solely from that administration’s policies.
Annual ONS-recorded student-loan expenditure
The ONS series gives the following figures for the six years from 2019–20 to 2024–25.
All figures are £ millions.
| Financial year | England | Wales | Scotland | Northern Ireland | UK |
|---|---|---|---|---|---|
| 2019–20 | 8,757 | 392 | 224 | 131 | 9,504 |
| 2020–21 | 10,032 | 430 | 262 | 91 | 10,815 |
| 2021–22 | 8,942 | 503 | 188 | 81 | 9,714 |
| 2022–23 | −1,264 | 4 | 148 | 54 | −1,058 |
| 2023–24 | 8,606 | 141 | 205 | 82 | 9,034 |
| 2024–25 | 7,517 | 140 | 351 | 67 | 8,075 |
| Total | 42,590 | 1,610 | 1,378 | 506 | 46,084 |
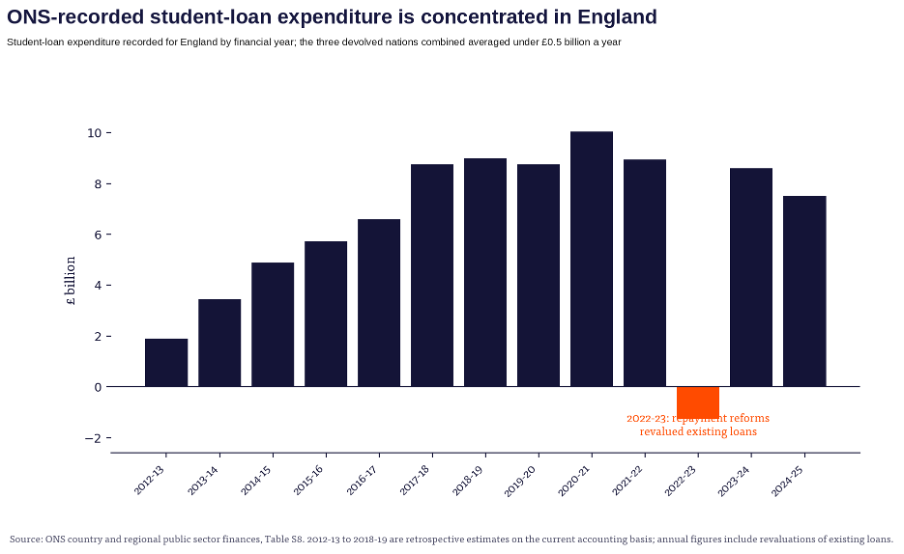
The figures show the student-loan expenditure recorded by ONS for each nation in each financial year. They don’t show the amount of cash lent to students.
Most of this expenditure comes from amounts that aren’t expected to be repaid, but the annual figures can also include later adjustments when actual repayments differ from earlier estimates, significant policy changes affect existing loans, or loan sales produce gains or losses against the recorded value of the loan book. Routine changes to economic forecasts can change the value of the loan stock without themselves changing public expenditure.
The clearest example is 2022–23. England recorded a negative £1.264 billion student-loan expenditure adjustment and Wales recorded only £4 million.
This largely reflects the national-accounts effect of repayment reforms that increased the estimated value of existing English and Welsh student loans. The negative expenditure didn’t represent a cash receipt of £1.264 billion. It represented an increase in the value assigned to the government’s loan asset.
Comparisons across the years from 2021–22 to 2024–25 need some care. The series in this period reflects major repayment-policy reform in England and Wales, announced in February 2022, as well as later adjustments when actual repayments differed from earlier estimates. Changes to economic forecasts and valuation models can alter the value of the loan stock without necessarily changing public expenditure. Year-on-year movements in this window therefore aren’t a reliable guide to changes in underlying lending.
Adding several years together offsets some positive and negative annual adjustments and reduces the prominence of any one year. It doesn’t remove policy adjustments or convert the series into a measure of transfers on new lending alone. England’s negative £1.264 billion in 2022–23, for example, depresses every devolved population counterfactual calculated for that year.
Cumulative ONS-recorded expenditure since 2012
The longer period beginning in 2012–13 is particularly relevant because it captures the period following England’s major shift from direct teaching grant to higher tuition fees supported by government loans.
A methodological note applies to the earlier years. ONS implemented the partitioned treatment in September 2019 and applied it retrospectively within the public finance series. Figures for 2012–13 to 2018–19 are therefore historical estimates presented on the current accounting basis, rather than amounts classified as capital transfers in publications issued at the time.
Between 2012–13 and 2024–25, the ONS series attributes:
| Nation | ONS-recorded student-loan expenditure | ||||
|---|---|---|---|---|---|
| England | £82.887bn | ||||
| Wales | £2.683bn | ||||
| Scotland | £2.307bn | ||||
| Northern Ireland | £996m | ||||
| UK total | £88.873bn | ||||
The figures show how heavily ONS-recorded student-loan expenditure has been concentrated in England.
This is partly a result of population, and is also a result of policy design. England has generated much larger tuition-fee loan balances, larger aggregate outlay and substantial expected non-repayment.
Scotland has funded undergraduate tuition mainly through direct public expenditure rather than tuition-fee loans. Northern Ireland has retained significantly lower tuition fees. Wales has continued to use substantial loans, but combines them with income-related maintenance grants.
These choices affect the amount recorded as student-loan expenditure even when the underlying systems are supporting comparable educational activity.
A population-share counterfactual
A simple alternative comparison is to take England’s recognised expenditure in each year and apply it to the populations of Wales, Scotland and Northern Ireland relative to England.
This asks:
What amount of student-loan expenditure would have been recorded for each nation if expenditure per resident had matched England?”
The calculation was undertaken year by year using the population series in the ONS supplementary workbook, and is set out in full in analysis table 1. It therefore reflects small changes in the relative populations over time.
For 2012–13 to 2024–25, the result is:
| Nation | English per-capita expenditure benchmark | ONS-recorded expenditure | Difference | ||
|---|---|---|---|---|---|
| England | £82.887bn | £82.887bn | — | ||
| Wales | £4.581bn | £2.683bn | £1.898bn lower | ||
| Scotland | £7.986bn | £2.307bn | £5.679bn lower | ||
| Northern Ireland | £2.786bn | £996m | £1.790bn lower | ||
| Devolved nations total | £15.353bn | £5.986bn | £9.367bn lower | ||
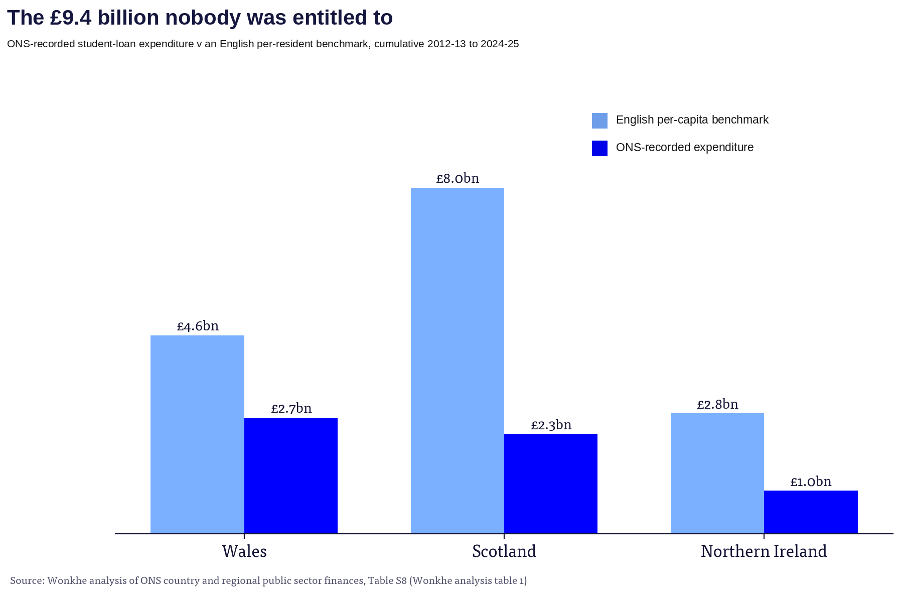
This counterfactual holds England’s expenditure unchanged and extends the English per-capita rate to the other nations. It therefore produces a hypothetical UK total for this student-loan series £9.367 billion above the actual recorded total, rather than redistributing the actual UK total between nations.
The expenditure attributed to the devolved nations collectively was £5.986 billion. Their English per-capita benchmark was £15.353 billion.
Attributed expenditure was therefore approximately £9.367 billion below the population-based counterfactual.
Expressed against the English per-capita benchmark:
- the expenditure attributed to Wales was equivalent to about 59 per cent
- the expenditure attributed to Scotland was equivalent to about 29 per cent
- the expenditure attributed to Northern Ireland was equivalent to about 36 per cent
These percentages don’t measure the generosity or total cost of the respective higher education systems. They measure the extent to which student-loan expenditure was recorded for each nation relative to the expenditure that would have arisen under an English per-capita pattern.
Sensitivity tests
Three results from the accompanying analysis tables (see below) qualify and strengthen the headline figure (tables 1 to 3).
First, the unusual 2022–23 figure reduces the headline gap. Because England’s negative expenditure in that year reduces its own benchmark, excluding 2022–23 raises the cumulative combined gap to approximately £9.8 billion.
Second, the finding doesn’t depend on the retrospectively estimated years. Splitting the period at the introduction of the published partitioned treatment, approximately £5.0 billion of the combined gap accrues in 2012–13 to 2018–19 and £4.3 billion in 2019–20 to 2024–25.
Third, the gap survives switching the denominator from residents to students. Using HESA enrolments by permanent address (available on a consistent basis from 2014–15; see analysis table 3), England’s expenditure per England-domiciled student applied to each nation’s actual enrolments gives, for 2014–15 to 2024–25: Wales £4.60 billion against £2.53 billion attributed (55 per cent); Scotland £6.36 billion against £2.15 billion (34 per cent); Northern Ireland £2.04 billion against £0.89 billion (44 per cent); a combined gap of £7.4 billion.
Even measured per actual student rather than per resident, the expenditure attributed to the devolved nations runs at between one third and just over one half of the English rate. This remains an approximate sensitivity test rather than a matching expenditure-per-borrower calculation: the ONS expenditure series and HESA enrolment denominator don’t have identical product or population coverage, and HESA enrolments include students who receive no loan support. Differences in the number of HE enrolments therefore explain only part of the population-share gap.
Decomposing volume and rate
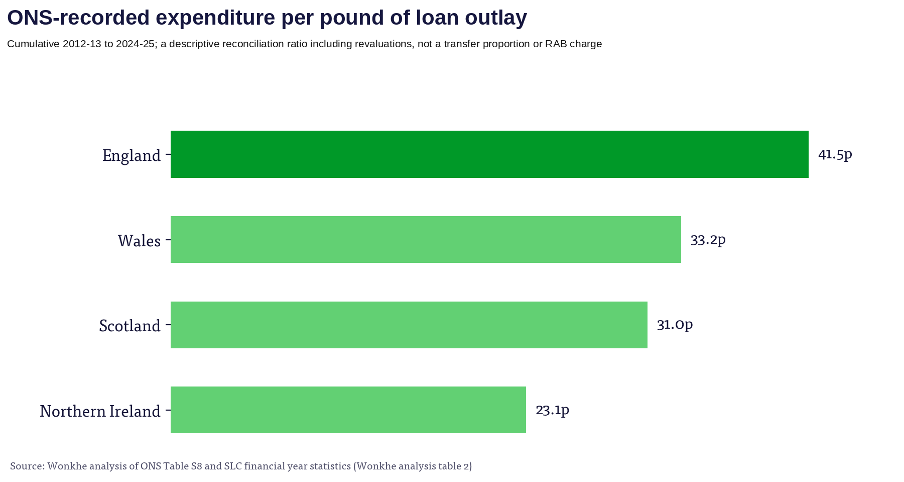
Combining the ONS series with SLC outlay data for England, Wales, Scotland and Northern Ireland (analysis table 2) allows a rough decomposition of the population-share gap. Cumulative ONS-recorded expenditure relative to loan outlay over 2012–13 to 2024–25 (a descriptive reconciliation ratio, not a transfer proportion or RAB charge) runs at 41.5 per cent for England, 33.2 per cent for Wales, 31.0 per cent for Scotland and 23.1 per cent for Northern Ireland.
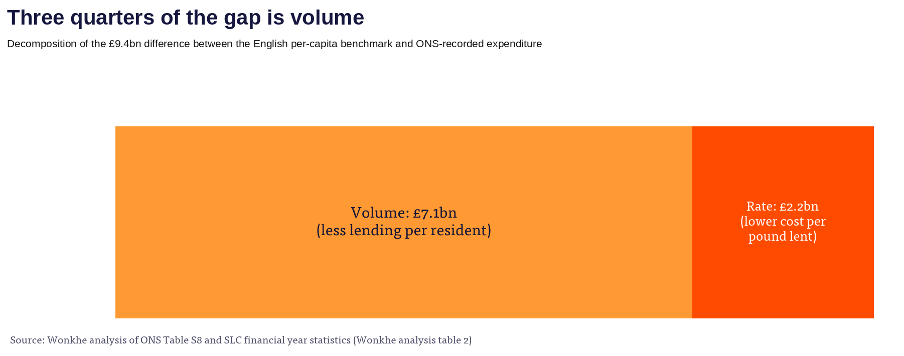
Under a decomposition that first applies England’s expenditure-to-outlay ratio to actual devolved lending, a combined benchmark of about £8.2 billion stands against £6.0 billion attributed: approximately £2.2 billion of the gap is associated with the lower expenditure recorded per pound lent, and the remaining £7.1 billion of the £9.4 billion population-share gap with lower lending per resident.
On this decomposition, the gap operates approximately three quarters through lending volume and one quarter through the recorded expenditure rate. The split isn’t a unique division of the gap – the interaction between volume and rate is assigned here to the volume component, and reversing the order of the decomposition would produce a different split.
Cross-border incidence
Cross-border study doesn’t need to be netted out of the population benchmark simply because a student studies elsewhere in the UK. Student-finance liabilities attach to the student’s home finance system. Cross-border flows matter separately, however, because fee income is received by the institution at which the student studies.
Using the HESA domicile-by-provider matrix for full-time undergraduates in 2024–25 (analysis table 4), and an illustrative host-level fee of approximately £9,250 per student per year, gives an indication of the provider-side incidence.
Around 94,500 English-domiciled full-time undergraduates study at providers in the devolved nations. At an illustrative fee of £9,250 each, those places correspond to around £874 million a year in gross fee income. After allowing for devolved-domiciled students studying in England, the illustrative net flow to institutions in the devolved nations is approximately £560 million a year.
On this illustrative calculation, Scottish institutions are the largest net recipients of cross-border fee income, hosting a net 40,000 more incoming UK students than Scotland sends out, equivalent to roughly £370 million a year. Welsh institutions receive a net £170 million a year. Northern Ireland’s institutions are a small net importer, at roughly £20 million a year.
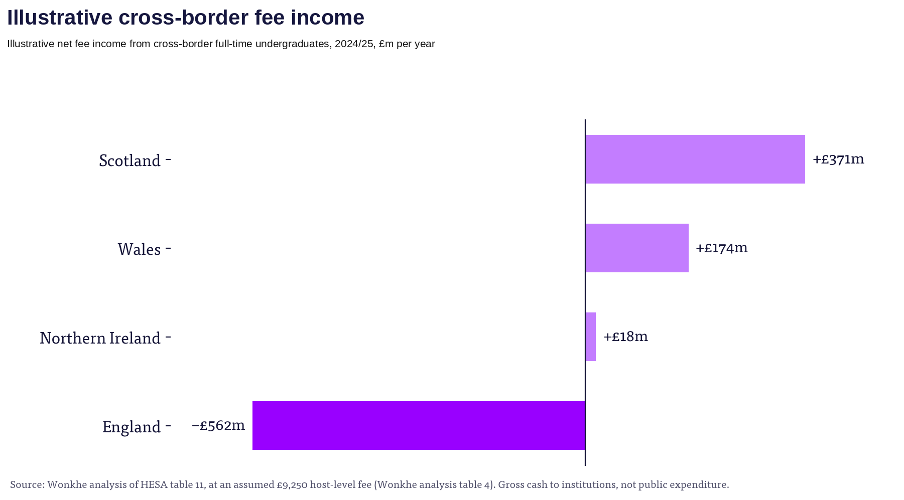
The estimate is deliberately illustrative. It applies a single fee assumption and uses enrolment counts rather than observed loan take-up. It measures cash income to institutions rather than public expenditure. Maintenance support would create an additional flow of spending into host economies, although it wouldn’t ordinarily constitute income received by institutions.
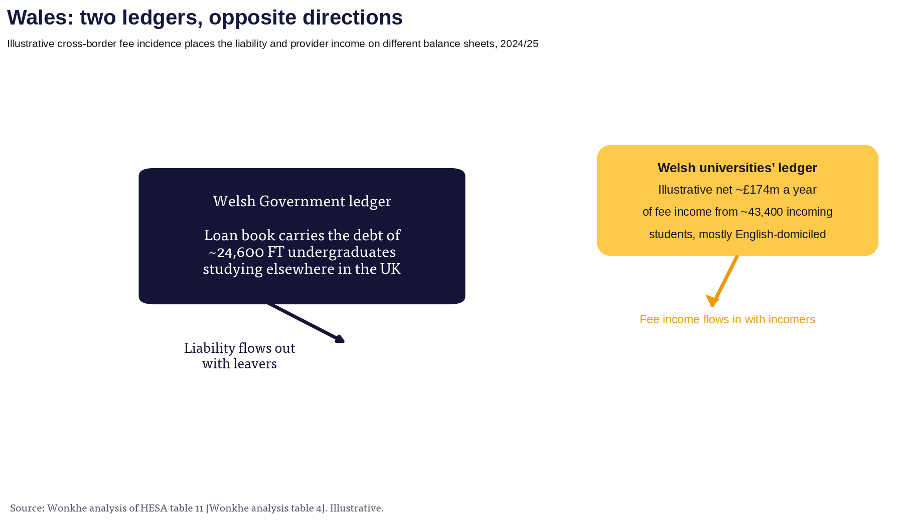
The estimate nevertheless clarifies the incidence. The loan liability relating to students who leave sits with the student’s home finance system. For incoming students, the associated fee-loan liability doesn’t sit in the devolved student-finance system. For Wales in particular, the loan liability attached to leavers and the sector’s net gain from incomers sit on different balance sheets.
Why Treasury equivalence gives a different result
HM Treasury doesn’t apply this population-share test. Nor is there a single undifferentiated Treasury calculation.
The underlying devolution arrangement therefore wasn’t a population allocation of England’s student-finance spending. Early evidence comes from Scotland. A 2006 Scottish Parliament answer explained that tuition fees, grants, bursaries and the student-loan subsidy sat within the Scottish Executive budget, while student-loan advances were paid by HM Treasury from outside both the Scottish Executive budget and Total Managed Expenditure. From 1 April 2006, Treasury reclassified those advances and repayments into AME, with the answer stating that all AME expenditure was met in full by Treasury.
HM Treasury’s Public Expenditure Statistical Analyses 2007 records the same change in budgetary terms: net lending to students in Scotland and Northern Ireland moved from non-budget into capital departmental AME, a change already made for England and Wales in the previous year’s publication. The modern comparability controls therefore sit on top of an older structural separation between Treasury-financed loan cash and the devolved administrations’ flexible programme budgets.
The published evidence indicates at least two distinct controls – a comparability control on loan outlay, funded through AME, and a budget control on subsidy costs, covering the RAB charge and related valuation effects. These controls don’t all use an identical calculation.
Northern Ireland’s outlay comparison applies English fee arrangements to Northern Irish borrowers. The Welsh Government’s March 2026 material describes the 2025–26 RAB cover as limited to a Barnett share of England’s forecast RAB charge. The precise operation of the controls may differ between administrations and over time.
The outlay control is driven principally by:
- borrower numbers
- tuition-fee levels
- maintenance-loan entitlements
- loan take-up
- the interaction between loans and grants
The subsidy-cost control is additionally affected by:
- repayment thresholds and terms
- borrower earnings
- expected repayments and write-offs
- discount rates
If a devolved administration creates smaller loan balances, the modelled cost to government is lower. Under this method, lower borrowing is treated as requiring less loan-related budget cover. The difference doesn’t become flexible spending available for teaching, grants or student support.
The gap against the population benchmark reflects two broad differences – the amount lent per resident, and the expenditure subsequently recognised relative to that lending. No decomposition of this gap is published, but the main terms can be identified.
Under the first aspect, one important component is borrowers per resident. Higher education participation, loan take-up and, in Scotland and Northern Ireland, controls on student numbers can all reduce the borrower base on which an English-policy counterfactual would be calculated.
Under the second aspect, graduate earnings work in the opposite direction: where devolved graduate earnings sit below the English average, a larger share of each pound lent under English-scale balances would be written off, raising the counterfactual cost per borrower.
Composition effects inside England’s own figure, such as London-rate maintenance loans and products like Advanced Learner Loans, mean that English policy applied elsewhere produces less than England’s per-resident average almost mechanically. Longer Scottish degree courses cut the other way.
The formal budget mechanics are more complicated than a single reimbursement mechanism. Under Treasury’s 2026–27 guidance, the cash lent to students scores in capital AME. Impairment up to a Treasury-set target now scores in resource AME. This is a change from 2025–26, when impairment up to the target sat in ring-fenced resource DEL. It is part of a wider 2026–27 Treasury change that removed the old RDEL ringfence for depreciation and impairment across government.
If impairment rises above the target because forecasts turn out to be wrong or the student-loan model is updated, the excess first scores in resource AME but is then moved into resource DEL over a period of up to 30 years. If a government changes policy in a way that increases impairment, that extra cost scores directly in resource DEL. Treasury says these rules apply equally to England and, where appropriate, the devolved governments.
Treasury’s arrangements therefore provide loan outlay and specified valuation effects through tightly controlled budget categories. Moving ordinary impairment into AME protects fixed departmental budgets from some of the normal volatility in loan valuations. But under the general rules, a devolved administration can still ultimately face resource DEL costs if its loan book performs worse than the Treasury target because forecasts turn out to be wrong or the model changes, as well as where its own policy choices increase impairment.
Some important drivers of repayment, especially graduate earnings and wider economic conditions, are outside devolved control. The available cover remains tied to student-loan transactions and modelled loan costs rather than becoming a freely usable allocation for higher education.
The Welsh Government’s March 2026 briefing to the Senedd (see below) describes how the 2025–26 arrangement worked. It said RAB cover was ‘limited to a Barnett share of England’s forecast RAB charge’, with any excess met from the Welsh resource budget.
More generally, lower modelled loan costs don’t automatically become freely usable funding for another purpose. A lower-cost scheme may reduce exposure to costs above a Treasury control, but the saving isn’t automatically redirected to teaching, grants or student support.
The same applies to the volume of lending. Where the outlay comparator is applied to the administration’s actual borrower population, as the Northern Ireland material indicates, policies that reduce participation or impose number controls shrink the notional comparator alongside the borrower base. Reducing lending or borrower numbers doesn’t generate a corresponding freely usable allocation through the student-loan machinery.
The underlying forecasts, modelling and ministerial advice used in applying the comparability arrangements aren’t published, and HM Treasury has refused their disclosure. In response to a Freedom of Information request, the Treasury confirmed that it holds devolved governments’ student loan expenditure forecasts covering loan outlay and the RAB charge submitted between 2022 and 2025, modelling updates, Treasury-authored ministerial submissions on the financial implications for 2022–23 to 2024–25, and devolved government authored documents comparing devolved loan outlay to English outlays.
It withheld all of this material under sections 28(1) and 35(1)(a) of the Freedom of Information Act, declining partial disclosure, on the basis that historical applications of the comparability test engage relations within the UK and the current year’s application constitutes ongoing policy development.
Sum it all up, and:
- The Treasury approach can be characterised as loan-cost equivalence.
- The population-based approach can be characterised as fiscal-capacity equivalence.
| Treasury loan-cost benchmark | Population-based fiscal benchmark | ||||
|---|---|---|---|---|---|
| Provides controlled budget cover for the modelled cost of a comparable loan scheme | Uses a population share of recognised English expenditure as the benchmark | ||||
| Affected by borrower numbers and loan terms | Based primarily on population | ||||
| Lower loan balances reduce the modelled funding requirement | Lower borrowing does not reduce the benchmark | ||||
| Funding remains linked to student-loan costs | Funding could support loans, grants or direct teaching | ||||
| Lower outlay or modelled cost does not ordinarily increase the administration's freely usable budget | Savings could remain available to the devolved administration | ||||
| Benchmark based on the cost of a comparable loan scheme | Benchmark independent of the financing form chosen by the devolved administration | ||||
The methods generate different figures because they define the thing being equalised differently.
Treasury equivalence asks:
What budget cover is required for the cost of a comparable student-loan scheme?
Population-based equivalence asks:
What population share of England’s recorded student-loan expenditure should be used as the fiscal benchmark for each nation?
One-way flexibility
If the UK government changes the terms of English student loans so that borrowers are expected to repay more, the value of the English loan book rises and the expected public cost falls. That can (and has) improve(d) the UK government’s fiscal position.
The Chancellor can then use the additional fiscal room elsewhere. If the resulting spending is on an English service that is devolved – such as health or education – Wales, Scotland and Northern Ireland may receive Barnett consequentials. If it is spent on a reserved function, they generally don’t.
But the reverse doesn’t work in the same way. If a devolved government changes its own student-finance system so that the subsidy bill for its loan book becomes cheaper, the saving doesn’t become money that it can spend on something else. Lower loan outlay or lower impairment just reduces the amount of loan-related budget cover required from Treasury. It doesn’t create an equivalent increase in the devolved administration’s freely usable DEL.
It produces a one-way flexibility. Westminster can reduce the cost of English student loans and use the resulting improvement in its fiscal position to support other spending choices. A devolved government can reduce the cost of its student loans, but can’t recycle the resulting saving into universities, grants, health or another devolved priority.
The position is worse when costs rise. The Treasury’s rules can ultimately require a devolved administration to meet some above-target loan costs from DEL, including costs arising when forecasts or models turn out differently. So lower costs don’t automatically create usable savings, but higher costs can place pressure on the ordinary devolved budget.
This isn’t just a question of different accounting labels. It means that the fiscal framework gives the UK government more freedom to trade off the cost of student finance against other spending priorities than it gives the devolved governments.
The Northern Ireland position
Northern Ireland provides a clear example of the distinction. The Northern Ireland Open Book Review measures student-finance affordability through two limbs:
- loan outlay
- the modelled subsidy cost associated with expected repayments and write-offs
It doesn’t allocate Northern Ireland a population share of English student-loan expenditure. It sets a ceiling based on what English policy would cost if applied to Northern Irish borrowers.
The Review reports that Northern Ireland would issue approximately £1 billion less in loans between 2026–27 and 2029–30 than it would under English fee levels. That is presented as scope to raise tuition fees without breaching comparability.
The money directly available to the Executive is different. The Review identifies £237 million of Executive DEL currently paid to institutions to compensate for low tuition fees. A fee increase could release that funding, while the additional loan outlay and much of the associated modelled cost would score through UK-managed AME budget categories.
The Review explicitly excludes AME from its open-book assessment. It therefore quantifies Executive budget savings but not the full loan subsidy that would accompany higher fees.
Northern Ireland also constrains the number of locally funded undergraduate places through the Maximum Student Number cap. Departmental officials described MaSN in March 2026 as ‘essentially, a cost-control measure’.
Northern Ireland’s Department for the Economy told the Assembly Economy Committee in April 2025 that the RAB charge on newly issued loans was 13.8 per cent. On the Treasury budgeting basis, this represents an estimated government cost of 13.8 pence for each pound lent. It shouldn’t be interpreted as a forecast that exactly 86.2 per cent of the nominal loan principal will be repaid.
The 13.8 per cent figure is a RAB charge, not an ONS transfer proportion.
The ONS country and regional figures record £67 million of student-loan expenditure for Northern Ireland in 2024–25.
In 2024–25:
- £7.517 billion of student-loan expenditure was recorded for England
- £67 million was attributed to Northern Ireland
- the Northern Ireland English per-capita benchmark was approximately £250 million
- the gap was approximately £183 million
The expenditure attributed to Northern Ireland in that year was therefore equivalent to about 27 per cent of the English per-capita benchmark, subject to the same single-year caution that applies elsewhere in this analysis.
Across 2012–13 to 2024–25, £996 million was attributed to Northern Ireland. Its English per-capita benchmark was £2.786 billion.
The difference was £1.790 billion.
In 2024–25, the Department also had a ring-fenced notional student-loan subsidy budget. Against an estimate of £226.9 million, the accounts recorded a negative outturn of approximately £40 million, producing a reported variance of £266.4 million. That variance wasn’t £266.4 million of cash available for alternative Executive spending.
In that year, the unused cover couldn’t be redirected to universities, maintenance grants or other Executive priorities.
Scotland
Scotland’s undergraduate tuition system produces less student debt because tuition for eligible Scottish-domiciled students studying at Scottish institutions is funded directly by the Scottish Government.
That spending is met from the Scottish Government budget and appears as conventional programme expenditure. It doesn’t generate the same student-loan capital transfer as an equivalent amount issued through fee loans.
Scotland also constrains the volume of publicly funded undergraduate provision. For 2026–27, the Scottish Funding Council describes each university’s non-controlled consolidation number as a constraint on full-time undergraduate students eligible for funding, designed to ensure the affordability of SAAS budgets.
The ONS series shows Scottish student-loan expenditure of:
- £224 million in 2019–20
- £262 million in 2020–21
- £188 million in 2021–22
- £148 million in 2022–23
- £205 million in 2023–24
- £351 million in 2024–25
In 2024–25:
- £7.517 billion of student-loan expenditure was recorded for England
- £351 million was attributed to Scotland
- the Scottish English per-capita benchmark was approximately £715 million
- the gap was approximately £364 million
The expenditure attributed to Scotland in that year was therefore equivalent to about 49 per cent of the English per-capita benchmark. As elsewhere in this analysis, a single-year comparison should be treated cautiously because the ONS capital adjustment can include changes affecting the existing loan stock.
The cumulative total for 2012–13 to 2024–25 was £2.307 billion.
Applying England’s expenditure in proportion to population gives a counterfactual Scottish total of £7.986 billion.
The gap is £5.679 billion.
This doesn’t mean Scotland spent £5.679 billion less on higher education. It means that £5.679 billion less student-loan expenditure was recorded for Scotland than an English per-capita pattern would have produced.
Scotland’s welfare fiscal framework demonstrates that AME-funded programmes can be devolved through a different mechanism.
When welfare powers were devolved, Scotland received baseline block grant adjustments linked to UK spending on corresponding benefits. The adjustments are indexed through the Indexed Per Capita method.
Scotland bears the cost when its benefits are more generous than the corresponding UK benefits, but it also has policy autonomy over how the devolved provision is designed.
No equivalent settlement was developed for student finance.
Wales
Wales sits in between. It continues to operate substantial tuition-fee and maintenance lending under Plan 2 terms, but combines loans with income-related grant support, reducing the loan balance required to deliver a given total package of maintenance support.
In 2024–25:
- £7.517 billion of student-loan expenditure was recorded for England
- £140 million was attributed to Wales
- the Welsh English per-capita benchmark was approximately £409 million
- the gap was approximately £269 million
The expenditure attributed to Wales in that year was therefore equivalent to about 34 per cent of the English per-capita benchmark.
The 2024–25 figure should be treated cautiously as a one-year comparison because the ONS capital adjustment can include changes affecting the existing loan stock.
The longer period provides a more stable result.
Between 2012–13 and 2024–25:
- the English per-capita benchmark was £4.581 billion
- the student-loan expenditure recorded for Wales was £2.683 billion
- the difference was £1.898 billion
The expenditure attributed to Wales was equivalent to approximately 59 per cent of what an English per-capita pattern would have produced.
The outgoing Welsh Government told the Senedd Finance Committee that Wales was operating close to HM Treasury’s student-loan comparability ceiling. It expected that the Welsh RAB charge might exceed the amount Treasury would cover in 2025–26, potentially leaving £7.7 million to be funded from the Welsh resource budget.
A March 2026 written briefing from the Minister for Further and Higher Education to the Senedd Children, Young People and Education Committee sets out the mechanism in the most explicit official terms yet published.
The March 2026 briefing described Wales as operating in 2025–26 within two parallel Treasury controls – an AME control on total loan outlay, conditional on remaining broadly comparable to England, and a ring-fenced RAB control under which Wales ‘receives cover for RAB non-cash costs from HM Treasury, limited to a Barnett share of England’s forecast RAB charge’, with any excess falling on the Welsh resource budget.
The briefing states that modelling from the updated cross-UK repayments model indicates Wales’s RAB charge for 2025–26 “may rise to approximately £367m”, exceeding the available RAB budget; this is the first Welsh RAB value placed on the public record, and it’s equivalent to roughly a third of annual Welsh loan outlay.
The briefing attributes the increase principally to the new shared UK graduate repayments model (approved for the 2025–26 Welsh accounts and AME returns, with other devolved administrations seeing “a similar impact”), to Wales’s retention of Plan 2 terms against England’s Plan 5, and to outlay growth. It concludes that “even modest further growth in loan outlay or divergence from English repayment policy is likely to prove unsustainable under HM Treasury controls”.
That 2025–26 arrangement illustrates the underlying asymmetry. Wales could have to meet costs above the Treasury control if its own policies made the loan scheme more expensive, but under the general Treasury rules it can also ultimately face costs where forecasts turn out to be wrong or model changes increase the estimated impairment of its loan book.
From 2026–27, impairment up to the Treasury target sits in resource AME rather than the old ring-fenced resource DEL, but above-target impairment arising from forecast errors or model updates is still moved into resource DEL over up to 30 years. The published 2026–27 guidance changes where these costs are recorded; it doesn’t say that the separate comparability limits described by Wales for 2025–26 have been abolished. Lower loan balances or lower impairment, meanwhile, don’t generate an equivalent flexible fiscal benefit for other higher education spending.
Two further cautions apply to the Welsh comparison. First, the gap against the English per-capita benchmark isn’t funding available to the Welsh higher education sector. Under the student-loan machinery, higher recorded expenditure would require more lending or higher loan-related costs, creating additional repayment liabilities for Welsh students.
Second, Welsh student-finance liabilities can support students studying at institutions elsewhere in the UK. In 2024–25, 29.7 per cent of Welsh-domiciled entrants studied at providers in another UK nation, compared with 20.4 per cent of Northern Irish, 6.6 per cent of Scottish and 4.5 per cent of English entrants (HESA entrant data).
Expenditure recorded for Wales therefore isn’t equivalent to support received by Welsh institutions. The provider-side estimate in section 5 shows the two approaches pointing in opposite directions – the Welsh Government’s loan book carries the liability for students who leave, while Welsh institutions are estimated to receive a net £170 million a year of cross-border fee income on the illustrative assumptions used in section 5.
How the architecture developed through the 2012 reforms
The present structure predates the 2012 reforms, but England’s funding changes greatly increased its significance.
In the early devolved period, the modelled subsidy and bad-debt cost of student lending was already inside the spending-control system, while the loan advances themselves weren’t treated as ordinary programme expenditure. By 2006–07, net student lending had been brought into capital AME across the UK, formalising Treasury’s financing of the loan cash within the budget framework.
By the 2011 Scottish Spending Review, the split can be seen in a single budget table. Scotland’s ‘Cost of Providing Student Loans (RAB Charge)’ was recorded in DEL, while ‘Net Student Loans advanced’ sat in AME. For 2011–12 the figures were £71.4 million and £208 million respectively, rising in later plans to £181.6 million and £468.3 million. This is why it would be too simple to describe the later English funding switch as moving the write-off itself from DEL into AME: loan principal and the modelled subsidy cost were already handled through different budget categories.
In January 2014, Treasury introduced a 30-year treatment for relevant higher education loan impairments above its target. Where the estimated impairment rose because earlier forecasts turned out to be wrong or the student-loan model changed, the excess did not have to hit DEL all at once. It could sit in AME and be charged back to DEL over 30 years. The mechanism spread an unexpected loan-cost shock rather than removing it.
England reduced direct teaching grant and permitted much higher regulated tuition fees. The replacement funding largely took the form of government-backed fee loans.
This altered the channel through which public support was delivered.
Direct teaching grant is conventional departmental expenditure. Changes to comparable English departmental spending can generate Barnett consequentials for the devolved administrations.
After 2012, the large cash advances supporting English fee finance sat in the demand-led student-loan and AME machinery, while the modelled subsidy and later impairment costs were handled separately under the budget rules applying at the time. The gross lending facility wasn’t a flexible population-based allocation.
England’s shift reduced the role of direct teaching grant and greatly increased the volume of finance routed through a Treasury-backed loan channel. Because ordinary departmental grant and student-loan finance enter devolved funding through different mechanisms, the shift changed the relationship between the amount of support reaching English universities and the flexible fiscal capacity generated for the devolved administrations.
A nation using direct grant, lower fees or fewer loans consequently draws less through the loan-finance machinery, even where it’s funding the same broad educational activity through another mechanism.
The removal of English student number controls from 2015 extended the divergence to volume. For fee finance, an additional English student can draw on the demand-led student-loan system, whereas an additional funded student in a grant-funded system places pressure on a capped devolved budget.
Scotland constrains funded undergraduate numbers through Scottish Funding Council funded-place and consolidation-number arrangements, while Northern Ireland operates the Maximum Student Number cap. Wales doesn’t operate an equivalent general higher education number cap. Where the Treasury comparator is based on actual borrower volumes – as the Northern Ireland evidence indicates – a number control can therefore reduce both participation and the borrower base subsequently used in assessing the amount of loan cover required.
England removed its general student number control and increasingly financed undergraduate fees through demand-led loans. Scotland and Northern Ireland retained constraints on funded places, while all three devolved systems generated less lending per resident through some combination of lower participation, lower fees and greater use of grants. Because loan-related fiscal cover follows borrowers and loan costs, those differences reduce the expenditure generated through the student-loan machinery. They don’t produce an equivalent sum that can instead be spent on grants, teaching or additional places.
What the £9.367 billion difference does and doesn’t mean
The £9.367 billion figure isn’t:
- a legal debt owed by the UK government
- a conventional Barnett consequential that can be shown to have been withheld
- a precise estimate of the cost of devolved higher education
- evidence that devolved students received £9.367 billion less support
- a measure of total university funding
- an estimate obtained by redistributing a fixed UK expenditure total
- money that could, under the current arrangements, reach institutions or students without corresponding loan liabilities being created
It is:
- a counterfactual comparison
- based on published ONS-recorded student-loan expenditure
- calculated by applying England’s expenditure to devolved population shares
- a measure of the difference between an English per-capita benchmark and ONS-recorded student-loan expenditure
- evidence that the financing form materially affects the amount of student-loan expenditure recorded and the fiscal mechanism through which support is provided
The counterfactual assumes that England’s expenditure per resident is the relevant benchmark.
That isn’t the only possible benchmark. Alternatives could include:
- student-age population
- numbers of higher education participants
- numbers of domiciled borrowers
- full-time equivalent students
- needs-adjusted population
- English expenditure applied through existing Barnett comparability factors
Each would produce a different result.
Population is nevertheless a useful counterfactual because it provides a transparent territorial benchmark that is independent of each nation’s loan design, participation rate and financing mix.
It therefore exposes the difference between a population-based fiscal benchmark and one driven by borrowers and loan-system costs.
These qualifications concern how the gap should be interpreted, not whether the recorded expenditure exists. Since the partitioned treatment was introduced, expected non-repayment on student lending has been recognised as public expenditure, while the annual country-level series also incorporates subsequent accounting adjustments.
Most of the expenditure recorded in that series has been attributed to England. Its territorial pattern reflects loan-system design, borrower volumes and characteristics, as well as policy and valuation adjustments, rather than a direct allocation according to population or assessed need.
Limitations of the ONS series
The country and regional public sector finances figures are the best published country-level series identified for this purpose, but they have limitations.
First, the annual figure may include more than the transfer attached to loans issued in that year. Policy changes and subsequent adjustments may alter the amount recorded.
Second, the ONS series doesn’t publish a corresponding transfer proportion or a precisely matching outlay denominator for each devolved nation.
Third, dividing the ONS-recorded expenditure figure by SLC undergraduate outlay won’t necessarily produce a valid transfer proportion. The coverage of loan products, timing and adjustments may differ.
Fourth, adding the annual figures together incorporates both positive and negative adjustments, but it isn’t equivalent to summing the initial transfer recognised for each lending cohort.
Fifth, population-based comparison doesn’t account for differences in participation, demographics, cross-border study or borrower composition.
The ideal dataset would show, for each nation and financial year:
| Measure | Description |
|---|---|
| New loan outlay | Cash advanced during the year |
| Transfer proportion | Share treated as expenditure at inception |
| Initial transfer value | Outlay multiplied by transfer proportion |
| Policy and stock adjustments | Later changes recorded in the year |
| ONS annual student-loan expenditure | Net national-accounts effect after initial transfers and subsequent adjustments |
Publication of these components would allow the country figures to be separated into new-lending transfers and subsequent adjustments.
Policy options
Several reforms could address the asymmetry.
A transferable loan-subsidy allocation
The devolved administrations could receive an allocation based on their population or needs-adjusted share of English ONS-recorded student-loan expenditure.
They could then use that allocation for loans, grants or direct institutional funding.
This would make the financing instrument more neutral. The annual Table S8 outturn would however be a poor allocation rule, because the measure is volatile and can be negative: an English policy change affecting existing loans could abruptly raise or reduce devolved funding. A usable allocation would need to be based on forecast transfers on new lending, a multi-year rolling average, or a fixed baseline indexed against English outlay or transfer expenditure.
A student finance block grant adjustment
A model similar in principle to Scotland’s welfare block grant adjustment could establish a baseline for student finance and index it against relevant English expenditure.
The devolved administration would then bear the fiscal consequences of policies that were more expensive than the indexed settlement, but retain savings where its chosen model cost less.
A formula mechanism linked to English student-loan expenditure
A new formula mechanism could generate devolved consequentials from a defined measure of English student-loan expenditure, using population and an agreed comparability factor.
This would be an extension of the current funding architecture rather than ordinary treatment of loan expenditure within the existing Barnett formula. Because the amounts are volatile and include policy and stock adjustments, a multi-year average or forecast measure might be required.
Publication and transparency
ONS or DfE could publish annually for all four nations:
- loan outlay
- transfer proportion
- transfer value
- RAB charge
- subsequent policy adjustments
- ONS-recorded student-loan expenditure, including subsequent adjustments
This would allow the existing Treasury comparability test to be scrutinised without first reconstructing figures from multiple accounting systems.
Not neutral
The UK fiscal system doesn’t treat different methods of financing higher education neutrally.
Where England supports higher education through income-contingent loans, expected non-repayment is recognised as public expenditure. Loan outlay and much of the associated modelled cost are handled through AME budget arrangements, subject to Treasury controls.
Where support is delivered through direct teaching funding, grants or lower fees, less student-loan expenditure is recorded. Lower loan outlay or modelled cost doesn’t normally produce a corresponding increase in funding available for another form of higher education support.
Between 2012–13 and 2024–25, ONS recorded £82.887 billion of student-loan expenditure for England.
Had that expenditure been applied to Wales, Scotland and Northern Ireland in proportion to their populations, the devolved nations’ combined equivalent would have been £15.353 billion.
The expenditure attributed to them was £5.986 billion.
The £9.367 billion difference doesn’t represent a formal entitlement under existing Treasury rules. It shows the scale of the difference between the expenditure actually recorded and a counterfactual in which England’s expenditure per resident is used as the territorial benchmark.
Treasury’s arrangements provide budget cover for the controlled costs of devolved student-loan systems, while leaving devolved administrations exposed to some costs above Treasury’s targets. They don’t provide an equivalent, freely usable fiscal allocation where support is delivered through grants, lower fees or direct institutional funding.
The result isn’t that Treasury literally pays for debt but refuses to pay for education. It’s that the amount of fiscal cover available through the student-loan machinery is linked to student-loan outlay and the modelled costs associated with that lending.
The evidence doesn’t by itself establish the net effect on each nation’s overall higher education funding settlement. It does demonstrate that its treatment is non-neutral.
Sources
Office for National Statistics, Student loans in the public sector finances: a methodological guide
Office for National Statistics, Country and regional public sector finances supplementary tables
Office for National Statistics, Country and regional public sector finances methodology guide
Office for National Statistics, Country and regional public sector finances QMI
Office for National Statistics, Development of public sector finance statistics, April 2023
Department for Education, Student loan forecasts, England: 2025 to 2026
Department for Education, Student loan forecasts methodology
HM Treasury, Statement of Funding Policy, June 2025
HM Treasury, Consolidated Budgeting Guidance 2025–26
HM Treasury, Consolidated Budgeting Guidance 2026–27
Northern Ireland Executive, Open Book Review of Northern Ireland Executive finances
Northern Ireland Department for the Economy, annual reports and accounts
Belfast News Letter, Around 86% of student loans in Northern Ireland are repaid, committee hears
Scottish Government, Government Expenditure and Revenue Scotland 2024–25
Scottish Government, Fiscal framework agreement
UK and Scottish governments, updated Fiscal Framework Agreement, August 2023
Senedd Research, Student loans: time for a new plan?
Office for Budget Responsibility, Student loans and fiscal illusions
HESA, HE student enrolments by permanent address (table 11) and student statistics location data (SB273)
Student Loans Company, financial-year student-loan statistics for England, Wales, Scotland and Northern Ireland (Table 1 outlay series, FY2025–26 and earlier editions; the Scotland series covers SLC-administered loans and is distinct from the SAAS authorised-support tables listed below)
HM Treasury, Freedom of Information internal review IR2026/03145 (FOI2025/25512), 22 July 2026 (correspondence on file)
Welsh Government, letter and briefing from the Minister for Further and Higher Education to the Children, Young People and Education Committee: Student Loans Budget Control – AME and RAB Pressures, 5 March 2026 (on file)
SAAS, Higher Education Student Support in Scotland, publication tables, 2022–23 to 2024–25 editions
Scottish Funding Council, University Final Funding Allocations AY 2026–27
Analysis tables:
Table 1: ONS student-loan expenditure and the English per-capita benchmark
Table 2: SLC loan outlay, expenditure-to-outlay ratios and the volume-rate decomposition
Table 3: the student-population counterfactual
Table 4: cross-border study flows and provider-side incidence
Table 5: SAAS-authorised student support, Scotland