

Are students at work (both home and international) driving NEET numbers up?
Jim is an Associate Editor (SUs) at Wonkhe
Tags
There’s a number near the heart of his interim report on young people and work that sounds alarming. Here’s the para:
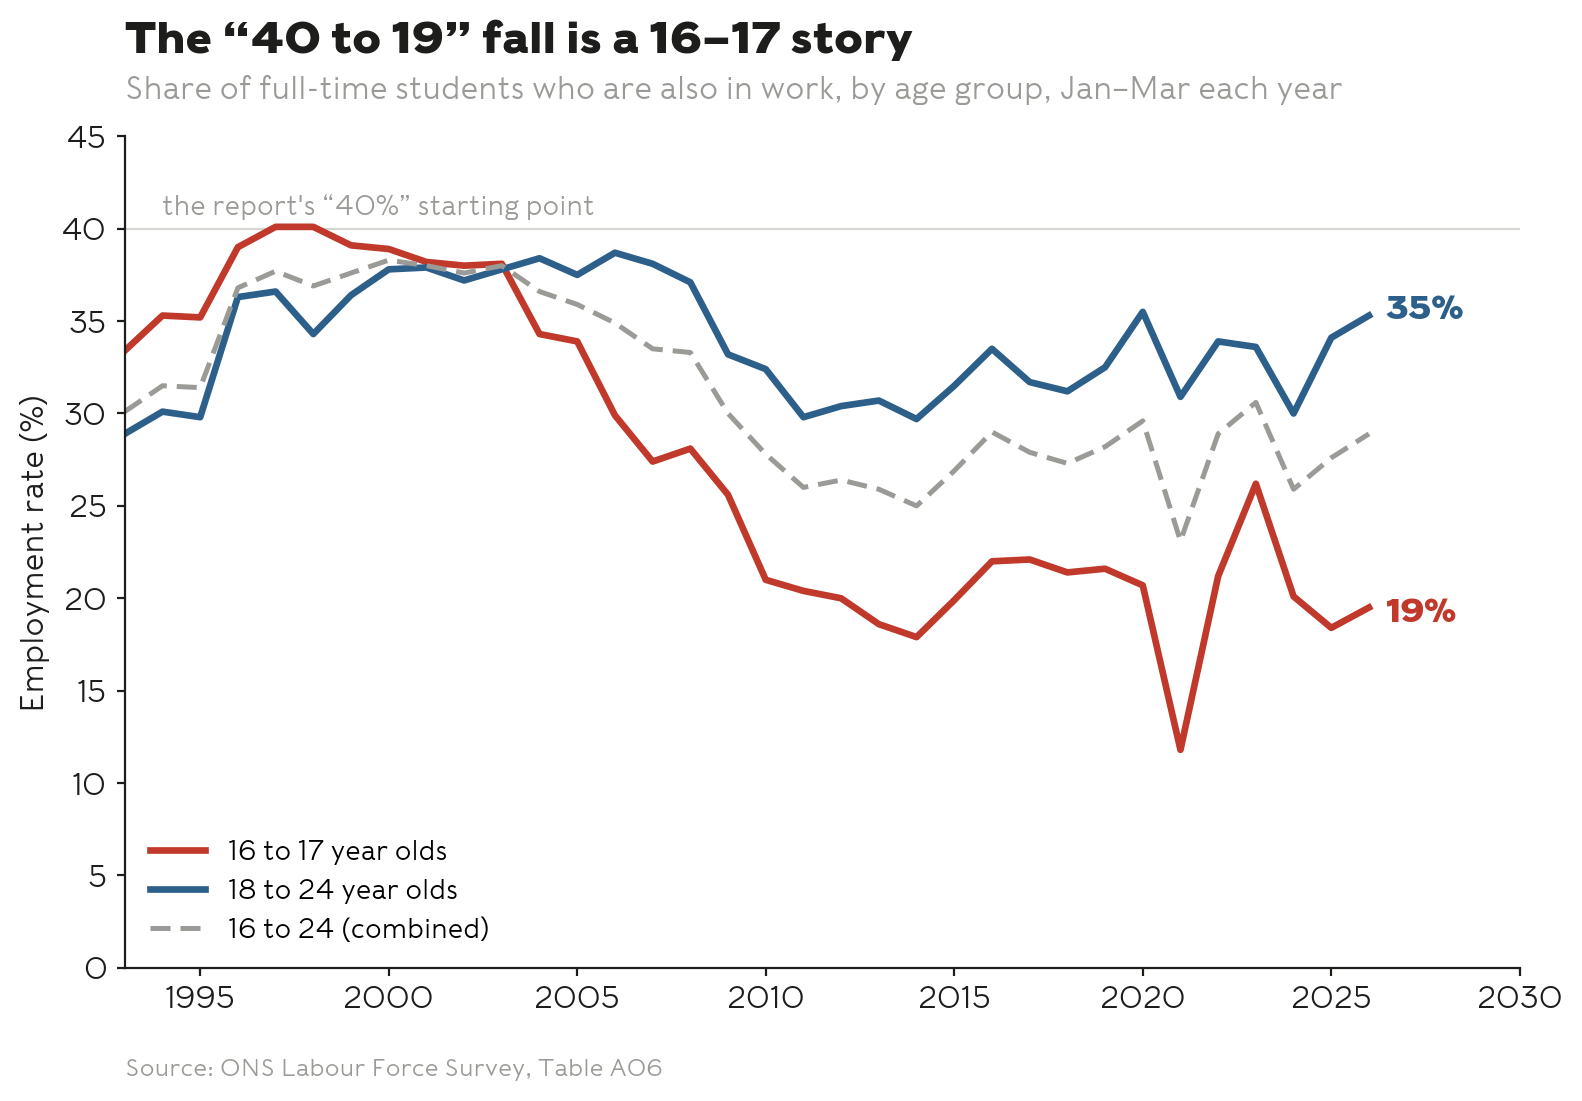
The shift is clearest among the youngest. Employment among in those aged 18 and under has fallen from 47 per cent a generation ago to around 20 per cent today. At the same time, the proportion of those in full-time education who are also in work has halved, from 40 per cent at the turn of the century to 19 per cent now. Young people are not just less likely to be working, but are also less likely to have any foothold in the labour market while they study.
That is footnoted to internal analysis of the Labour Force Survey. Table A06 confirms that the employment rate for those aged 17 and 18 was around 38 to 40 per cent in the late 1990s, and is 19.5 per cent in the most recent quarter.
The story for 18 to 24 year olds is different. Their employment rate barely moved – 37.8 per cent in early 2000, 35.3 per cent in early 2026. The share of them either working or looking for work was 43 per cent then and 41.8 per cent now. That’s been flat for a quarter of a century.
Saturday, never
For 16 and 17 year olds, the decline is sharp. The number of them in full-time education and also in work fell from around 419,000 in 2000 to around 274,000 now – roughly a third gone. That is the “death of the Saturday job”.
Part of it is simply that far more teenagers are now in education at all – up from about 75 per cent of the age group to 86 per cent. The extra ones swept into the “student” bucket were always less likely to have a job on the side.
The rate at which students work has held steady. What has exploded is the number of students, and the arrival of two big groups that barely existed in 2000.
The easiest way to picture the whole problem is a game of musical chairs. The entry-level labour market – shop floors, bars, kitchens, care homes, warehouses, delivery rounds – is a ring of chairs. Every year more players walk around it. When the music stops, the ones left standing are the ones who were already slowest to a seat. That is roughly what has happened to young people who aren’t in education.
Take a number
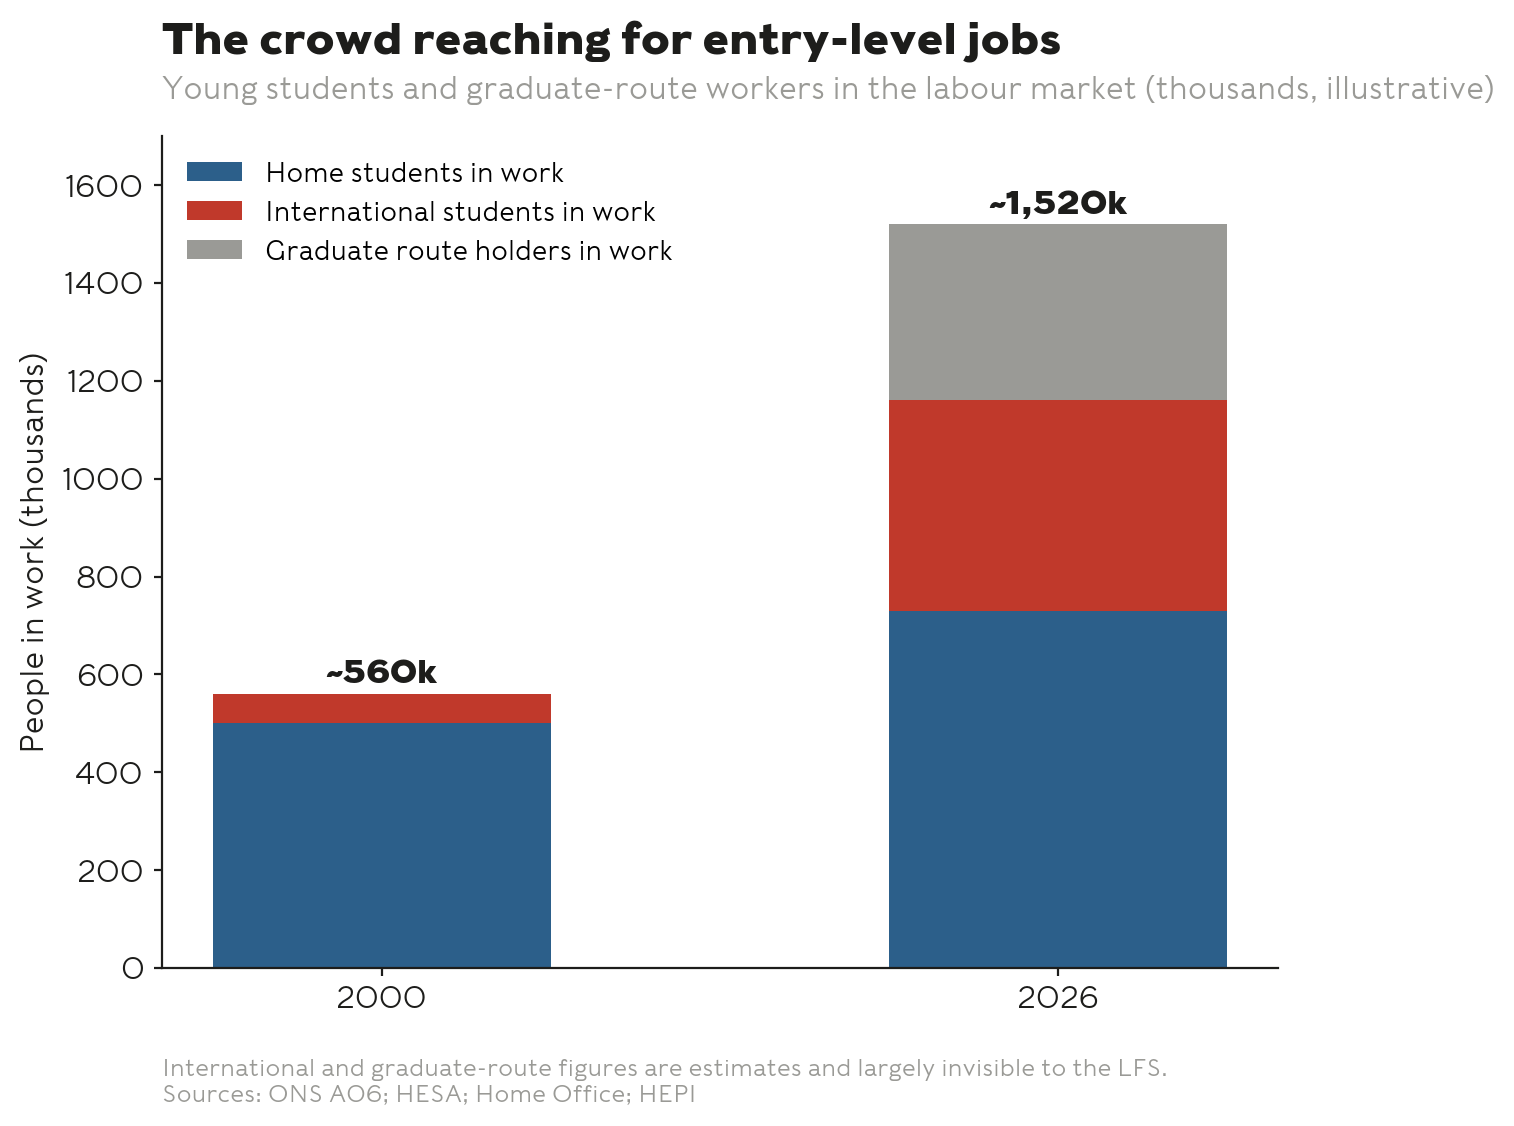
The 18 to 24 population grew from around 4.83 million in 2000 to around 5.88 million now, up about a million. The slice of them in full-time education rose from 27 per cent to 35 per cent. The number of 18 to 24 full-time students climbed from around 1.32 million to around 2.07 million. Even with the working rate flat, that is a lot more students reaching for the same chairs.
Then there is a second crowd that has roughly trebled. The 2011 Census counted around 425,000 international students aged 18 and over in England and Wales. By 2023/24, HESA enrolment data put the international student population across the UK at well over 700,000. At the turn of the century the equivalent number was probably only around 200,000 for the whole UK.
As a share of university-age students, the international group has grown from perhaps one in eight to perhaps one in five – and these students work at higher rates than home students, not lower – especially PGTs.
A third crowd didn’t exist at all until July 2021 (unless you count a proportion of a far smaller number pre-Theresa May’s tint as Home Secretary). The graduate visa route lets international graduates stay and work for two years after their degree (three for PhDs), and the numbers joining it jumped from around 129,000 in the year to September 2023 to around 237,000 in the year to September 2025. Because people stay for two years, the number in the country at any moment is now somewhere around 350,000 to 450,000.
The government’s own figures show about 90 per cent of these graduates are earning within six months, and that fewer than a third are in graduate-level jobs. The majority are in ordinary entry-level work – the same shop, bar and warehouse jobs everyone else is after. It is precisely because so many weren’t moving into graduate careers that the route is being cut to eighteen months from January 2027.
Crowd control
Put the crowds together and the demand for entry-level work from international students and graduate route holders has grown from perhaps 50,000 to 80,000 people in 2000 to somewhere around 650,000 to 670,000 today. On top of that sit roughly 231,000 more home full-time students in work than in 2000 – and those are just the ones the survey manages to count.
If a much bigger crowd is now circling the same chairs, you would expect the people who were already most vulnerable to lose out. They have.
Among 18 to 24 year olds who are not in education, the share in work fell from 76.6 per cent in 2000 to 70.8 per cent now. The share working or looking for work fell from 86.1 per cent to 82.0 per cent – but this didn’t drift down gently. It held steady, between 85 and 87 per cent, all the way from 2000 to 2022. Then it dropped off a cliff – 84.8, then 82.3, 82.7 and 82.0 per cent across the four most recent years – levels not seen outside the financial crash.
The number of non-student young people who have given up looking for work entirely rose from around 486,000 to around 685,000, with most of that since 2022.
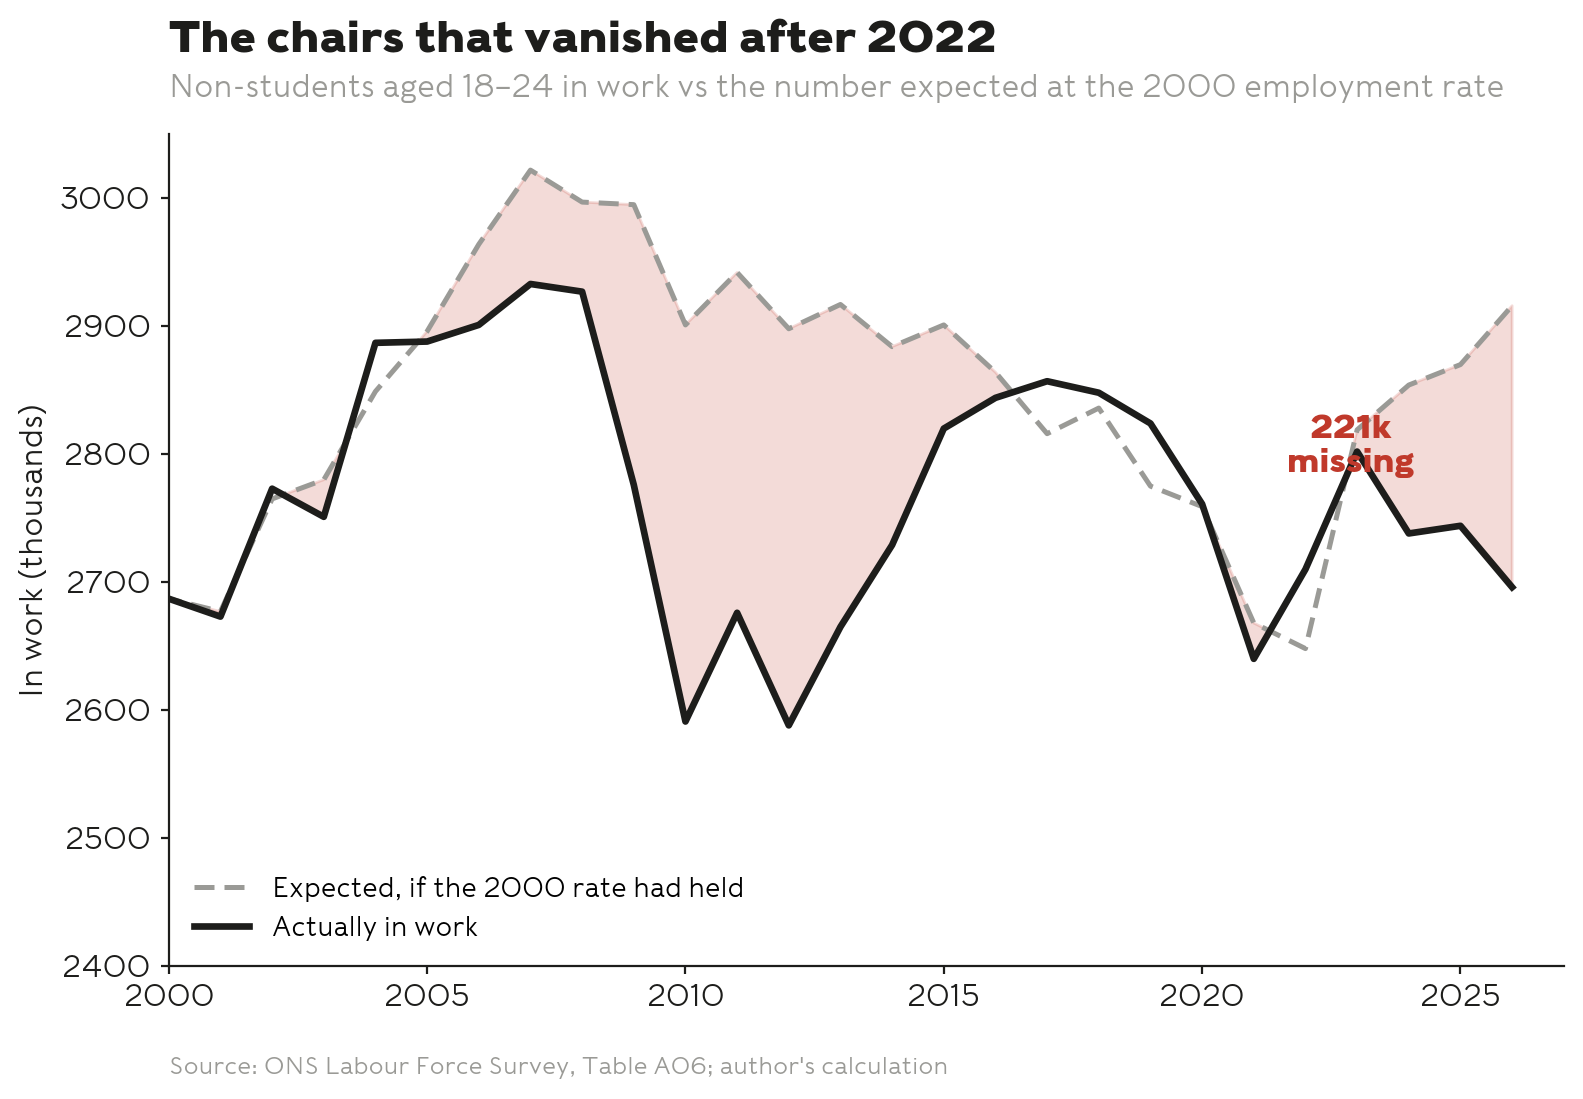
If non-student young people were still finding work at the 2000 rate, around 2.92 million of them would be employed today. The real figure is around 2.70 million. That gap – roughly 221,000 people – is the number who would be working if the chairs hadn’t been filled by someone else.
And the timing is the giveaway. That gap was essentially zero, sometimes even negative, right up to 2022, albeit with a big financial crash dip. Then it sprang open – around 115,000 in 2024, 126,000 in 2025, 221,000 in 2026 – while the raw number of non-students in work has hardly budged since 2000, up just 9,000, even though there are around 300,000 more of them.
To be clear, this doesn’t prove the students caused it. Demand has weakened, sectors have shrunk, and some of this is the ordinary economic weather. But the sums line up with the story – a much bigger crowd, the same number of chairs, and the people who were already last in the queue getting squeezed out exactly when the crowd was at its largest.
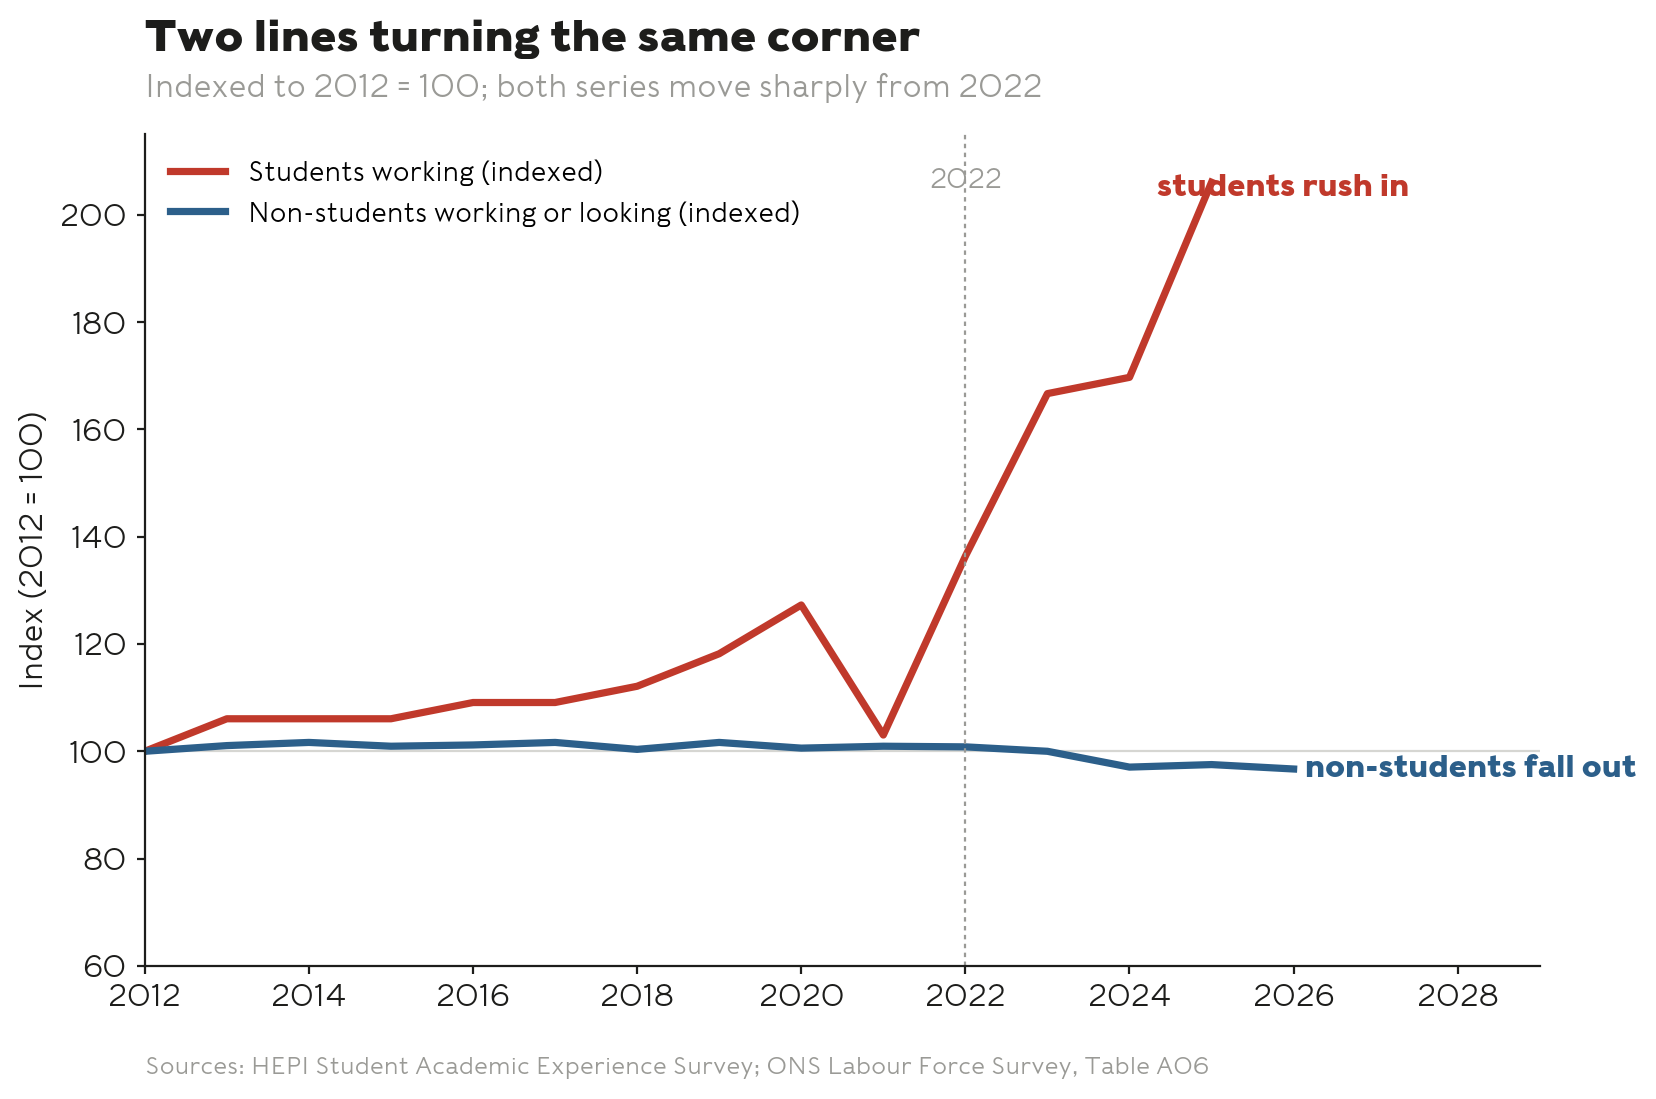
And “exactly when” is doing the work there. Four separate measures all bend at the same moment, in 2022. HEPI tells us that the real share of students working surged from 45 to 68 per cent in three years. The graduate route scaled from under 100,000 people to around 250,000. The non-student participation rate, steady for two decades unless you count the impact of the financial crash, fell off its cliff.
And the missing-chairs gap, zero for twenty years, sprang open to more than 200,000. Any one of these on its own could be coincidence. Four lines turning the same corner in the same year is the kind of pattern that is hard to wave away – even if it still falls short of proof.
Net loss
All of which runs into one stubborn problem. The survey the report leans on is bad at counting working students, and three surveys built for the job say as much.
Ages ago I suggested we think of the Labour Force Survey as a giant net dragged across the whole working population. It is bad enough at counting the population as a whole. But it has huge holes in it shaped exactly like a student.
It works by knocking on the doors of ordinary homes pulled from the postal address list. Students often don’t live in ordinary homes – they live in halls, which aren’t on that list. The survey tries to catch them through their parents’ address instead. So if you are an international student whose parents live abroad, you slip straight through – no UK parental home, and your hall isn’t on the list either. You are invisible.
And it weights its sample up to match population totals taken from the Census, not from university enrolment records. So even when the headcount is roughly right, the details – like whether students work – come from a sample that is mostly home students living with their families. The base it calibrates to is wobbly too – the 2021 Census found 373,600 international students when university records showed well over half a million.
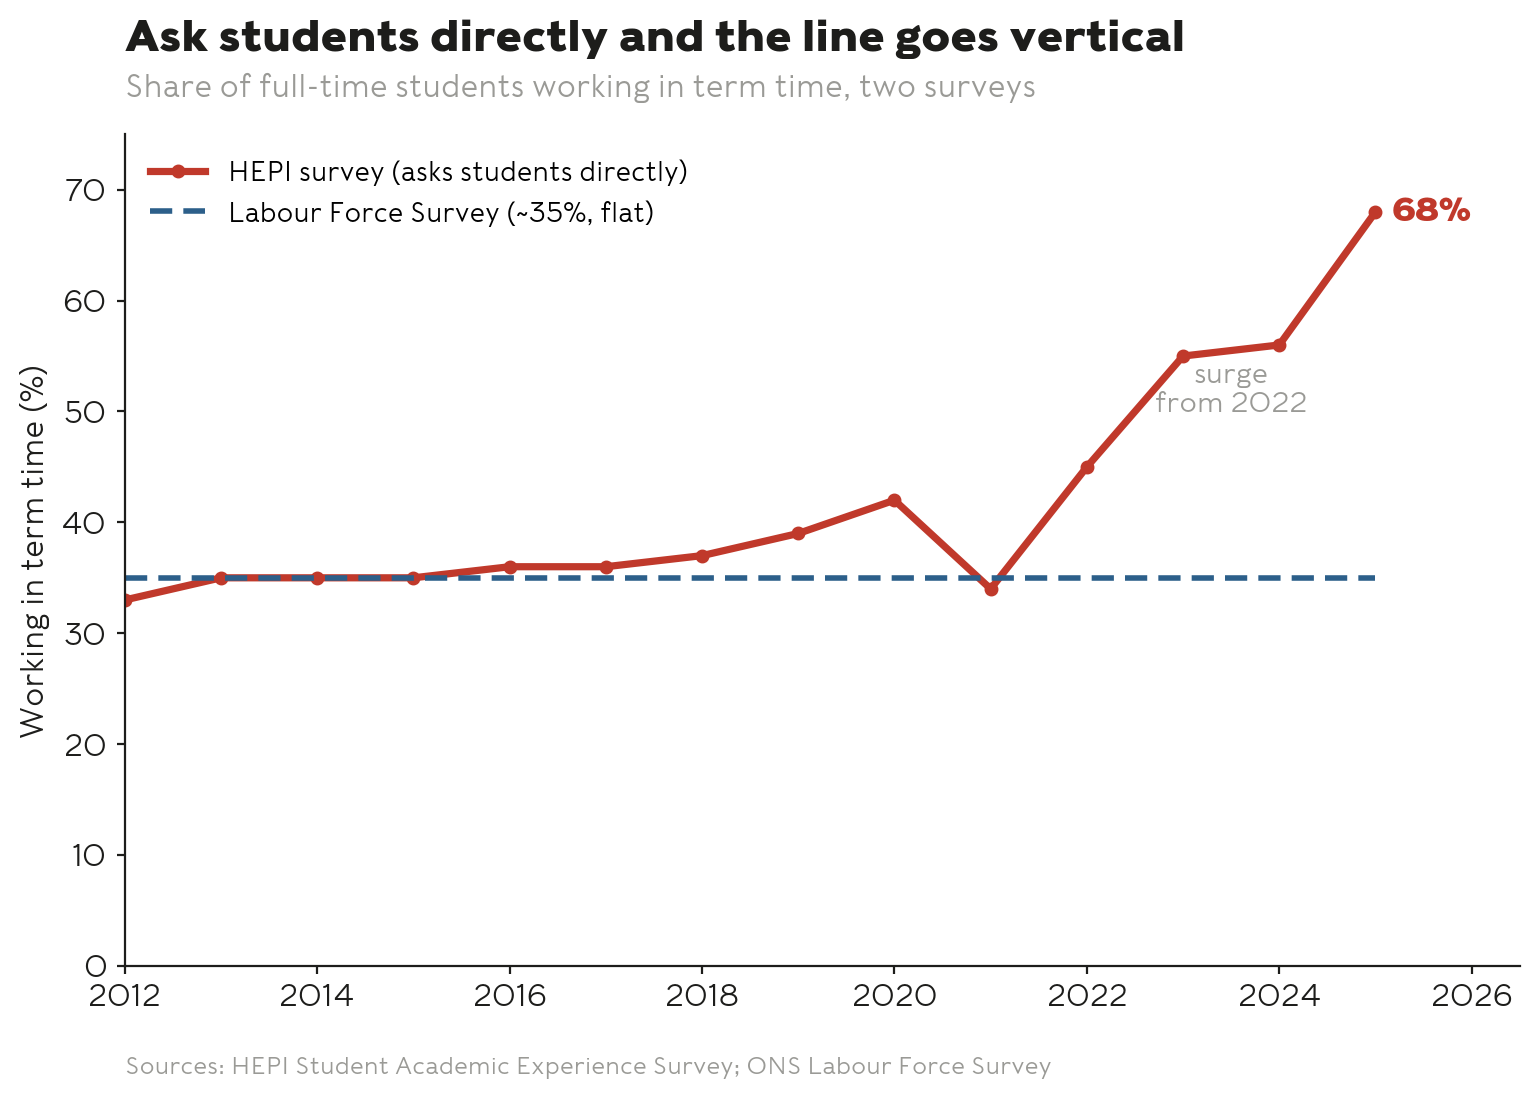
When you ask students directly, the answer is completely different. The Labour Force Survey puts the share of university-age students working at around 35 per cent. The Department for Education’s own Student Income and Expenditure Survey found 58 per cent working in 2021/22, up from 52 per cent in 2014/15. And HEPI’s Student Academic Experience Survey, which has tracked this every year, finds the share working in term time has reached about two-thirds.
That HEPI series is worth reading slowly. For most of the 2010s it sat flat in the mid-thirties – 33 per cent in 2012, then 35, 35, 35, 36, 36, 37 per cent up to 2018. It wobbled around the pandemic, dipping to 34 per cent in 2021 when campuses and hospitality shut and there was simply no work to do. And then, from 2022, it went near-vertical – 45 per cent, then 55, 56 and 68 per cent by 2025.
Across 2012 to 2018 the rate crept up by less than a point a year. Across 2022 to 2025 it rose by roughly eight points a year – more than ten times faster. Two-thirds of the entire increase since 2012 has happened in just the last three years. Student working didn’t drift upward – it surged, and it surged late.
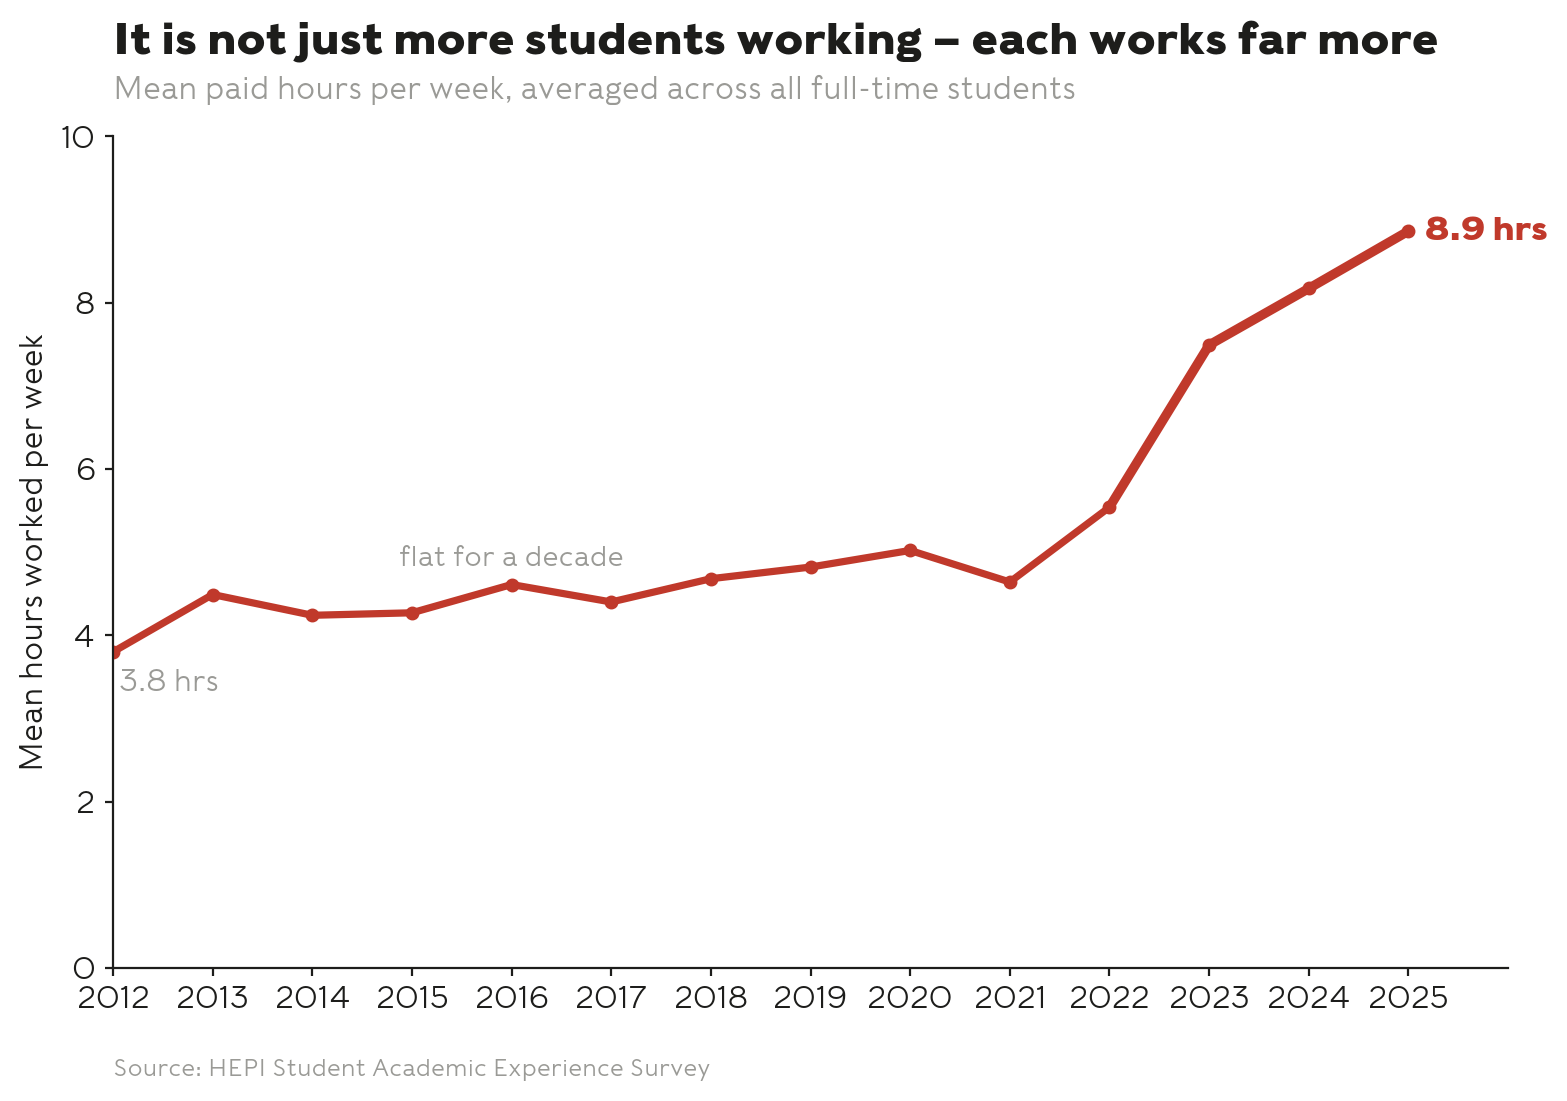
And counting heads understates it, because the hours have grown too. The same HEPI survey shows the average paid hours worked per student per week – averaged across everyone, workers and non-workers alike – rising from 3.8 in 2012 to 8.9 in 2025. That mean already includes the rise in how many work, so it captures both dimensions at once, and it has more than doubled.
Almost all of this is intensity rather than numbers – the same body of students now supplies well over twice the paid labour it did a decade ago. A rising share of students working a few hours is one thing – the average student working nearly nine hours a week is a far heavier weight on the same entry-level market.
So two purpose-built surveys say student working is high and climbing steeply. The general-purpose net says it’s low and flat. The net is the odd one out.
None of this is a student lifestyle story. HEPI’s research on what students need to live found that even those on the most generous maintenance support have to work more than twenty hours a week at minimum wage just to cover the basics. Fees frozen, maintenance left to erode, costs rising – students are pushed into work by the design of the system. That maintenance settlement is a lever sitting in the government’s own hand, and the report doesn’t touch it.
Educated guess
The report also flags a rise in graduates who end up not in work, education or training. The right response is a shrug, not a confident finger-point.
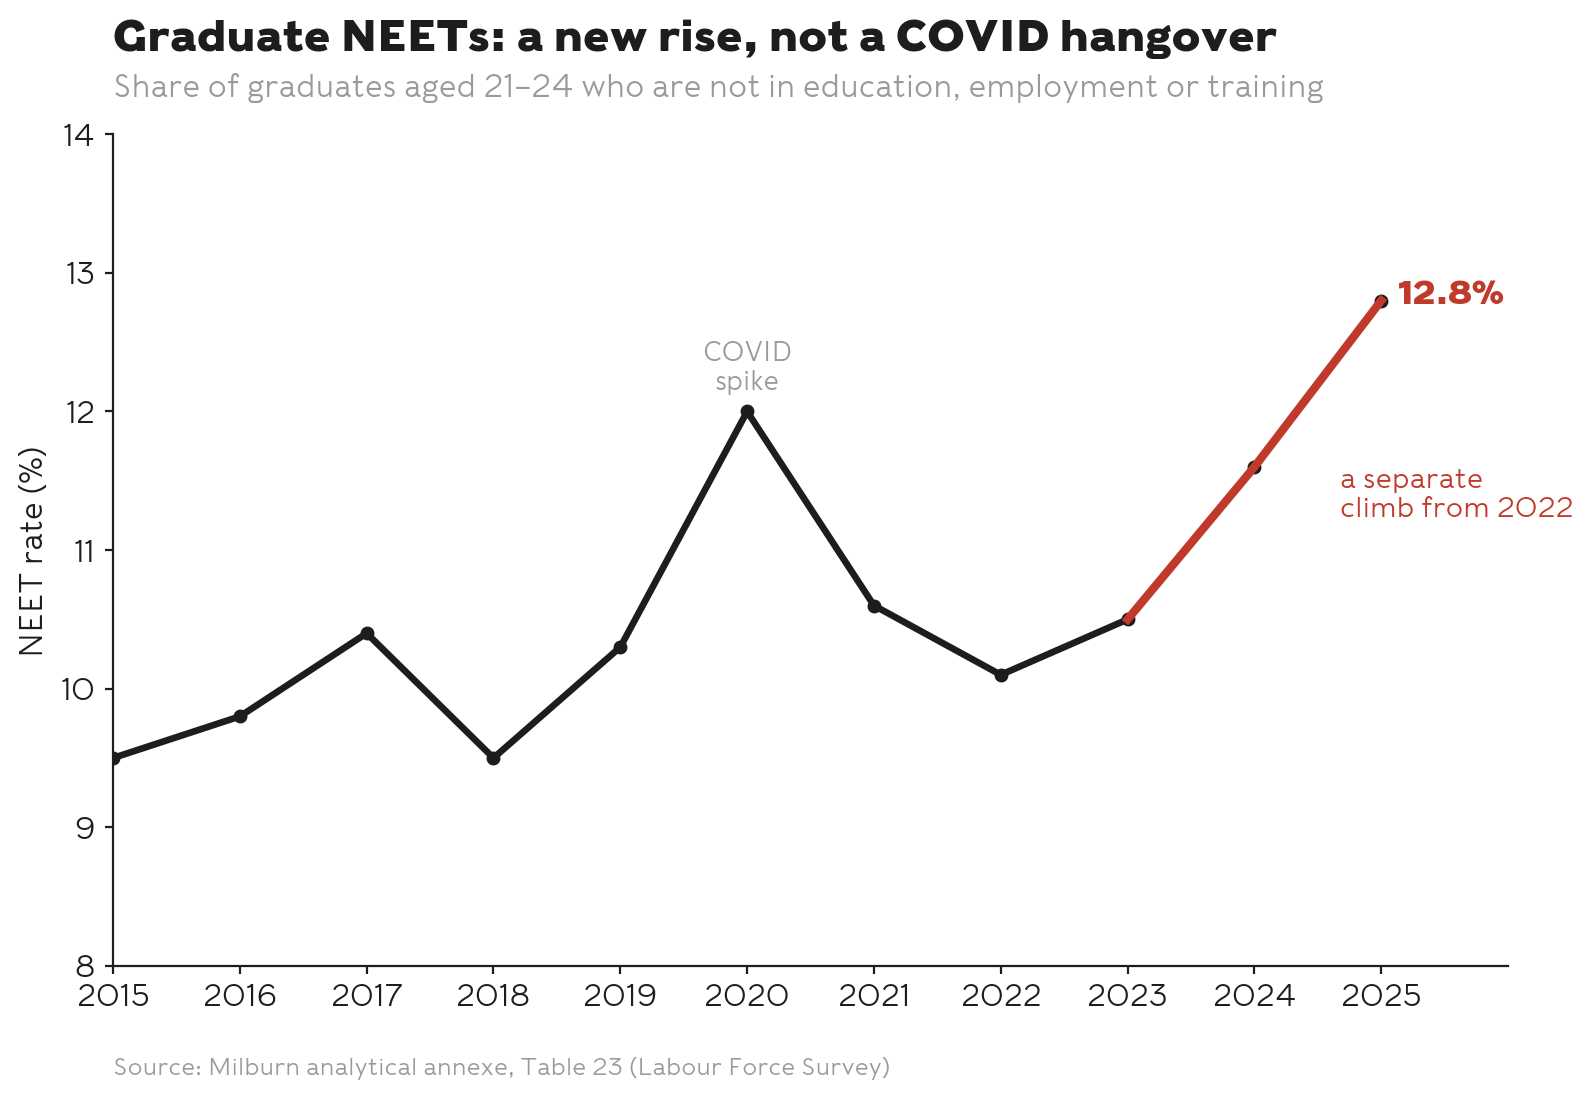
The figure, from Table 23 of the annexe, shows the share of 21 to 24 year old graduates classed as NEET rising from around 9.5 per cent in 2015 to 12.8 per cent in 2025 – the highest on record.
The shape is worth reading carefully – flat to 2018, a clear Covid-19 spike in 2020, back down to around 10 per cent by 2022, and then three straight years climbing again. The recent rise is a new thing, not a leftover from the pandemic.
But this gives only percentages, no headcounts. So it carries the same blind spot, and the group it struggles most to count – the international one – is growing inside the very number being measured.
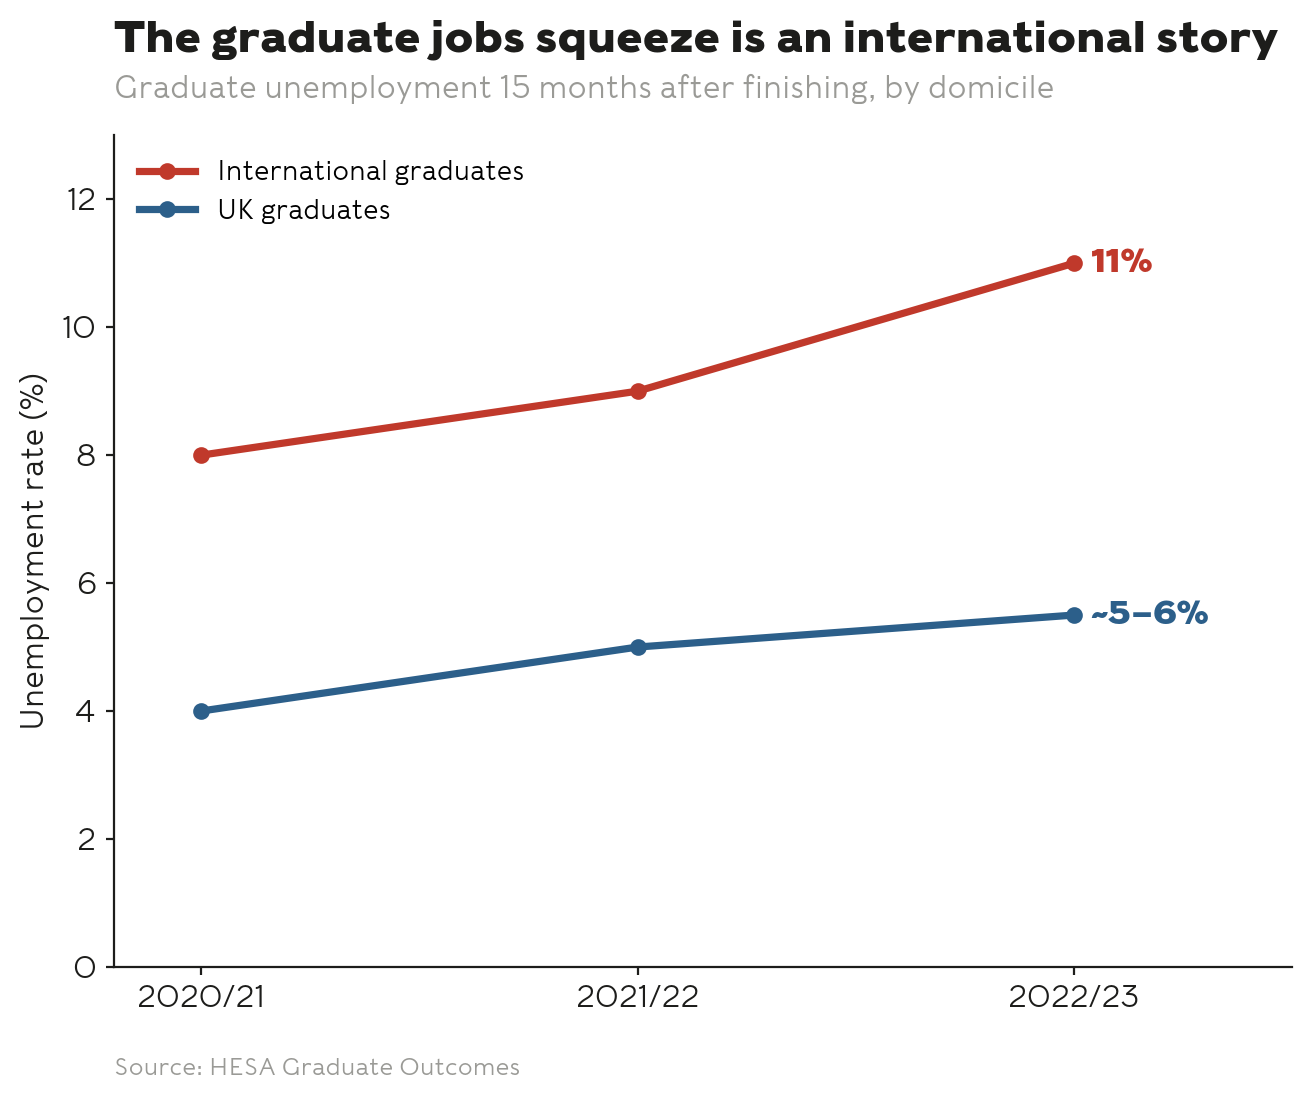
There is a survey built for this – HESA’s Graduate Outcomes, which tracks graduates, home and international, fifteen months after they finish. Its latest reading shows overall graduate unemployment up by a single point, to 6 per cent. But dig in and the rise is driven almost entirely by international graduates, whose unemployment went from 9 to 11 per cent. Home graduates stayed broadly steady at around 5 to 6 per cent, with employment still above its pre-pandemic level.
That hints that the graduate jobs problem may be concentrated among international graduates struggling after their course, rather than a general crisis among home graduates – a very different diagnosis from the one the headline figure invites.
Why are graduate NEET numbers rising? There is a line-up of suspects and no confession – weaker graduate hiring (the report itself notes an eight per cent annual drop), graduates bumping down into lower-level jobs and pushing others out, more young people with health conditions, the graduate route, and the simple possibility that the survey is getting worse at measuring graduates as the population it can’t see grows. The data we have can’t pick the culprit, and anyone who tells you it’s obvious is guessing.
Partial credit
What else has kicked in hard fairly recently? The decline in the value of the maintenance loan (and therefore the amount of money we tell international students to bring to live on, which is linked to the max loan in England).
One of the things we can do is look at the extent to which the system supports students to “not” work and spend time studying instead.
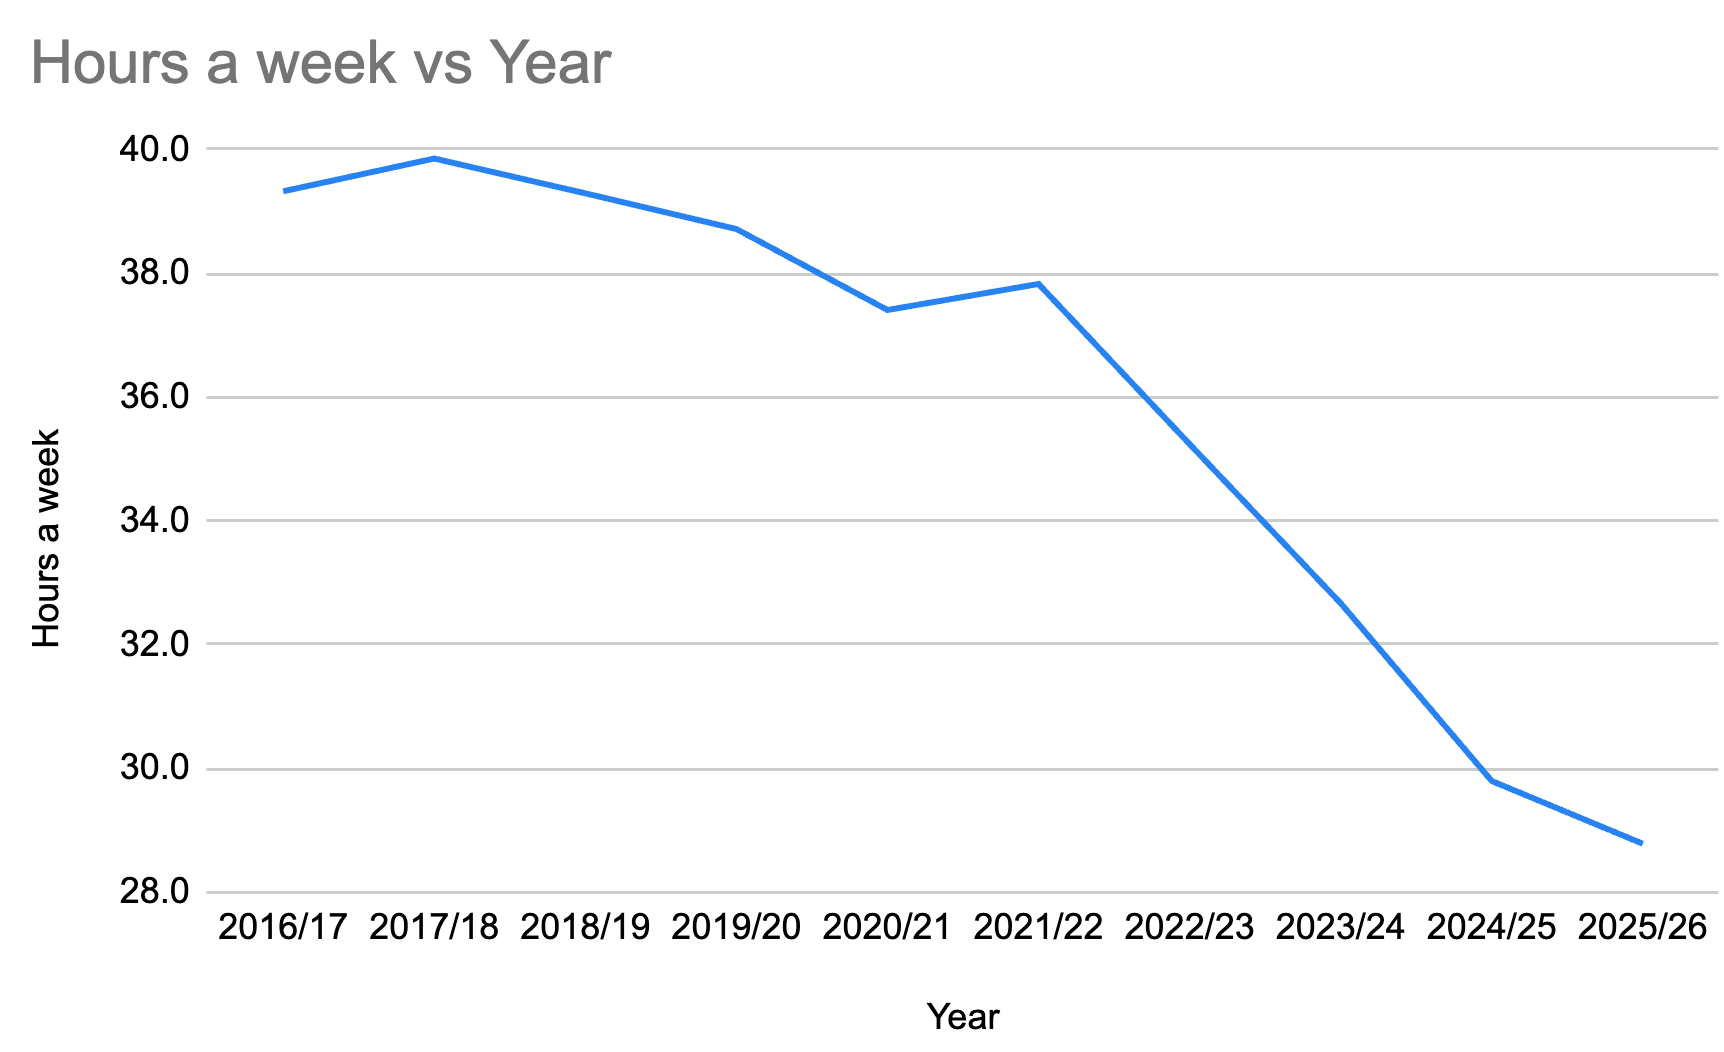
If we ignore the problem with the means test (it’s both highly problematic for many students and has thresholds set when most Freshers were born) and look at the maximum available loan for English domiciled students (away from home and outside of London) we can examine its “value” in terms of minimum wage hours that it funds.
For simplicity, I’ve looked here at the NMW for 21 year-olds over the years, and assumed that the loan supports a student for 30 weeks of a year.
In the first year that students could only borrow (prior to 2016 there was a mix of loan and grant), you’ll see that the system pretty much matched the study hours expectation in the credit system – 60 ECTS is 1,200 hours, so 40 hours a week.
Two pressures have combined to force the collapse we see since. First, particularly since the inflation crisis of 2021, maintenance loans have failed to keep pace with inflation because the OBR (on whose projections increases have been based) keeps finding that the reality turns out to be higher – and DfE never corrects the problem.
Second, the NMW has been increasing – in recent years because it’s moving towards a method that is based on the actual costs of living that people face in the economy.
The result is that without additional support, students undertake more paid work (if they can, and if they can find it) and/or skimp on studying.
So students are working this much because they have to, the obvious question is what happens if you take the pressure off. Restore maintenance support towards something a person can actually live on, and some of those forced hours should melt away, freeing up shifts for the non-students the policy is meant to help.
The reason it looks like a strong lever is that it is the only link in the chain that is both well-evidenced and sitting directly in the government’s own hand. Nobody has to persuade an employer or change the business cycle. They just have to change a funding settlement they already set.
And the evidence that the pressure is real is solid – HEPI’s work on what students need to live finds that even those on the most generous support must work more than twenty hours a week at minimum wage to reach a basic standard of living. A meaningful chunk of those 8.9 average hours is not a choice.
But it would be a partial fix. It only reaches home students – international students and graduate route holders are a large and fast-growing part of the crowd, and UK maintenance policy does nothing for either, so if they account for something like half the growth in the competing population, this lever addresses at most half the problem.
The freed-up work might not transfer cleanly either, because employers like student workers precisely for their flexibility and mobility, and if students step back, the employer may cut hours or reach for automation rather than hire a young non-student who is neither of those things – and the jobs are concentrated in university towns, which are not always where non-working young people live.
Meanwhile retail and hospitality are contracting regardless, so freeing up student hours into a market that is losing jobs does not reliably turn into non-student employment. And it is expensive, at a moment when the Treasury is squeezed.
So easing the need to work is necessary but not sufficient. It is the one part of the displacement problem that is unambiguously self-inflicted and within reach, and pulling it would help at the margin in a way nothing else currently on the table would. But the international, graduate-route, sectoral and demand-side pieces would all still be standing. Maintenance reform is the right place to start, not the place to stop.
Hidden figures
The Milburn report’s broad diagnosis – weak demand, a creaking welfare system, a starved further education sector, a youth job market that has thinned – is mostly fair. But it is built on a survey that can’t see one of the biggest changes in the young labour market this century – a large, hard-pressed crowd of students, with graduate route holders alongside them, all reaching for the same entry-level chairs as the young people who aren’t in education.
That crowd has grown from a sliver to several hundred thousand people, much of it invisible to the very survey the report trusts. The home-student part of it is driven by a maintenance system the government controls and never mentions. And the sharp collapse in non-student youth participation – the real red flag in the data – arrived exactly when the crowd was at its biggest.
Pushing NEET young people harder towards jobs, reforming their benefits, polishing their CVs – none of it touches the competition they actually face for the chairs that are left. If you want to understand why the first rung has thinned, you have to count everyone standing on it. The Labour Force Survey doesn’t, and so neither does the report. But from here a major culprit really does look like a mix of both home and international students not having enough money to study and live on.