

Oxford college admissions data
David Kernohan is Deputy Editor of Wonkhe
Tags
To Oxford then, and to widespread coverage of a slight fall in state school undergraduate entrants.
The university you now apply to if you can’t get into Imperial publishes annual admissions statistics. We get the choice of some whizzy tableau dashboards or an old school PDF – neither of which provides the data in a usable form for those looking to perform their own analysis.
This, of course, doesn’t stop me (it just slows me down and makes me more annoyed). What I wanted to look at was admissions students from deprived backgrounds (I used free school meals eligibility as a proxy), and whether colleges that did better on this metric did worse on outcomes. Are there, in other words, still scholars’ colleges and gentlemans’ colleges? Or (to pose the more popular – but equally silly – question) do contextual admissions come at the expense of excellence?
Oxford has been using student outcomes as a performance measure long before the Office for Students thought of it – and this being Oxford the process has a very silly name. The Norrington table is a weighted ranking of colleges by student outcomes, as a shockingly recent innovation dating from the 1960s. The methodology is both complex and ridiculous, but the only thing you have to remember is that a bigger number means better student performance.
Here’s the plot:
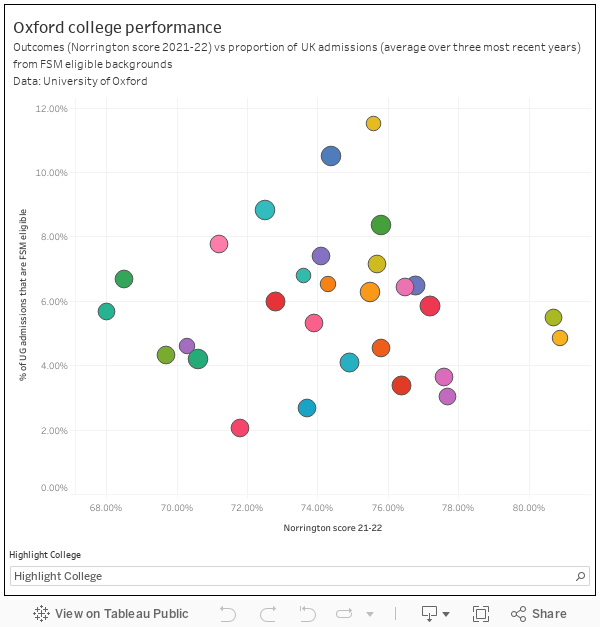
As you can see, there’s no obvious relationship between admissions policy and outcomes among Oxford colleges. If one were forced to criticise, the proportions entering with FSM eligibility are tiny – there are only two colleges (Worcester and Mansfield) that have more than one in ten UK students with a history of FSM eligibility. For the sector overall, the proportion is 13 per cent according to UCAS.
“If one were forced to criticise, the proportions entering with FSM eligibility are tiny…” Really? It’s actually striking that Oxford, according to their report, admitted 178 students in the latest reported cycle. Considering how few FSM students achieve 3 A grades or better at A-level (the minimum entry requirement), the actual intake must be very close to the maximum. A decade or so ago, nationally the number of FSM students in this category was 165 or so. When you consider what the average entry tariff is in higher education, the difference between Oxford (8% FSM) and the sector as a whole (13% FSM) looks small. You might actually expect the sector average to be much higher than 13%.
FSM is a difficult measure, but it can be an illustrative one, as a school Governor with a very high FSM percentage in the past there’s other measures that can show FSM isn’t the only factor. Going back to the 70’s I turned down a sponsored Oxford place knowing I was from an area that wasn’t considered to be normal for Oxbridge students and I simply wouldn’t have fitted in, even though I wasn’t a FSM recipient as my father was a company director/managing director, students may still make the same ‘will I fit in’ choice? As my experience visiting Oxford several years later proved to me I’d made the right choice, civil service and MoD recruitment my prefer Oxbridge, but though many employers have been learning a degree doesn’t guarantee ability attending the ‘right’ college might mean your worse than useless compared to a ‘lessor’ university graduate.