

NSS 2024 – results by student characteristics
David Kernohan is Deputy Editor of Wonkhe
Tags
It is notable that the newly released 2024 national student survey results split by student characteristics have not been accompanied by an Office for Students commentary.
The reasons for this are fairly obvious – there have been concerns about the data quality of information about 2022-23 students, and with only two years of data using this version of the NSS survey it is not really possible to talk about deviation from expected values.
So we just get the data itself, alongside a report on responses to the 2024 National Student Survey feedback exercise. This latter resulted in no changes being made to the 2024 survey, the use of benchmarks, or to the way results are published by theme.
The actual data is available by individual subject area – Wonkhe’s coverage earlier this year demonstrated that there are huge differences in student satisfaction between those studying different subjects. But of most interest to those in universities will be the sector-wide findings on the impact of student characteristics on satisfaction – and I’ve plotted these for you here:
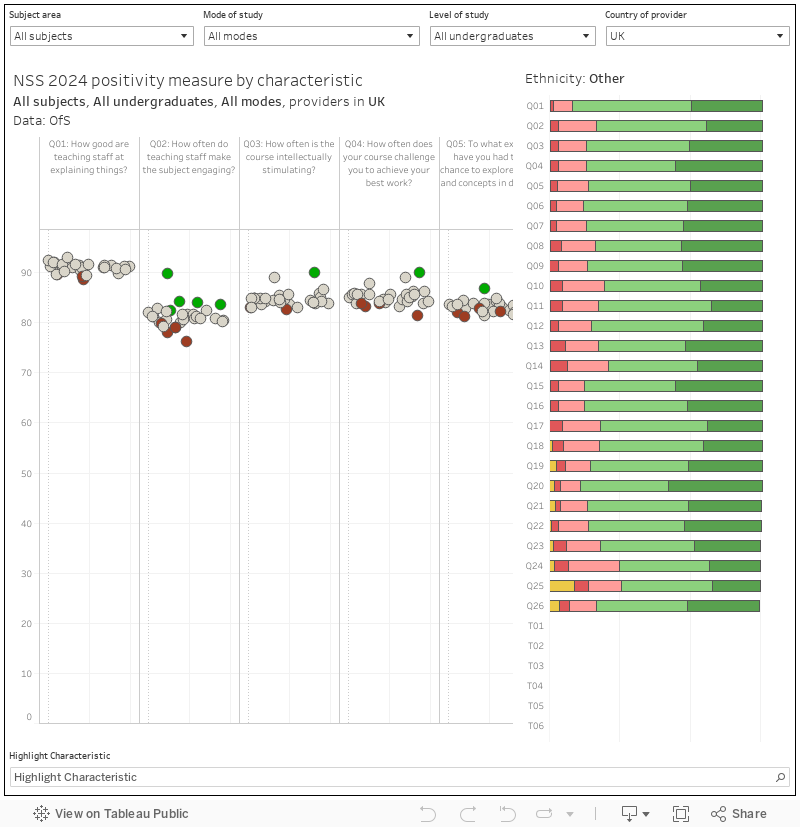
The chart on the left shows positivity measures by student characteristics (responses of 1 or 2) for each question (scroll along using the bar at the bottom to see them all) – with each mark representing a characteristic. You can highlight a characteristic of interest using the controls on the right – and you can set the other filters by mode of study, level of study, or country of provider.. Mousing over a dot shows a digest of all responses to all questions in the bar chart on the right.
What’s immediately apparent is that students with disabilities (in particular, mental health disabilities) are not as satisfied with their university experience as their peers across pretty much all. This strikes me as being a particular issue as it applies to low ratings for the communication of mental health support.
If you look at just providers in England, you can see that this effect also applies to the “freedom of speech” question. Students with disabilities (in particular, multiple impairments and learning difficulties) seem to feel less free to express their ideas, opinions, and beliefs.
And this is also true for students reporting their ethnicity as Asian – this group are also among the least likely to say teaching staff make the subject engaging.
Lesbian, gay, and bisexual students are more likely to be dissatisfied with course organisation and information – while remote students are noticeably unhappy with their opportunity to feed back on the course they are studying (but delighted overall with course organisation). Older students, however, are generally very happy with their course.
This, of course, is only part of the picture. Students are included in multiple groups, and what we don’t get is an intersectional analysis. It is possible to imagine a version of the OfS ABCs that deals with NSS results (or indeed the introduction of NSS results alongside the core continuation, completion, and progression metrics in ABCs).
Providers themselves have access to much more detailed data about their own students, but providers can and do benchmark with other providers to help them understand how to best support their students. It would be much better if this could be done transparently with open public data.