

Don’t sleep on HESES
David Kernohan is Deputy Editor of Wonkhe
Tags
The Higher Education Students Early Statistics (HESES) survey is one of those administrative data releases that goes unremarked. OfS released the data for 2024 yesterday, without fanfare.
It could be considered administrative data, in that it is designed by OfS to fulfil a small number of process-based purposes around funding and subscription rates.
But it really does deserve the full Official Statistics treatment, in that it represents our first broad look at recruitment by English providers in the 2024-25 (current) academic year. We can disaggregate by price group (which is based on subject of study), level of study (including PGR!), mode of study, and domicile (international students, home students, and “non-fundable” home students.
For instance: we learn that the overall international student headcount is down 6.3 per cent – around 35,000 students. This includes an 18.2 per cent (52,000) drop in the PGT (master’s loan) population (before you tell me that international students don’t get master’s loans, this number relates to the number on international students on master’s level courses that would be eligible for a master’s loan for home students).
There’s also a drop (4 per cent, 5,500 students) in home PGT master’s loan) students. As fees for postgraduate taught master’s courses are usually an important income stream for a university, this is a large problem.
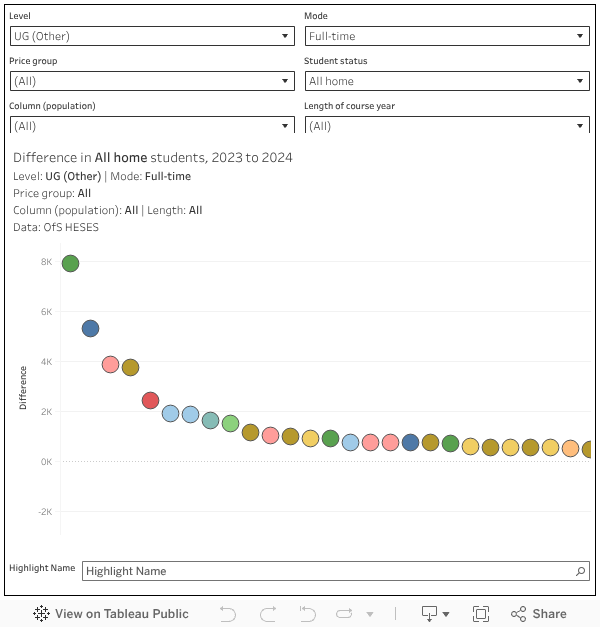
This release is full of fascinating and useful information like this. I’ve knocked together a couple of dashboards for your interest – the first shows the difference in reported student numbers between 2023 and 2024 as a sector ranking. You can filter this one by level and mode of study, price group, student status (home fundable, home non-fundable) – plus column (basically a start date prior to 1 December 2024, or a start date after 2 December 2024) and length of course year (longer or shorter than 45 weeks).
I’ve also done a provider level variant, that allows you to see changes by cost centre.
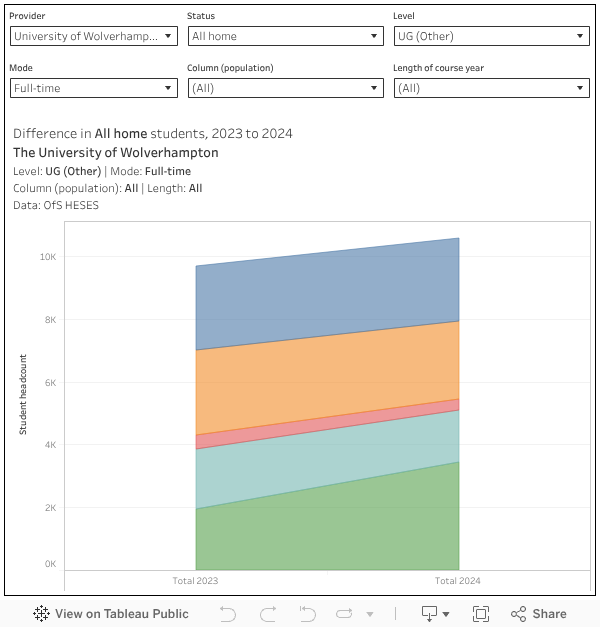
I shan’t draw attention to outstanding examples here, but judicious use of the two dashboards will show providers that have undergone significant expansion or contraction over the last year.