

Both place and individual socio-economic status can limit opportunity
David Kernohan is Deputy Editor of Wonkhe
Tags
The education and opportunities offered to young people with a history of free school meals eligibility is a valuable barometer of the life chances of an area as a whole.
That, at least, is the proposition put forward by the Sutton Trust in developing an opportunity index score for England and Wales at a constituency resolution. In a report sure to grab the attention of MPs and lobbyists the recommendations build on established (and broadly agreed) best practice in addressing the opportunity barriers faced by young people from lower-income backgrounds when compared to their better off peers.
For instance, the government is called on to “redouble” efforts on access to higher education: increasing maintenance support available to students, and stronger regulatory expectations focusing on addressing socio-economic disadvantage. There’s also a push for a clear and consistent approach to contextual offers (and, indeed, contextual recruitment by employers after graduation).
The index itself is a synthetic metric based on the difference between FSM eligible pupils (at age 16) and an overall average on six measures:
- Attainment 8 score (based on the best 8 GCSE results attained)
- A level results (average UCAS points)
- Proportion in sustained education or employment post-18
- Proportion with a degree by age 22
- Average earnings at age 28
- Proportion in sustained employment at age 28.
This is a massive amount of data – covering 10 million young people over two decades (extending from those who took GCSEs in 2004 to those taking the exams in 2024.
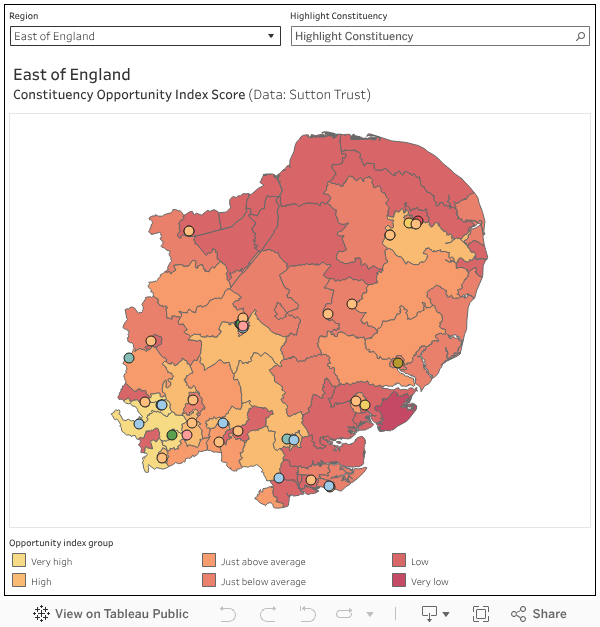
The output is a constituency opportunity ranking – with East Ham at the top and only one non-London consistency (Birmingham Perry Barr) in the top 25, and only eight in the top 50. At the other end of the table we find Newcastle upon Tyne Central, Cramlington and Killingworth, and Mid-Leicestershire. Lower ranked areas tend to be dominated by towns and semi-rural areas in the North East and North West, although there are no straightforward patterns.
Here’s a dashboard showing how that looks – I’ve added university campus locations. It does tend to be the case that constituencies with universities do better on these measures. However there are huge inequalities everywhere – even within supposedly prosperous regions like the south east.
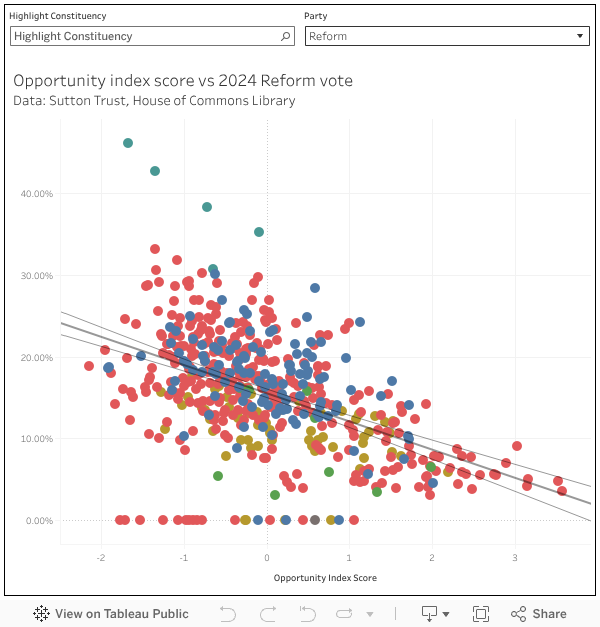
The constituency framing lends a political perspective – and it is not surprising to find a correlation between a lack of opportunity for less well off families on this measure and the proportional Reform vote in the 2024 elections.
We are also presented with evidence that in areas where more people left their region by their 20s the opportunity index is higher, and that more ethnically diverse constituencies score higher.
But the argument being built is that geography, along with socio-economic factors, shapes opportunities. While universally pupils with who could access FSM at age 16 fare less well than their peers on every measure, in high scoring areas (which are particularly concentrated in London) the impact that this has on life chances is much less pronounced.