


No UK generation has had more opportunity to attend university than those currently aged 18-24 – the early years of Generation Z.
This demographic group, which includes most current undergraduates, and those a few years after graduation, make up around 11% of the UK population. There are 148 constituencies where Generation Z constitute a larger proportion than this – in most cases this includes students at a local university. Many will be first time voters.
But of the 60 seats with over 16% of their population in Generation Z, only six are held by the Conservatives – including Uxbridge and South Ruislip, currently held by Boris Johnson. While a surge of 18-24 voters latter could make for a memorable evening for many, it would not have much of an impact on the election overall.

But will there be any kind of generational effect visible in changes to voting patterns?
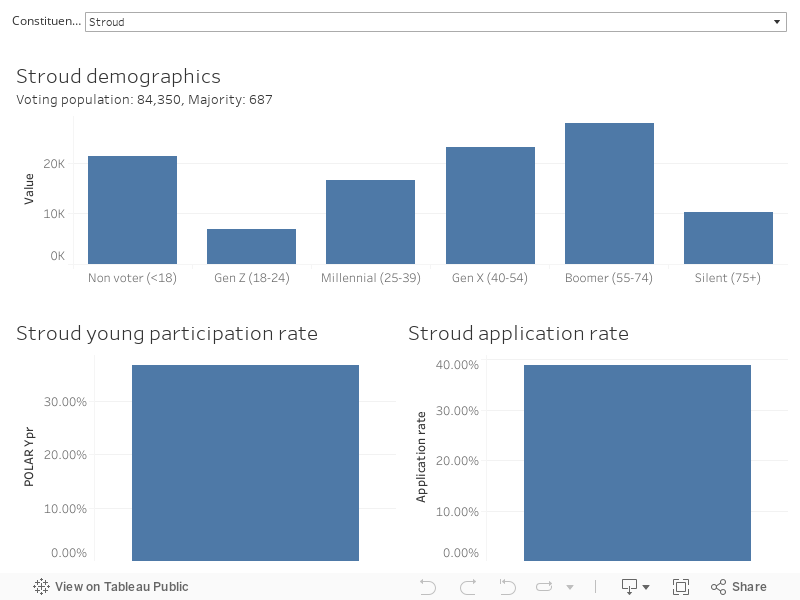
To help you understand some of the differences in seats, I’ve plotted demographics (alongside UCAS application rates and POLAR young participation rates) for each constituency in this visualisation.
YouGov if you want to…
The YouGov Multiple Level Regression Poll (MRP) was closest to predicting the general election in 2017 – it actually works by using the demographics of each constituency to model a local result from data taken from a large panel. We don’t get access to those demographic profiles (and they extend beyond age, to sex, education level and employment status), but the existence of a constituency-by-constituency does let us look at the change between the 2017 results and a good 2019 estimate.
Here I’ve plotted the percentage point change in the Conservative, Labour, and Liberal Democrat votes (x axis) against the percentage of those eligible to vote in each generational category (y axis). I’ve added filters for application rate, participation rate, and region for those keen to explore in more detail.
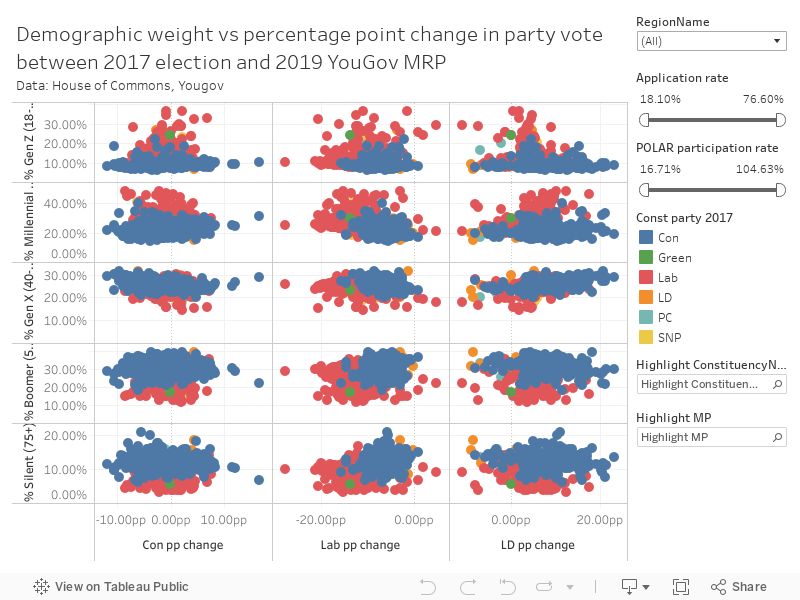
You’ll need a large screen to get the most out of this, but what we are able to see here is a possible relationship between the changes in voting behavior and the ages of eligible voters in a given constituency. And there are some odd patterns.
Don’t put X in a box
Note for instance, that seats where Conservatives are predicted to lose significant voter share tend to have a larger than average proportion of Generation X (40-54) voters – and the same demographic is larger than usual in seats where the Liberal Democrats are predicted to gain votes.
Generation X is interesting in higher education terms. They would have had a much greater opportunity to attend HE (during the 80s and 90s) but would be the last generation to have been able to do so without tuition fees (first charged in England in 1998). Living through the years of university place expansion could well have had an impact on aspiration even for those that did not attend university.
In the 2017 election, Generation X straddled the age breakpoint that switches between a Labour and Conservative vote – usually plotted at around 40 years old, it rose to 47 last time round. This new development came alongside the continuation of another trend – that of older people to be more likely to vote.
And they also straddled the leave-remain age breakpoint in 2016 – which was generally estimated as around the late 40s. There’s a likely confounding variable here as those with university experience are decisively more likely to have voted remain – and this is a generation with a higher likelihood of university experience.
Another fascinating effect can be seen if you move the POLAR or application rate filters – many seats with a projected growth in Conservative votes (and a projected shrinkage in Liberal Democrat votes) disappear as you approach 40 per cent. This looks to me like another example of the graduate Brexit effect
Will the earth move on the 12th?
From the YouGov MRP polls we see only four seats where the Labour vote is projected to grow from 2017 – Portsmouth South, Canterbury, Leeds North West, and the Isle of Wight. I’ve got no explanation for the latter, but the first three are all student seats and are currently Labour marginals.
In many ways this is a Conservative election to lose, rather than a Labour election to win. So an upset – in the unlikely event there is one – is more likely to come from Generation X than Generation Z.


Fascinating analysis, thank you! On the Tableau page, I wondered what the “silent” category refers to please?
I wonder just how many of the me,me,me I want it for free, of all generations, will vote to be massively taxed if they earn enough to provide things for ‘free’ for those who CBA? Whilst some UG’s will certainly be influenced by such (false?) promises, other deeper thinking one’s taking the longer view will see that as potential higher earners they may well be the one’s to pick up the tab in the future.
Of course this ignores the real reason for this election, BREXIT, and the failure of government to deliver the democratic mandate delivered by the people, it being blocked in the main by those who wish to sit in the E.U. gravy train long after they become unelectable in the uk. But then with so many ‘useful idiots’ ignoring the depth of despair in many communities that voted for BREXIT, Nero and Rome spring to mind, (false?) promises of ‘free stuff’ and yet more referenda (until they get the ‘right’ result, how very E.U.) I suspect this may be an issue for years to come.
The ‘hard’ science post grads I work with mostly see through the (false?) promise pretence, yes ‘free’ stuff would be nice, but nothing is ‘free’. And as one pointed out, for the telescreen network (Orwell, 1984) to work effectively high speed broadband is a prerequisite, https://www.cnet.com/news/wikileaks-cia-hacking-tools-phones-apple-samsung-microsoft-google/.
The silent generation generally means the one preceding the baby boomers, usually from the mid 1920’s to the end of the second world war
I think you’ll find young people are perfectly willing to pay more tax should they ever be fortunate to earn enough – they understand the principle of ‘From each according to his ability, to each according to his needs’ as absolute common sense.
@Andy While many variables predict voting behaviour, income is certainly one of them. Sorry to break it to you but high earners are less likely to vote for high tax parties, especially those on paye and the self-employed. The effect can be mitigated to some extent by geography and education levels but not eliminated. It’s also generally true that lower income earners would prefer a bigger wage than more public services, given the choice which is a big reason politicians try to promise both. This is not to endorse the other points N makes.