


So we’ve had the UCAS “grades on entry” tool since March and ever since then I’ve been meaning to explore them in more depth.
It’s not the first time we’ve seen data on entry grades – UCAS has traditionally reported these at a subject level and for various demographics as a part of the equalities release that usually turns up alongside the January end of cycle report. It is, however, the first time we’ve seen these alongside the grades that providers more often present to students as “entry requirement” grades.
The other fascinating developments within this initiative are maximum (highest) and minimum (grades), and entry rates (the proportion of people who apply to this course who get a place). But what can we learn from them?
All the grades
It has taken a long time for UCAS to get the sector to the point it is willing to have all these pieces of information on the same page. There have been reputational concerns and commercial concerns – some of which have been addressed by the addition of a (plain text) statement on the way contextual offer making works. But we don’t (yet?) get this information as open data: it’s on the website, but there’s no structured version for us to analyse..
It’s worth systemising the various kinds of grades that get chucked about in these conversations:
- Applicant expected grades (someone applying to university from school may feel – based on teacher feedback or personal optimism – that they are on for three Cs)
- Entry requirement grades (what we have traditionally seen from providers as the entry tariff for a particular course. Applicants generally use these to decide which courses to apply to)
- Teacher predicted grades (the ones on the UCAS form – providers use these in offer making decisions)
- Actual grades (the results an applicant got on results day, and the starting point to decisions on both sides as to where or whether to take up a university place)
- Entry grades (the grades that a university actually accepted for entry on that course: which may differ from entry requirements due to offer modification or clearing activity)
Ideally to understand offermaking and decision making we would have access to all of these sets of grades at a course level. We currently see 3 and 4 at a broad subject level in the end of cycle data, 2 and 5 are on the UCAS website pages for each course (most of the time, there are opt outs), and we kind of have to infer 1 from applicant behaviour.
Pharmacy
For me, entry requirement grades are a signal in a marketplace. They contain a great deal of implicit information – you could argue grades tell you about the quality or scope of the course, the prestige or desirability of the provider, the marketing intentions of the provider, or the value of the final qualification. That’s a lot – grades are not an efficient signal, and a part of the thinking behind releasing entry grades was to make this signal more usable by students.
It is technically possible to “scrape” information from the UCAS pages automatically. I have chosen not to do this here, but I have manually gathered information about one particular course that I find interesting.
Pharmacy (MPharm) is a course where content is tightly specified by a professional body. The General Pharmaceutical Council (GPharmC) tightly specifies what an MPharm should contain and what opportunities it should offer students. GPharmC regularly inspects provision and lists qualifying courses on its website.
There are 34 accredited full-time, four year, MPharm degrees offered in the UK. Four of these (Bangor, Leicester, Sheffield, Teesside) are new for 2025. As far as the available information goes these courses are directly equivalent – if you complete an MPharm and a qualifying preregistration year you get to register to be a pharmacist, and there are no indications that you are advantaged or disadvantaged by your choice of provider when you become a pharmacist.
To all intents and purposes, each one of these courses is exactly equivalent in terms of setting someone up to become a pharmacist. Despite this, we see a range of entry grades and offermaking behaviour.
Note: Two providers (Strathclyde and Robert Gordon) appear to have opted out of presenting additional entry data.
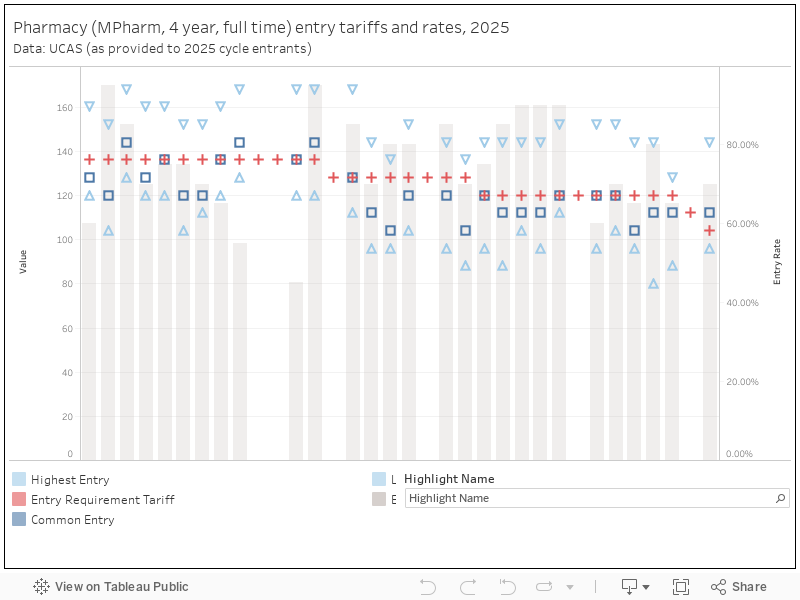
So what are we seeing?
In this slice of the sector we can take grade differentials based on the value of the qualification (it’s the same qualification) and the quality of the course (it is validated to the same, high, professional standards). So one argument would be to take higher entry tariff (and entry) grades as a function of provider prestige.
A glance along the names and this checks out. If we look at entry requirements (the traditional UCAS grades) there’s three tiers of entry requirements: older, established providers dominate the group intending to make 136 point offers in 2025. There’s one Russell Group provider (Cardiff) in the middle group of providers looking for 128 points, and the lower tier (mostly 120 points) is dominated by post-92 providers.
Common grades (the grades students who enter the cost tend to have) are a different story. The University of Sunderland has the lowest entry requirement offer in the sector for an MPharm (104 points), but it has a higher common entry tariff than the Medway School of Pharmacy (a collaboration between Kent and Greenwich that publishes a tariff of 128 points).
Another hypothesis would be that providers with higher entry tariffs and higher common tariffs are harder to get into – that they are elite, selective, courses that use a high tariff as a filter. This does not appear to be the case.
The grey bars show the entry rate (the proportion of applicants who are placed), with the shade of grey used representing the size of the course (a darker colour means more students). From this we can see that at Nottingham it is very hard to get onto a very large course, whereas at Newcastle and Ulster a much higher proportion of applicants get to enter smaller cohorts – even though in terms of entry tariff and common entry grades Nottingham and Ulster are identical, while at Newcastle the common entry grade is substantially lower.
What about league tables?
It will not have escaped your attention that we are not the biggest fans of university rankings here at Wonkhe. There’s a bunch of them available, each with a different mix of data points and indicators – so if what you think is important about a subject area tallies with what the league table compiler thinks you are well set for advice.
This next dashboard allows you to examine a tariff measure of interest (entry requirement, common entry, maximum entry, minimum entry) against providers’ ranking in the “big three” UK league tables for “pharmacy and pharmacology.” This subject grouping includes providers that do not offer the MPharm, but do offer other courses in the area – I have not shown these.
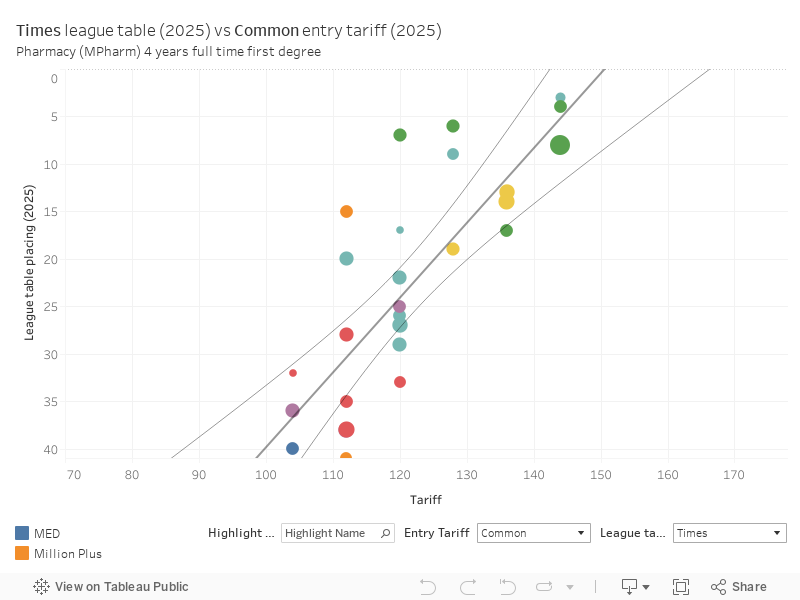
And this is where it becomes genuinely fascinating. There’s not really any relationship between published entry tariffs and league table placings, but there is evidence of a correlation between common entry tariffs and The Times University Guide and the Complete University Guide (not for the Guardian University Guide, which is generally less concerned with prestige or research performance, and more focused on offering guidance to prospective undergraduates).
In other words, the relationship works in the opposite way than you might expect – actual recruitment behaviour is linked to rankings, the initial tariff stance is not. To be clear, these are moderate correlations (r=0.58 for The Times, r=0.69 for CUG – each at p<0.0001) but striking nonetheless.
So – even taking a pretty consistent subject like pharmacy, there appears to be an awful lot more going on in the undergraduate market than we may have expected.


Thanks David, very informative as always.
Do you mind adding in some links to the UCAS data you mention in bullets 3 and 4? I’m struggling to find the subject level data.
“It has taken a long time for UCAS to get the sector to the point it is willing to have all these pieces of information on the same page.” I’m not sure the sector had much choice and significant concerns remain. Offer making is nuanced, complex and not just about grades. Complexities difficult to convey through data analysis. I just hope the tool doesn’t negatively influence too many young decisions.