Universities have rightly recognised the awarding gap as an important issue and many are working hard to reduce it, introducing a variety of interventions to attempt to tackle it and monitoring their performance through a dashboard.
Let’s take a moment to imagine the following scenario – 74 per cent of white students get good degrees while 60 per cent of black students get good degrees, giving an awarding gap of 14 per cent.
This sounds pretty awful – and we would conclude that we need to do more to close the gap between white and black students who received good degrees. Yet this analysis is missing a really important piece of information.
We then learn that the total percentage of good degrees is 72 per cent. We can use a representation ratio to take account of this base rate information by dividing the percentage of a particular ethnic group that gets a good degree by the total percentage getting a good degree.
This will give a representation ratio where 1 is well represented, above 1 is over represented and below 1 is under represented. In this scenario above white students (74%/72% = 1.02) are over-represented in good degrees by 2 per cent, and black students are under-represented by (60%/72%= 0.83) 17 per cent.
Now we have a different conclusion – white students are over represented marginally, whilst black students are underrepresented substantially. The awarding gap neglects this base rate information and could lead to incorrect inferences being drawn.
Let’s take another fictional example to see just how misleading comparing percentages between groups can be. This time let’s imagine 65 per cent of black students get good degrees and 68 per cent of white students get good degrees – creating a 3 per cent awarding gap. We conclude that although small, more work needs to be done to eradicate the proportion of good degrees given to white as opposed to black students.
But now we learn that Asian students get 72 per cent good degrees and that the total proportion of good degrees is 70 per cent. Now both white and black students are under-represented in good degrees (white 3 per cent and black 7 per cent) while asian students are over represented by 3 per cent.
The use of representation ratio helps to put in perspective how many good degrees we should expect to see from any one group and might subtly change one’s conclusions and the actions one might wish to take.
Setting the record straight
The above examples were totally fictional just to illustrate the use of how representation ratio could be a useful aid – but what is the overall picture over the difference in good degrees?
We use data from the Higher Education Statistics Authority (HESA) of full-time first degrees awarded between 2014/15 to 2022/23. Unclassified degrees were removed from the analysis.
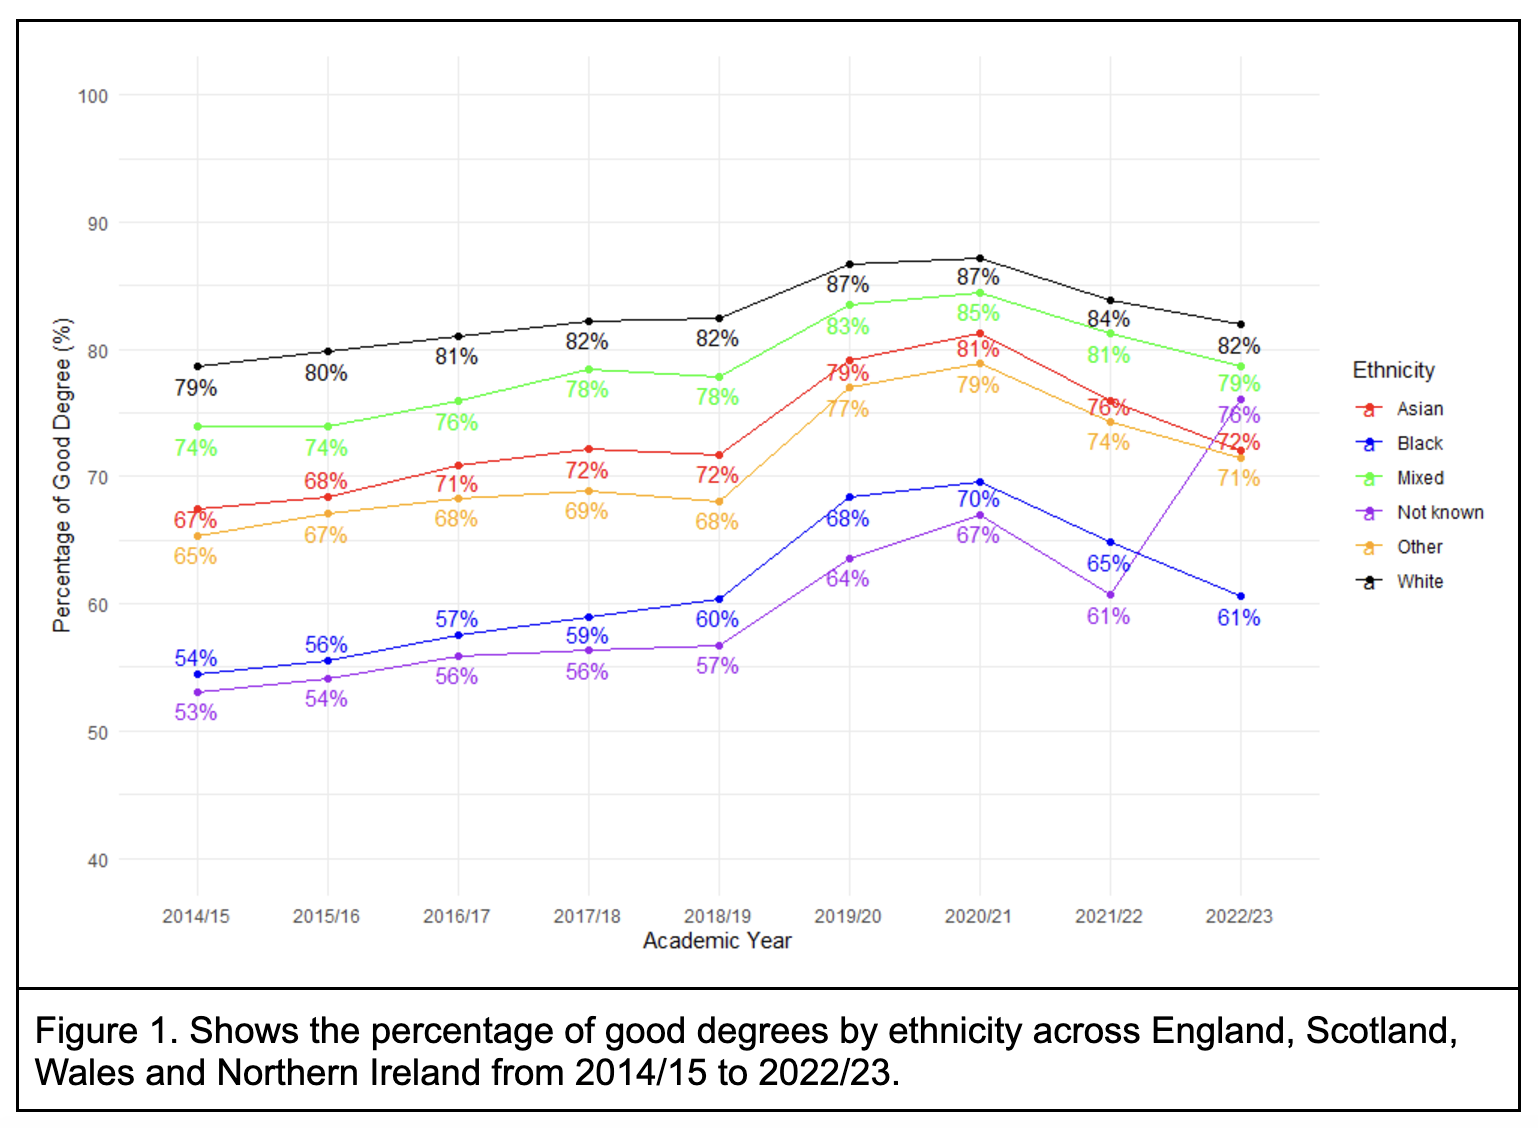
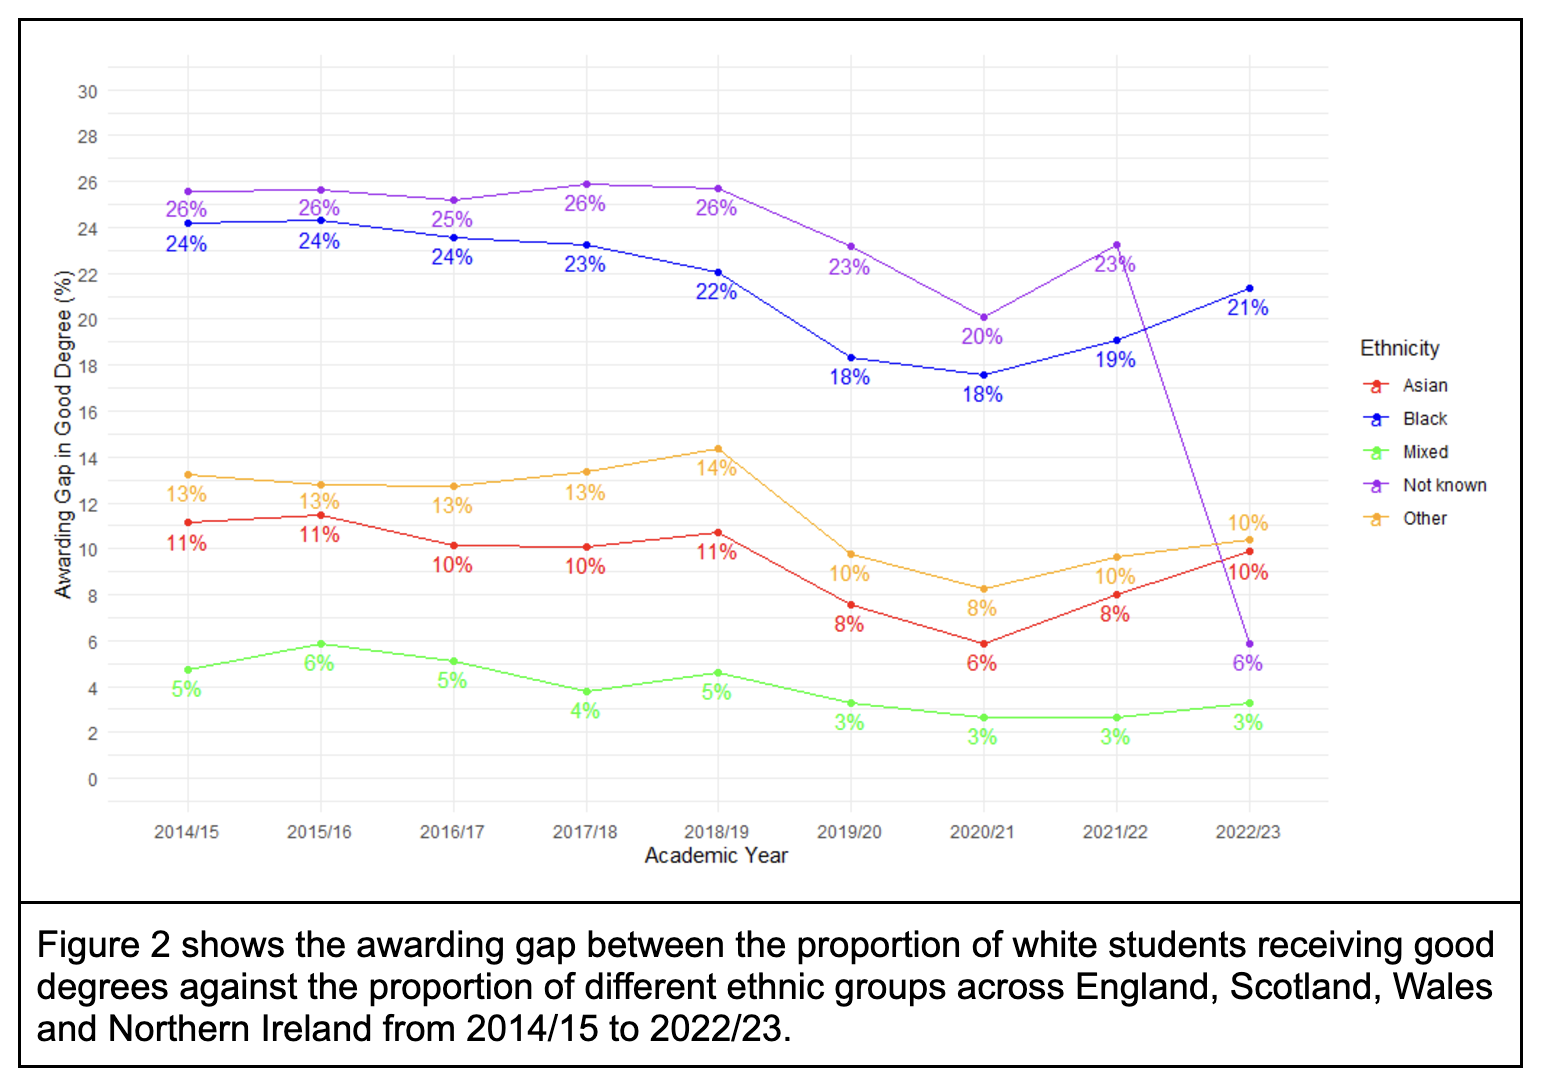
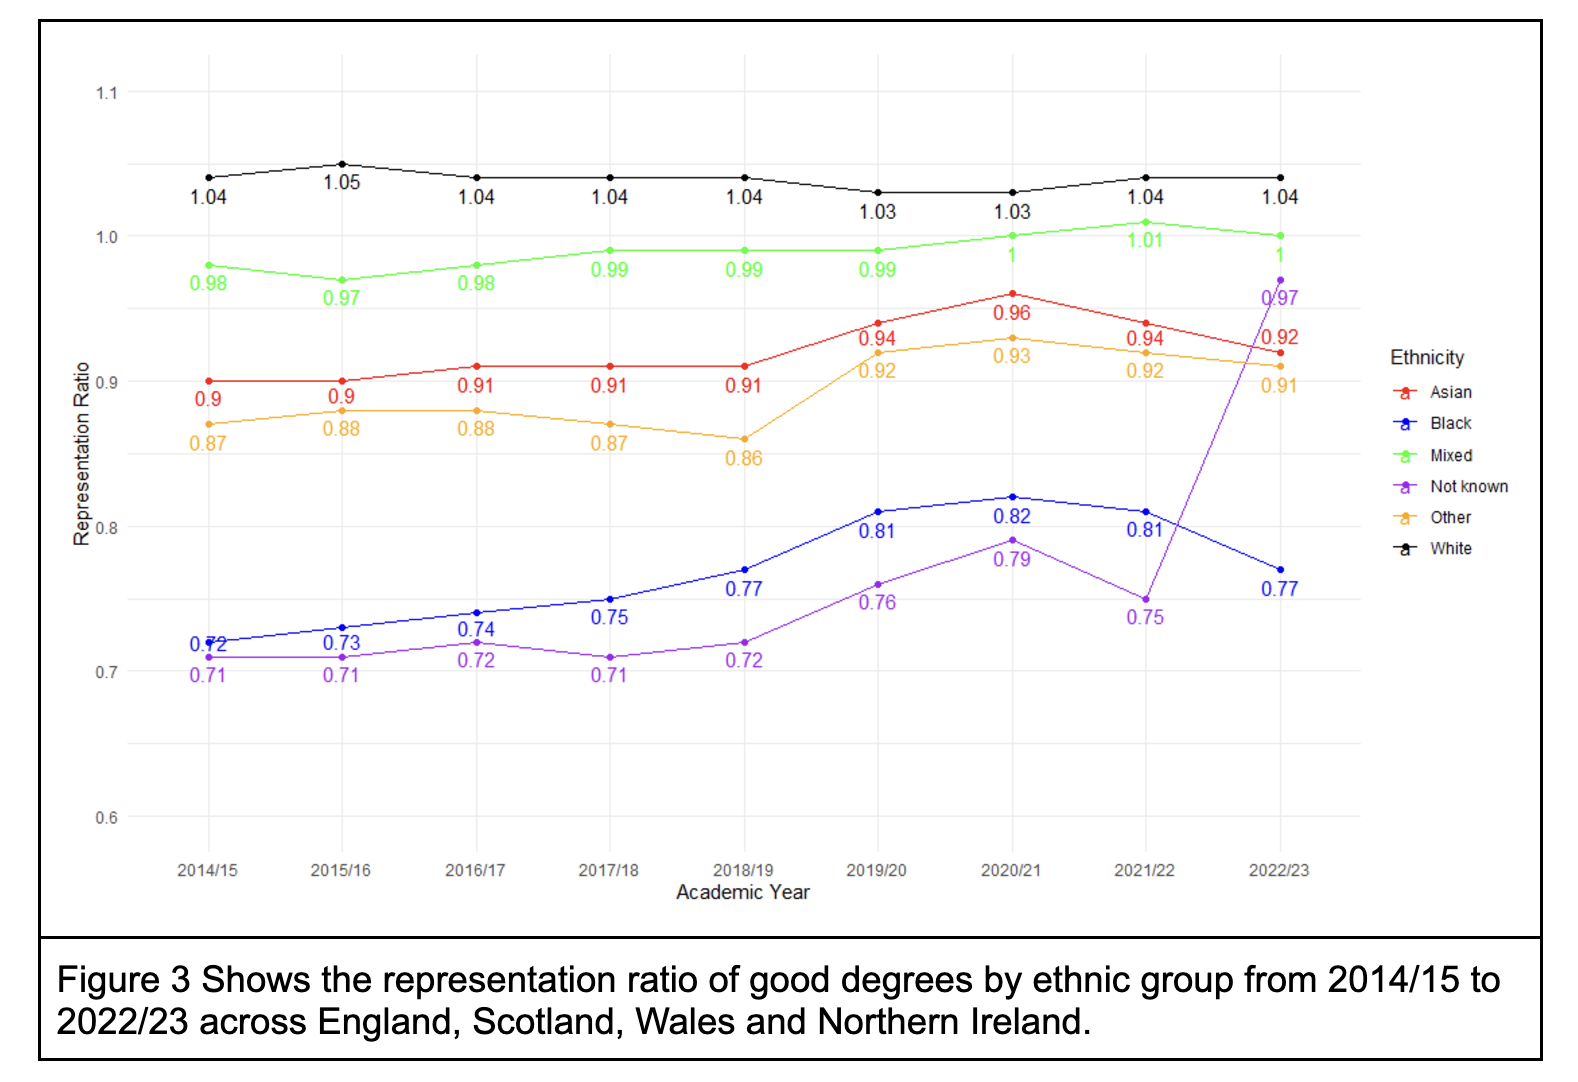
Below we present three figures which show the proportion of good degrees by ethnicity, the difference in the proportion of good degrees compared to white students (awarding gap) and the representation ratio (the proportion of good degrees for an ethnic group divided by the proportion of good degrees that year).
Figure 1 clearly shows that 79-87 per cent of White students attained a good degree over the last nine years which compares to 67-81 per cent of good degrees for Asian students, 54-70 per cent for Black students, 74-85 per cent student of Mixed background and between 65-79 per cent of students from Other ethnic backgrounds attaining good degrees.

Figure 2 shows this data from an awarding gap perspective where depending on the year the gap between Black and White students in good degrees varies from 18-24 per cent. The awarding gap for Asian students compared to White varies between 6-11 per cent and for those from a Mixed or Other ethnic background it varies between 3-5 per cent and 8-13 per cent.

Figure 3 shows that Black students are consistently under-represented in good degrees by between 19-28 per cent over the last nine years. For Asian students it is between 4-10 per cent under-represented, while for the students from Other ethnic backgrounds underrepresentation varies between 7-14 per cent.

Those of Mixed ethnic backgrounds for the past three years have been represented well in good degrees whilst White students are consistently over represented anywhere between 3-5 per cent.
All three graphs show the same data but tell the story in slightly different ways and each in their own way having something to offer. Representation ratio can be used in lots of other circumstances where you are comparing groups and wish to see how the comparison stack up against a base rate.
For example, when looking at graduate outcome data we might wish to compare genders on unemployment or compare different disabilities with the likelihood of attaining a professional job. Representation ratios may well ensure that the sector’s efforts at every level are targeted appropriately.


The use of white and black to describe ethnicity is highly misleading. For examples, there are many white ethnic minorities (I count myself amongst them). Ethnicity is much more complex than the terms currently used.
Thanks Barbara for leaving a reply. I agree that these are simplified labels and within these large groups there will be small groups that really struggle and on the contrary could do rather well. I guess the challenge much like the debate around the use of mission groups is if you don’t use simplified labels there is a graph or table with many many data points and its hard to make sense of yet that loss of data obscures as you say the complexity of ethnicity and its intersection with other important factors.
This just represents exactly the same data in a different way. A much bigger issue is data which is not taken into account in either the awarding gap or the “representation ratio”. A crucial thing is the participation gap. Black people in the UK are substantially more likely to go to university than White people. This is not taken into account in the awarding gap (and in the “representation ratio”). This is misleading.
I made that same argument with an illustrative example as a comment under the following article:
https://wonkhe.com/blogs/we-need-better-awarding-gap-metrics-to-genuinely-address-inequity/
Thanks Bobby, I agree that the participation rate along with other potential omitted variables would be valuable to include within the awarding gap debate. The representation ratio whether applied here or else in terms of withdrawals or progression or GO outcomes is a useful tool and for taking account of base rates and certainly better than a plain percentage although obviously for a more complete analysis more complex modelling would be required.