


If you are the kind of person who sits down to read analysis of the latest available TRAC (officially, Transparent Approach to Costing) data the last thing you would expect would be cautious optimism.
The sector, after all, is circling the financial drain – and when you can read press releases from unions and sector representative bodies that say fundamentally the same thing you could feel confident that this is the situation.
Much of what we’ve recently read in the press is about the impacts of measures taken to address this financial peril – course closures, job cuts, changes in terms and conditions, and a retreat from spending plans on everything from maintenance to recruitment.
And what the latest TRAC tells us is that these measures are working.
Who turned on the light?
To be clear, it’s not time to quit lobbying for a better funding settlement.
Based on 2023-24 submissions from 128 institutions in across the UK the sector has an aggregate deficit of £2,003m – down substantially from £2,854m in 2022-23. The sector has made savings of more than £800m between two years – no mean feat where costs are rising and the value of income is falling.
What’s going on under the hood is that institutions are getting better at recovering the costs of things they are funded to do – 95.7 per cent of costs were recovered in 2023-24, up from 93.6 per cent in 2022-23. Costs still exceed income (they have done since the pandemic) but the direction of travel is promising – providers are generating more income (up 5.8 per cent to £44,508m) while limiting increases in costs (up 3.5 per cent to £46,511m).
This is good news, but counterintuitive. We know that staff costs are rising (there was an annual pay uplift, and pensions spending has increased substantially for those providers involved in TPS), we know that the cost of doing business (everything from maintenance to logistics to consumables is rising). And TRAC confirms this – staff costs are up 6.4 per cent, other operating costs are up 4.7 per cent, on last year.
There are savings in the costs of finance (such as interest payments) – these have fallen 13.3 per cent over last year, though this does not make a huge contribution to overall spending.
MSI (coming on like a seventh sense)
We do, however, need to talk about the margin for sustainability and investment (MSI). It’s the most controversial part of the TRAC specification, and when you tell people that universities need to have at least some money for non-income generating fripperies like student support and estates maintenance within any calculation of the cost of doing business they will lose their minds.
The calculation is done by institution and is based on an average of three years of data and three years of projections (the nerd in me wants to be clear that these are based on Earnings Before Interest Taxation Depreciation and Amortisation – EBITDA) expressed as a proportion of full economic costs. In 2022-23 this was £3,770m (8.4 per cent of FEC), in 2023-24 this was £3,548 (7.6 per cent of FEC) for the sector as a whole.
The effect here is that the total costs of running a university (FEC plus MSI) looks lower than it did last year. This is more evidence of savings over multiple years – cutting spending on maintenance, sustainability, and student services. This will make cost recovery and the deficit look better: it doesn’t explain all of the improvements this year but it explains some of them.
The document provides a fuller list of institutional decisions that would have an impact on the MOS calculation – inflationary pressures, a (regulator advocated) caution in recruitment income growth and research activity growth, variability in forecasts as more institutions design in large changes of focus to plans for future spending, and the usual weirdnesses around pension provisions.
Spend less, earn more
So institutions are making cuts, and look financially healthier for it. But there is still an overall deficit, and if cuts and efficiencies are the only answer to financial constraints there is a long and painful road left to walk.
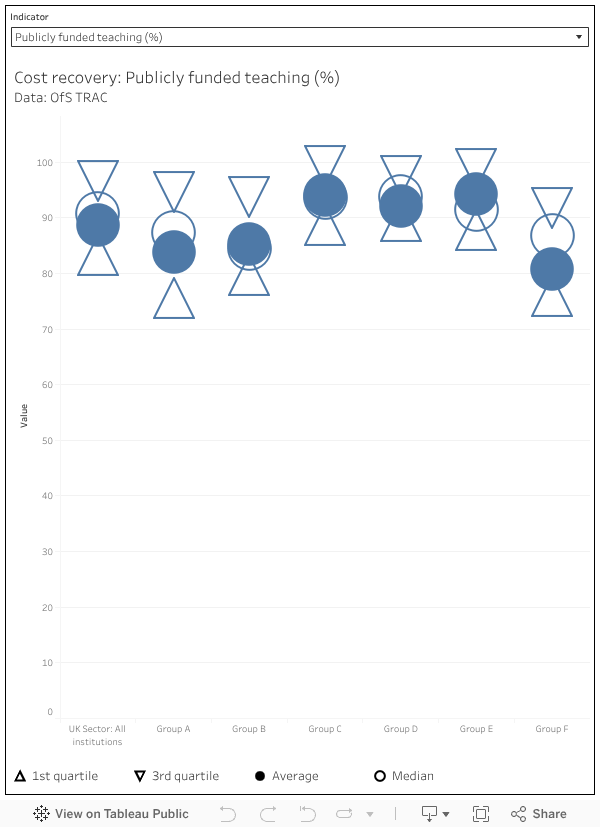
Within the overall £2,003m deficit, the £1,693m deficit on publicly funded teaching is a major contributing factor: for every £100 a university spends on teaching home students, it receives £89.20 from the public purse. This varies, as we will see, by the type of institution in question and what else it gets up to. In real terms income is actually up slightly (a slight rise in the number of students), but it costs more to pay staff and to do all the other things that teaching requires.
Conversely non-publicly funded teaching (all overseas students, and some self-funded home students) has a 143.1 per cent recovery rate, generating at a £3,232m surplus. The recovery rate is actually down marginally on last year, but the overall income from this source is up by 7.8 per cent (to £10,727m).
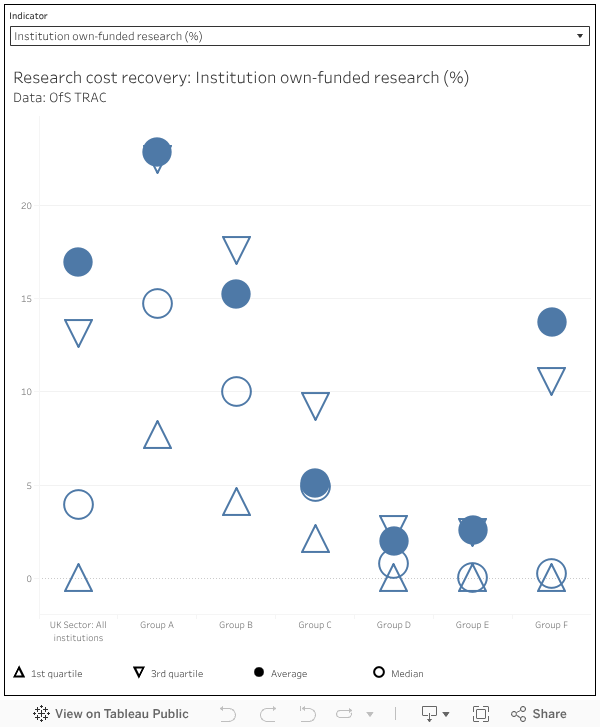
Research has never had a good recovery rate – we’re now down to 66 per cent for 2023-24, from 68.5 per cent the previous year, and again there’s substantial differences by provider type. Again we can point to staff costs and operating costs rising as the reason, but we should also recall that most publicly funded research returns 80 per cent, and some research has no income attached at all.
We should also note that other (income generating) activities like catering and accommodation run a small deficit, while other non-commercial activity (investments, donations, endowments) have an on-paper surplus.
Peer pressure
While the sector level figures are useful, they disguise a lot of diversity in the sector. We still – in 2025 – do not get institutional TRAC data, which would genuinely be useful for understanding where providers have costs that are substantially higher than comparators.
Instead, we are back with groups A-F:
- Group A: Institutions with a medical school that get 20 per cent or more of their total income from research (pretty much the Russell Group)
- Group B: Other institutions with research income constituting 15 per cent or more of all income (largely the big, research intensive, traditional universities that sit outside of the Russell Group).
- Group C: Research income between 5 and 15 per cent of all income (larger and research focused post-92 providers with some pre-92s mixed in)
- Group D: Research income less than 5 per cent of a total income greater than £150m (Other big post-92 providers)
- Group E: Research income less than 5 per cent of a total income less than £150m (the rest of the traditional universities, plus specialist providers)
- Group F: Specialist music and arts institutions (as you might expect)
Here’s what they all spend money on, as a proportion of total expenditure:
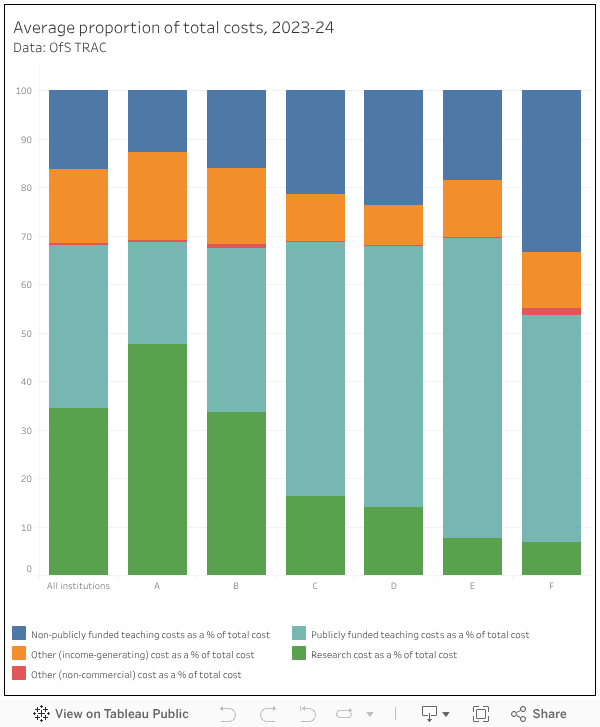
And here’s the proportion of costs they recover on each kind of spending:
And here’s what happens when you drill down into research:
It’s not usually a good idea to make blanket statements about sector finances – what’s true for one university is generally not true for another. But in this case the generality is valuable – it highlights that the problems facing the sector are less to do with autonomous decisions and more to do with the overall financial settlement. Individual, provider action is clearly helping the situation. But it won’t be enough.


Of course, cost-recovery accounting for research completely ignores all the consequentials of research such as REF income derived many years later from outputs and Impact Case Studies and prestige. The benefits of research cannot all be captured on a spreadsheet!
And also misses the point that much university research is subsidised in effect by staff working beyond their paid, contracted time in publications, grant applications etc.
….you’re assuming that all research outputs result in future benefits and accumulate into enhanced prestige. And how do we apply these future unknown benefits to fund investment in staff and facilities? We can’t spend fantasy benefits!
If the sector value of the MSI is £3.8 billion and the sector TRAC deficit is £2 billion, then on the basis that any other organisation or company would report its financial results, ie using real money and international financial reporting conventions, then the sector overall has a £1.8 billion surplus. Not bad given years of financial constraint.
This article seems to be overlooking the significant pension adjustment in the 2023-24 Financial Statements. There were surpluses on pension funds and a credit has gone through in a lot of Financial Accounts. Without this they would probably be in deficit or their deficit would be higher. The pension debit / credit is a paper based adjustment and bears little impact in reality, so should be taken out when looking at actual financial positions.
Scratch that. I just remembered that the Pension Adjustments are removed from the TRAC process and therefore does not affect the values in the article. Apologies!