Time to let the WP Gini out of the bottle
Diana Beech and Nick Hillman of HEPI introduce new research on widening participation, by Iain Martin of Anglia Ruskin University
This article is more than 8 years old
Comment|

Diana Beech is chief executive of London Higher
Director, HEPI
The Higher Education Policy Institute (HEPI) has today issued a new Policy Note by Iain Martin, the Vice Chancellor of Anglia Ruskin University.
Benchmarking widening participation: how should we measure and report progress? provides a new measure of participation for each UK university.
It is loosely based on the Gini coefficient, which measures how equal different societies are: a society in which everyone has the same income would score zero, and one in which all the income goes to one person would score one. In his paper, Martin builds on the Gini index to show how well different universities reflect the country in which they are based.
How it works
The new HEPI study takes as its starting point the POLAR3 (Participation of Local Areas) classification system. This divides the UK into five different categories – or quintiles – according to the proportion of young people entering higher education in each area. They range from quintile 1 for areas of the country with the lowest participation rates, to quintile 5 for areas with the highest.
By applying the Gini methodology to each university’s POLAR data, Martin shows how well institutions do in recruiting young people from across society. Each institution has a score between 0, which would represent even participation across all five POLAR quintiles, and 1, which would be complete inequality, with all students coming from a single POLAR group. The outcomes are eye opening.
A mixed picture?
The results provide a very different picture to traditional university rankings. The University of Hull comes top. This is because it takes an almost even number of undergraduates from each POLAR quintile. By contrast, the University of Cambridge comes bottom. This is, in part, because it has few students from POLAR quintile 1 and lots from quintile 5.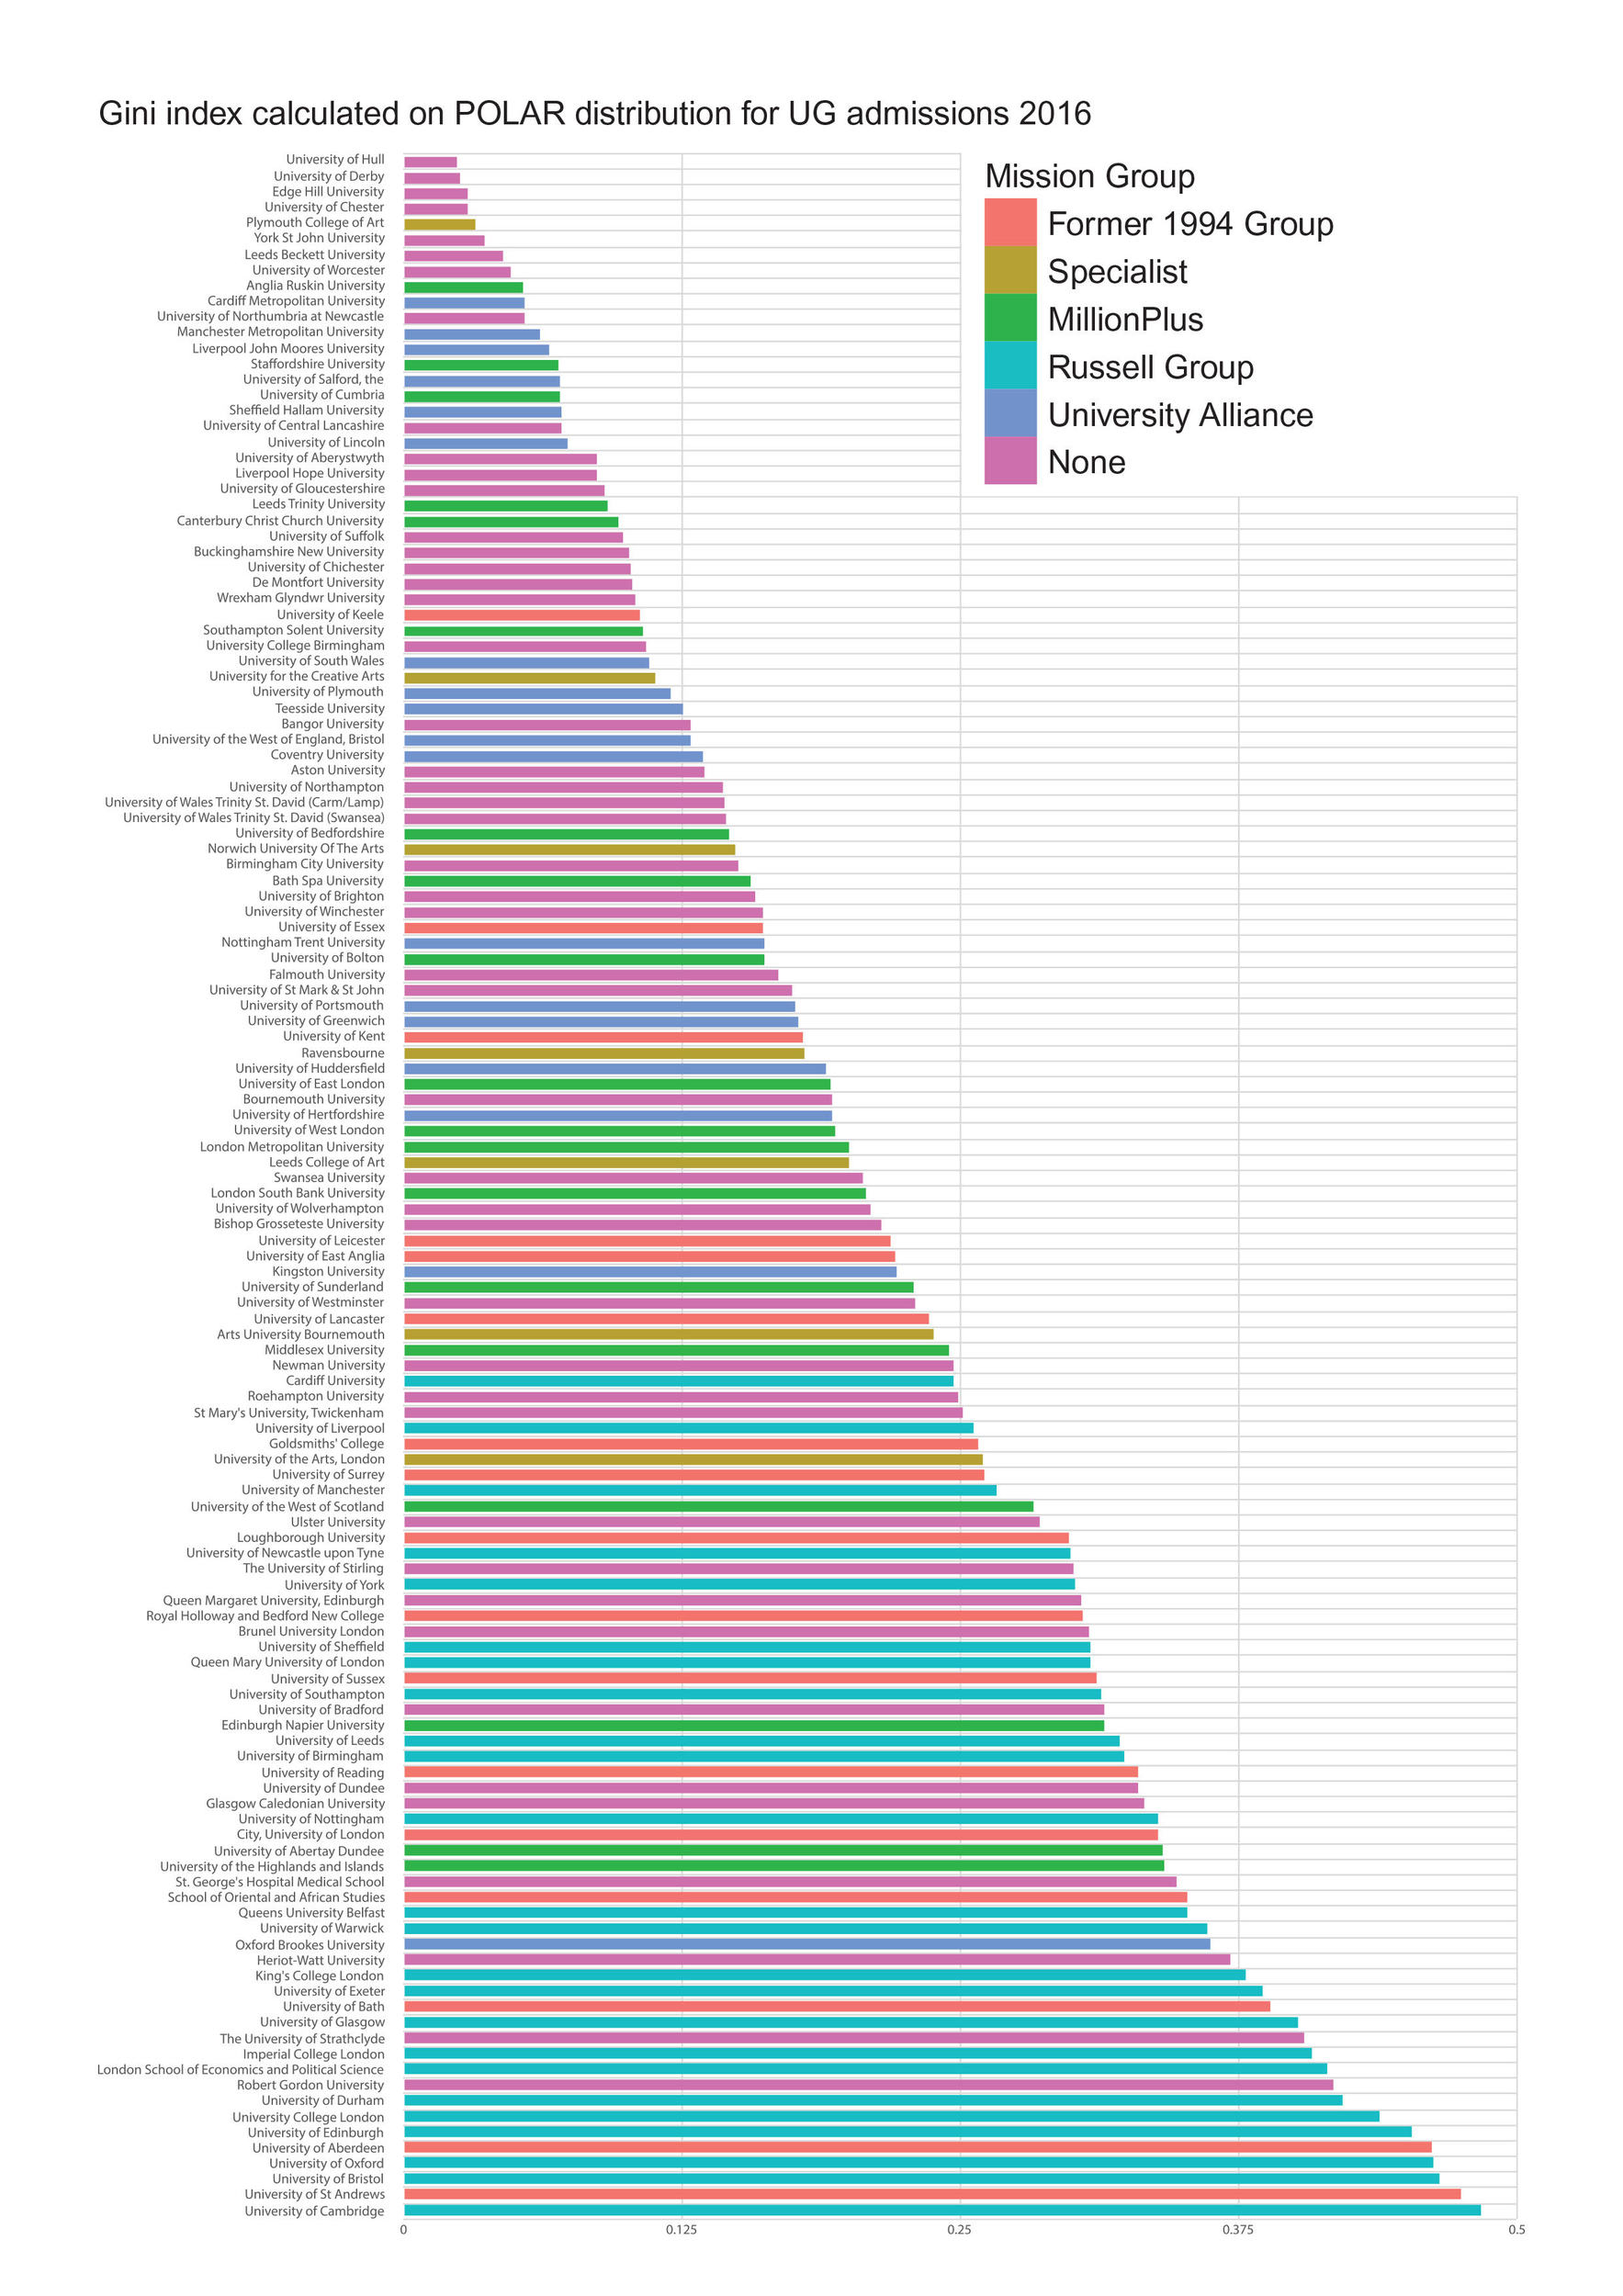
Source: HEPI Policy Note 6
Of the universities in the top 10, the majority are not in any of the main mission groups and they are mainly post-92 institutions. The top 10 also includes one specialist institution, Plymouth College of Art. Martin’s own institution – Anglia Ruskin University – sneaks in at number 9, just above Cardiff Metropolitan University and just behind the University of Worcester.
At the other end of the scale, seven of the institutions in the bottom 10 belong to the Russell Group, including Oxford and Cambridge. Four of the bottom 10 are in Scotland, also raising questions about how equitable student intake is North of the border.
Points of contention
Critics will, no doubt, point out that universities merely reflect the lack of equality in society as a whole. They may say universities cannot fix the problems of educational inequality that start long before applying to higher education. Or they might show how great strides have been made in widening participation in recent years.
All these points are valid, but the new measure should still force us all to ask if we are doing everything we can to ensure that universities are as diverse as they could be – especially when we know that people learn better when they learn alongside people that are different from them. In particular, this way of presenting the data should encourage us to ask, yet again, whether access spending is currently being used as effectively as it could be.
Martin openly admits that ranking universities’ participation rates by a single number has important limitations. First, it does not reveal everything as for each institution it provides just one figure. Second, institutions with a similar score may be unequal in different ways. Third, the measure does not reflect absolute levels of disparity between quintiles: the gap between participation in POLAR quintile 1 and POLAR quintile 5 could fall, but an individual university’s score would not change if the proportion of their students from each quintile stayed the same.
A step in the right direction?
Each institution will have their own reasons behind their score. But the fact remains that, if individual universities are to mirror the diversity of society more closely, then students from different backgrounds should be distributed more evenly across the sector.
There is also a strong case for continuing to reduce the disparities in access between quintiles 1 and 5. If we are to enable the best minds from all sections of society to access, participate and succeed in our world-class universities, then we will need to further increase student numbers in the years to come.