


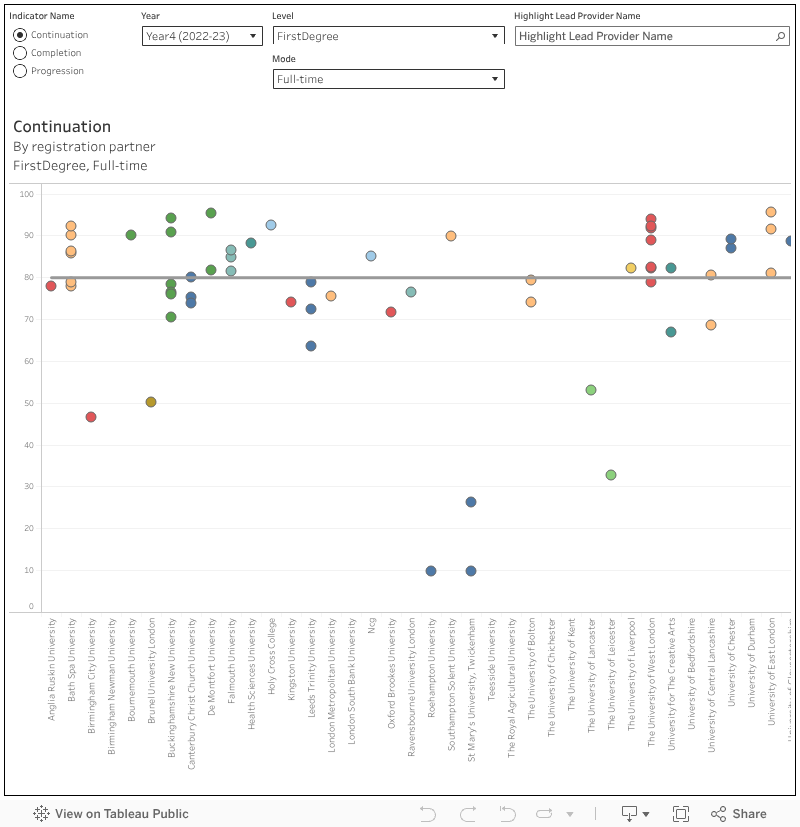
In 2022–23 there were around 260 full time first degree students, registered to a well-known provider and taught via a subcontractual arrangement, that had a continuation rate of just 9.8 per cent: so of those 260 students, just 25 or so actually continued on to their second year.
Whatever you think about franchising opening up higher education to new groups, or allowing established universities the flexibility to react to fast-changing demand or skills needs, none of that actually happens if more than 90 per cent of the registered population doesn’t continue with their course.
It’s because of issues like this that we (and others) have been badgering the Office for Students to produce outcomes data for students taught via subcontractual arrangements (franchises and partnerships) at a level of granularity that shows each individual subcontractual partner.
And finally, after a small pilot last year, we have the data.
Regulating subcontractual relationships
If anything it feels a little late – there are now two overlapping proposals on the table to regulate this end of the higher education marketplace:
- A Department of Education consultation suggests that every delivery partner that has more than 300 higher education students would need to register with the Office for Students (unless it is regulated elsewhere)
- And an Office for Students consultation suggests that every registering partner with more than 100 higher education students taught via subcontractual arrangements will be subject to a new condition of registration (E8)
Both sets of plans address, in their own way, the current reality that the only direct regulatory control available over students studying via these arrangements is via the quality assurance systems within the registering (lead) partners. This is an arrangement left over from previous quality regimes, where the nation spent time and money to assure itself that all providers had robust quality assurance systems that were being routinely followed.
In an age of dashboard-driven regulation, the fact that we have not been able to easily disaggregate the outcomes of subcontractual students has meant that it has not been possible to regulate this corner of the sector – we’ve seen rapid growth of this kind of provision under the Office for Students’ watch and oversight (to be frank) has just not been up to the job.
Data considerations
Incredibly, it wasn’t even the case that the regulator had good data but chose not to publish it. OfS has genuinely had to rethink this data collection in order to get reliable, credible, information – many institutions expressed concern about the quality of data they might be getting from their academic partners (which should have been a red flag, really).
So what we get is basically an extension of the B3 dashboards where students in the existing “partnership” population are assigned to one of an astonishing 681 partner providers alongside their lead provider. We’d assume that each of these specific populations has data across the three B3 (continuation, completion, progression) indicators – in practice many of these are suppressed for the usual OfS reasons of low student numbers and (in the case of progression) low Graduate Outcomes response rates.
Where we do get indicator values we also see benchmarks and the usual numeric thresholds – the former indicating what OfS might expect to see given the student population, the latter being the line beneath which the regulator might feel inclined to get stuck into some regulating.
One thing we can’t really do with the data – although we wanted to – is treat each subcontractual provider as if it was a main provider and derive an overall indicator for it. Because many subcontractual providers have relationships (and students) from numerous lead providers, we start to get to some reasonably sized institutions. In 2022-23 two providers– Global Banking School and the Elizabeth School London – appear to have more than 5,000 higher education students: GBS is around the same size as the University of Bradford, the Elizabeth School is comparable to Liverpool Hope University.
Size and shape
How big these providers are is a good place to start. We don’t actually get formal student numbers for these places – but we can derive a reasonable approximation from the denominator (population size) for one of the three indicators available. I tend to use continuation as it gives me the most recent (2022–23) year of data.
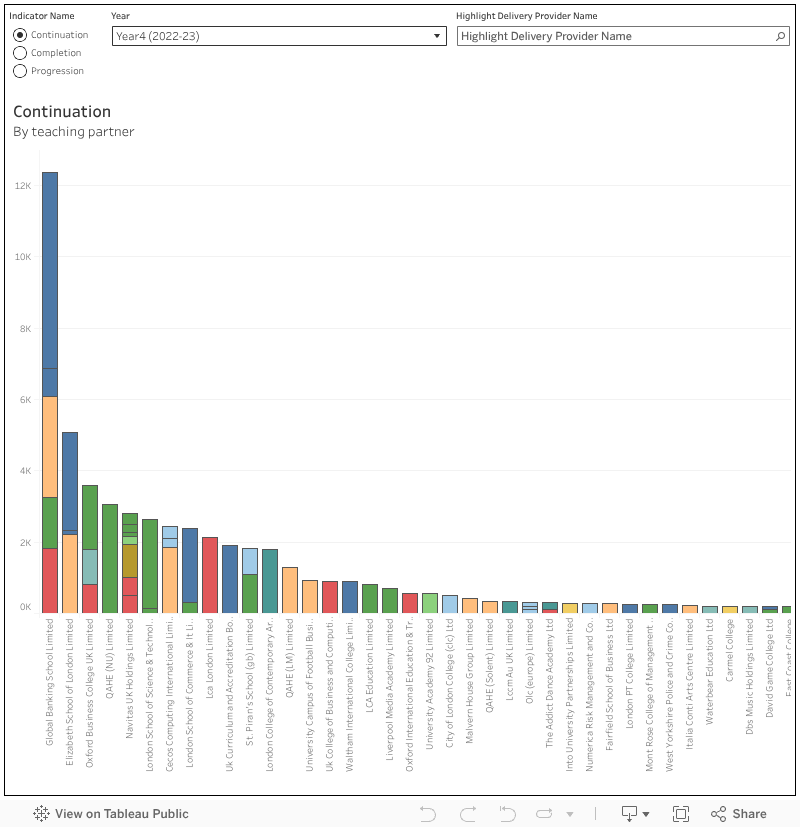
The charts showing numbers of students are based on the denominators (populations) for one of the three indicators – by default I use continuation as it is more likely to reflect recent (2022–23) numbers. Because both the OfS and DfE consultations talk about all HE students there are no filters for mode or level.
For each chart you can select a year of interest (I’ve chosen the most recent year by default) or the overall indicator (which, like on the main dashboards is synthetic over four years) If you change the indicator you may have to change the year. I’ve not included any indications of error – these are small numbers and the possible error is wide so any responsible regulator would have to do more investigating before stepping in to regulate.
Recall that the DfE proposal is that institutions with more than 300 higher education students would have to register with OfS if they are not regulated in another way (as a school, FE college, or local authority, for instance). I make that 26 with more than 300 students, a small number of which appear to be regulated as an FE college.
You can also see which lead providers are involved with each delivery partner – there are several that have relationships with multiple universities. It is instructive to compare outcomes data within a delivery partner – clearly differences in quality assurance and course design do have an impact, suggesting that the “naive university hoodwinked by low quality franchise partner” narrative, if it has any truth to it at all, is not universally true.
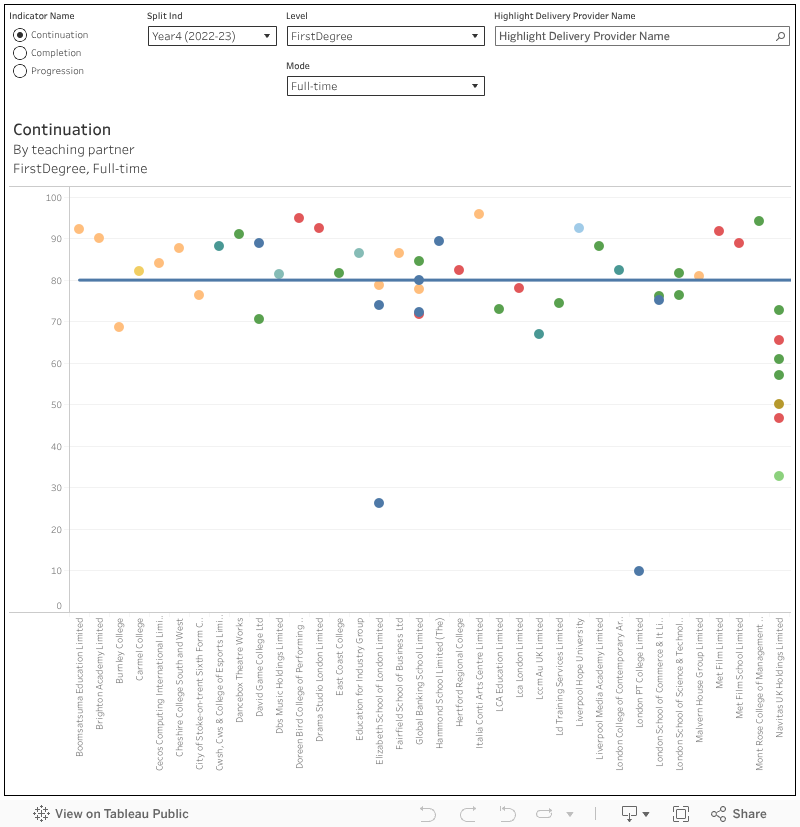
The charts showing the actual outcomes are filtered by mode and level as you would expect. Note that not all levels are available for each mode of study.
This chart brings in filters for level and mode – there are different indicators, benchmarks, and thresholds for each combination of these factors. Again, there is data suppression (low numbers and responses) going on, so you won’t see every single aspect of every single relationship in detail.
That said, what we do see is a very mixed bag. Quite a lot of provision sits below the threshold line, though there are also some examples of very good outcomes – often at smaller, specialist, creative arts colleges.
Registration
I’ve flipped those two charts to allow us to look at the exposure of registered universities to this part of the market. The overall sizes in recent years at some providers won’t be of any surprise to those who have been following this story – a handful of universities have grown substantially as a result of a strategic decision to engage in multiple academic partnerships.
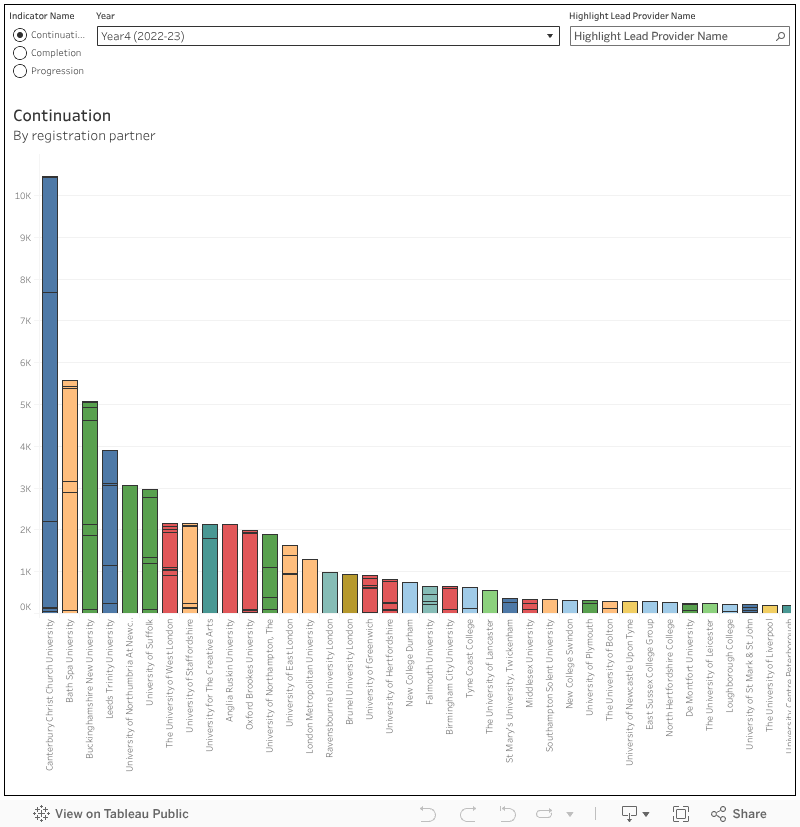
Canterbury Christ Church University, Bath Spa University, Buckinghamshire New University, and Leeds Trinity University have always been the big four in this market. But of the 84 registered providers engaged in partnerships, I count 44 that met the 100 student threshold for the new condition of registration B3 had it applied in 2022–23.
Looking at the outcomes measures suggests that what is happening across multiple partners is not offering wide variation in performance, although there will always be teaching provider, subject, and population variation. It is striking that places with a lot of different partners tend to get reasonable results – lower indicator values tend to be found at places running just one or two relationships, so it does feel like some work on improving external quality assurance and validation would be of some help.
To be clear, this is data from a few years ago (the most recent available data is from 2022–23 for continuation, 2019–20 for completion, and 2022–23 for progression). It is very likely that providers will have identified and addressed issues (or ended relationships) using internal data long before either we or the Office for Students got a glimpse of what was going on.
A starting point
There is clearly a lot more that can be done with what we have – and I can promise this is a dataset that Wonkhe is keen to return to. It gets us closer to understanding where problems may lie – the next phase would be to identify patterns and commonalities to help us get closer to the interventions that will help.
Subcontractual arrangements have a long and proud history in UK higher education – just about every English provider started off in a subcontractual arrangement with the University of London, and it remains the most common way to enter the sector. A glance across the data makes it clear that there are real problems in some areas – but it is something other than the fact of a subcontractual arrangement that is causing them.
Do you like higher education data as much as I do? Of course you do! So you are absolutely going to want to grab a ticket for The Festival of Higher Education on 11-12 November – it’s Team Wonkhe’s flagship event and data discussion is actively encouraged.
As Global Banking School is on the OfS register, it is included in the Size and Shape dashboard. This tells us that it had more than 26,000 full-time undergraduate students in 2022/23 – 23,800 of whom are taught under franchising arrangements – making it one of the biggest providers of full-time undergraduate teaching in the country. It’s more than three times bigger than the University of Bradford
Indeed, it is enormous. The figure above relates only to franchised provision from OfS registered providers.
It’s been a very long time coming although I am not clear why it needed a new collection as the good folk at Jisc have been collecting these data for a great many years, the only concern was data quality and timeliness.
Very poor that they do not appear to have provided aggregated data for each teaching provider as the aggregate data would provide a much stronger signal and provided greater transparency for prospective students. This should really just be part of the normal student outcomes dashboard.
Thanks Richard – I’ve tweaked the wording to be a bit clearer on the collection point.
“It is instructive to compare outcomes data within a delivery partner – clearly differences in quality assurance and course design do have an impact, suggesting that the “naive university hoodwinked by low quality franchise partner” narrative, if it has any truth to it at all, is not universally true.” I agree that that narrative is a misleading one, but I also don’t think it’s fair to assume that if a delivery partner has different outcomes with different awarding partners it must reflect differences in the awarding partners’ QA. It may well be that the same delivery partners delivers courses with… Read more »
We know foundation year provision is part of the franchising issue and we know from the B3 data dashboard, where it is available as a split-indicator, that foundation year provision is an available data field – but it isn’t available for this data. Why? It was highlighted in WONKHE back in 2024, that reductions in foundation year fees were very likely an attempt to reduce the profitability of franchised provision and put an end to its uncontrolled growth. It was also pointed out that such an approach would not work and likely cause greater damage to high-quality in-university foundation year… Read more »