We’ve not had modellable financial scenarios based on recruitment in the OfS annual financial sustainability report before.
Though the projections are scary, this is a welcome development in transparency. OfS use modelling like this to help develop the advice they offer providers, as well as to shape interventions where they have concerns.
The trouble is, the information we have is presented at whole sector level – something that belies what I am led to understand are quite sophisticated underpinnings at provider level
So I thought I’d help.
What’s on the cards
The four scenarios OfS have developed are:
1. No growth: For each provider, all undergraduate and postgraduate entrants remain at the level forecast for 2023-24 in its 2023 AFR data returns.
2. Minor reduction in student numbers: All providers will see no growth in entrants beyond 2023-24, and then a further reduction in their entrants at a relatively modest level overall.
3. Larger reduction in student numbers: All providers will see no growth in entrants beyond 2023-24, and then a further reduction in their entrants, at a more significant level than the reductions modelled in the ‘minor student’ model.
4. Significant reduction in international student numbers: All providers will see nogrowth in UK undergraduate and postgraduate entrants beyond 2023-24. There will be no growth in international entrants in 2023-24, followed by significant reductions in 2024-25 and smaller reductions in the years thereafter.
These scenarios apply in different ways to four groups of student fee income:
- Home UG
- International UG
- Home PG
- International PG
And are offered at four tariff levels (High, Medium, Low) for basically three years (2023-24 – this year, 2024-25, and 2025-26. The models are cumulative, so it would be possible to do an extrapolation for future years if you wanted.
I should note that OfS says:
Financial modelling and scenario analysis are based on multiple assumptions and are therefore inherently unreliable, on their own, in determining risk for individual providers; but they are helpful in giving an indication of the possible impact of a scenario at a sector level
That’s a little bit odd, as OfS do use financial modelling and scenarios with individual provider data. The caveats here are sensible – different providers will act in different ways within different markets, or in restructuring or rethinking their own offer.
There’s not really any modelling of these mitigations, though OfS also assume that 20 per cent of the fee income lost with reduced recruitment will be mitigated by cost savings. Trouble is, those cost savings are largely based around employing less staff – which, alongside causing huge problems for those who currently work in higher education, reduces the capacity of a provider to do pretty much anything.
What I’ve done
Because most of the data is in, or nearly in, the public domain I’ve been able to model each of these scenarios for certain providers. Here are my caveats:
- I’ve used financial data for 2022-23 as a base for fee income as follows. My undergraduate series uses full- and part-time undergraduate fee income only, My postgraduate series uses full- and part-time postgraduate taught and postgraduate research fee income. Home students include all UK fee income, while international students include EU and non-EU fees income. This omits PGCE income (DfE will eventually have to do something about low teacher training recruitment rates), and any other fees providers may be able to raise.
- I’ve used tariff data from the DfE widening participation collection. As far as I can see this is the latest available public data with tariff groups (I’d like to gently encourage OfS, or HESA, or DfE, or UCAS, or – frankly – anyone to publish more usable versions of this information as official statistics). Where data doesn’t exist, I’ve assumed providers have a low tariff. Tariff groups are a bit weird anyway (course level variation is often greater than variation by providers) but we are where we are.
- I’ve not attempted to model any cost savings. As OfS tells us, these are based on provider decisions, and my guess is that it makes more sense to present the losses to help providers understand the mitigations needed.
- I’ve not attempted to model beyond 2025-26.
- I’ve included Scottish and Welsh providers, because why not? Clearly the OfS models apply for England only, but I felt there’d be interest in other parts of the UK
- I’ve not compared to provider income overall, or to expenditure, though this would be straightforward to do on a data level. Providers will have a better understanding of the interdependencies here and I don’t want to layer in even more assumptions.
What I made and why
Here’s what I came up with:
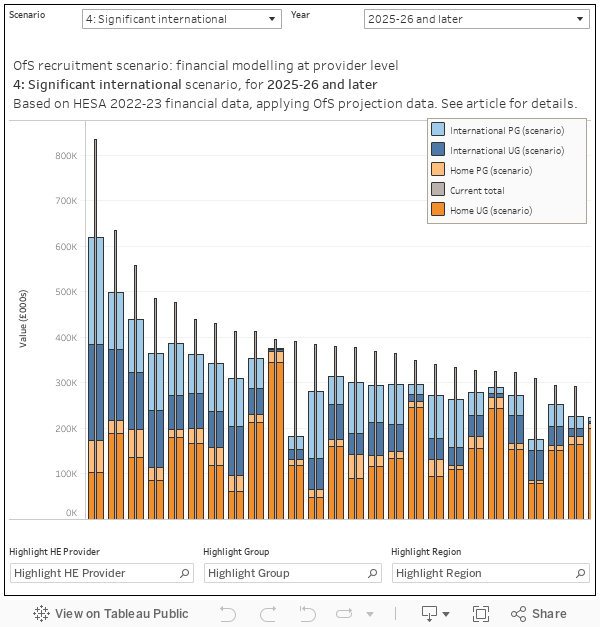
The Office for Students does not endorse this visualisation.
I hesitated over putting this together – there is obvious prurient interest in just how badly the sector, and players with in it, could do in coming years and I don’t want to encourage further worry or concern from what are extrapolations of things that were based on numerous assumptions to start with.
But I think that these are useful number – for planning, for lobbying, and for making the case that the sector is in a uniquely tight financial position right now. Without careful and concerted action, lasting damage could be done to a world-class system of higher education.
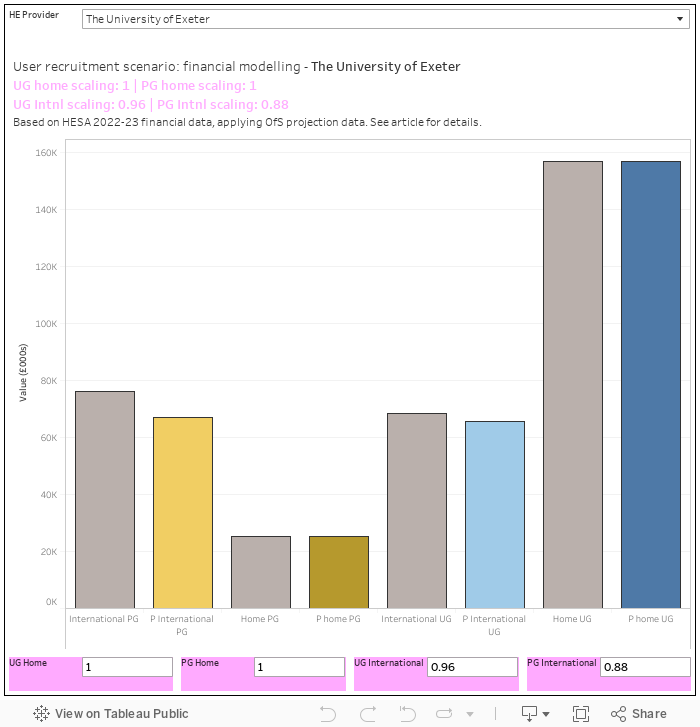
If you aren’t a fan of the OfS projections, I’ve built a dashboard that allows you to use your own. Just input a scaling parameter (eg if you think you’ll do 96 per cent of your current income for a given fee group use 0.96) in to each of the pink boxes at the bottom and you can compare with current (2022-23 income). This is a single provider view because clearly every provider is going to be affected in different ways.