


In its latest election announcement, the Conservative party appears to want to close 13 per cent of the “poorest performing” undergraduate courses in England’s higher education system.
It says it will be dumping the “£910m savings” (after accounting for behavioral changes) into 100,000 new apprenticeships.
Former apprentice Gillian Keegan is on hand to say:
There are no limits to where an apprenticeship can take you. Mine took me from a car factory in Kirkby to the Cabinet.
Alas there was no space for her to reflect on the impact of her undergraduate degree in business from Liverpool John Moores University, or her MSc from London Business School.
It’s not the first time that the party has announced a action on poor quality courses. We’ve heard variations on this idea this time last year, in 2022, in 2021, 2020, 2019, 2018.
Numbers round
The spin is that this policy represents a direct replacement – a straight swap – of problematic degrees with marvelous apprenticeships. Forget Augar’s “other 50 per cent” – the idea is to swap some of the existing 50 per cent into other routes.
The trouble is that 13 per cent of the current undergraduate population is about 265,500.
The party reckons (there’s not really another word here) that 50 per cent of this displaced cohort (132,750) will do an apprenticeship instead, 25 per cent (66,375) will go straight into employment, and the remainder (another 66,375) will take a “better, high quality, course”.
Perhaps some of them will take a maths course, where they might learn that if you are creating 100,000 new apprenticeships, then you will be 32,750 short.
Meanwhile, we also need 66,375 new home student spaces on existing courses – courses that will somehow remain high quality with extra students that cost more than the current fee cap (£9,250) to educate.
And is £1 out of every £4 borrowed by students never paid back, as the party contests to justify this fresh push on “low value” courses?
It was true a while ago (indeed, it was a deliberate design feature of the funding system), but after their own changes to repayments (40 rather than 30 years repayment, a lower repayment threshold, and the removal of real interest rates) the current cohort will repay as graduates £3.48 out of every £4 – and 79 per cent (according to the Institute for Fiscal Studies) will repay their loans in full.
(Estimates on the RAB charge vary. London Economics reckon that after the recent changes, the government is chipping in just 4p in the pound in subsidy. That would generate nothing like the savings the Conservatives are trying to divert here)
Begging the question
How do we figure out which courses are the bad ones? Well, I’ve spent a good few years trying to track them down in various bits of sector data, with vanishingly little success. That’s not to say there are not bad courses out there – the sector is huge, variable, and ever-changing so it stands to reason that there are some courses that some of the time are not as good as they could be.
These do generally get tracked down by accreditors and professional bodies, by provider internal quality assurance, by student feedback, and by notifications sent to the regulator. And they get improved – or closed – largely without ministerial interventions.
The Conservative answer is to use “existing and well-established quality controls known as B3” (that’s continuation, completion, and progression to a “good” graduate destination) along with (“in future”) earnings. None of these datasets are routinely available at course level, of course – but I’ve sat through enough of these crackdowns over the last four years to accept that what is actually meant is subject areas within a provider.
Each of these metrics is a lagging indicator. We don’t know how many students continue on their course until midway through the course – we don’t know how many students finish their course until the end of it.
And we don’t know what graduates end up doing until at least a year after the end of the course – with sensible salary data generally perceived as emerging after about three to five years later.
The lion sleeps tonight
We got a bunch of what represents the state of the art for salary data, the Longitudinal Educational Outcomes (LEO) dataset, only last week. It covers graduate earnings in the 2020-21 tax year, and the Department of Education is careful to note that we were in the middle of a pandemic at that point so things were a bit odd.
There have been rumblings of a newer and fancier salary metric (as Jim picked up last week) that can address some of the Social Mobility Commission (SMC) critiques of the LEO approach, and indeed some of mine.
To give Kernohan’s Law its annual outing:
You can’t meaningfully examine output metrics without controlling for sex, background characteristics, subject, provider, and region of residence, and any attempt to do this makes for unusably small sample sizes.
To which we could add a codicil: even if an output metric that satisfied that law existed, the findings would be constrained by exogenous impacts on graduate recruitment, like pandemics.
If anyone can square this irregular dodecahedron, it’s the Institute for Fiscal Studies. And that’s who DfE have turned to, with a specific request to abandon the benchmark-free orthodoxy that has marred social mobility in recent years. LEO 2.0 will actively control for the impact of disadvantaged backgrounds.
LEO in context
Meanwhile this is what LEO classic looks like:
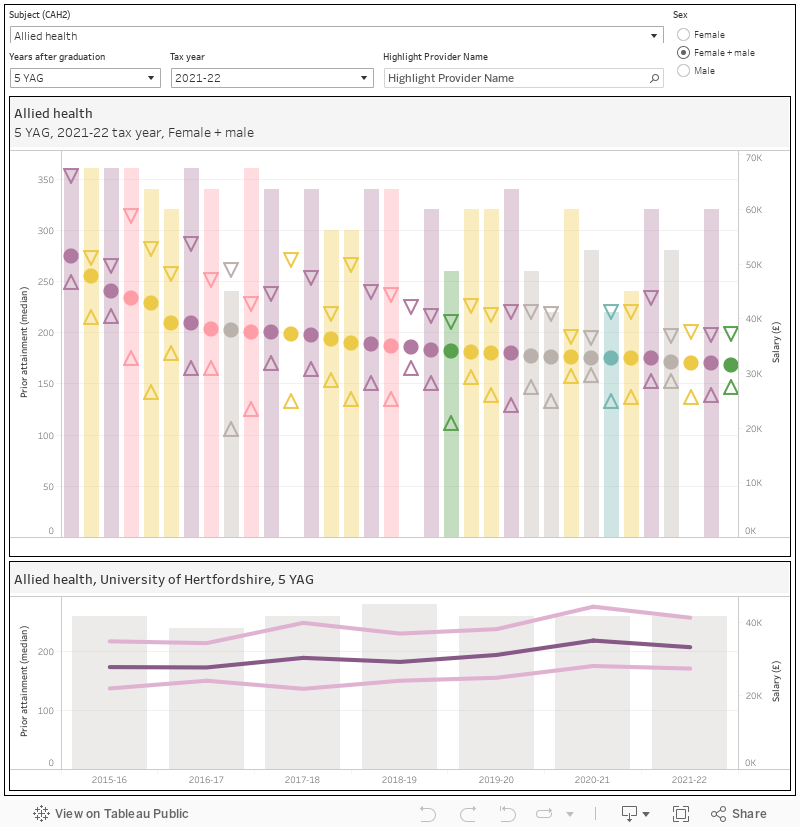
You can filter at the top by subject, years after graduation, tax year (2021-22 is the latest, but you can go back to 2015-16), and sex – and use the highlighter to find a provider of interest. If you mouse over a blob or bar at the top, you can see a relevant time series for the provider, subject, sex, and number of years after graduation in question. The pale bars are the median prior attainment of the graduates in question, which illustrates another issue – salary is inversely correlated with prior advantage (do look up business at Liverpool John Moores University, by the way).
That’s an important point and one worth hanging on to. As a way of illustrating this issue I’ve plotted the proportion from POLAR quintile 1 on the vertical axis, and the median UCAS points on the horizontal axis. The size of the dots corresponds to the number of UK graduates, and the intensity of their purpleness corresponds to the median salary (more purple equals more money. (For reasons best known to itself, DfE has not published prior attainment data for graduates of Scottish, Welsh, and Northern Irish providers – I’ve left these on the axis.)
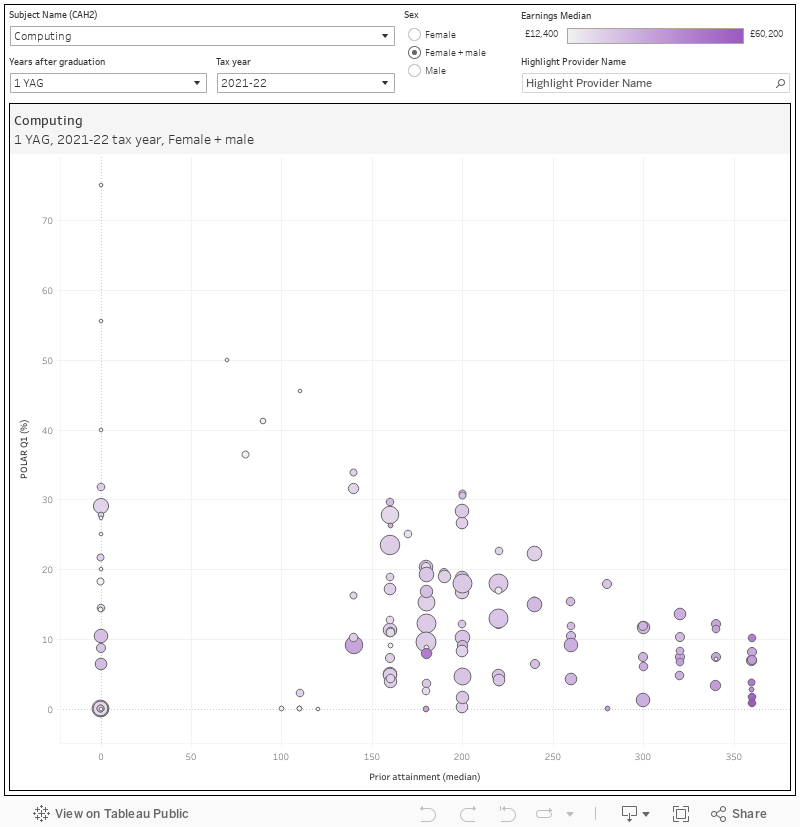
Each subject area shows the familiar wedge-shaped plot (though it is less noticeable with healthcare related subjects). People with higher pre-18 academic achievement go to one group of universities, people from POLAR quintile 1 backgrounds go to another, and – typically – those who go to the first group tend to earn more money. We don’t get to add in the region of employment with these statistics, but it is fair to guess that most of the top earners move to London too.
In other words, it is likely that something other than the choice of provider is causing much of the salary disparities that we see on the more traditional LEO chart above.
Are apprenticeships a better bet?
Thing is, there’s a LEO for apprentices too. And it is an awkward read for those who claim that apprenticeships lead to a higher salary.
The tale that is not often told when politicians talk about apprenticeships is that much of the recent growth has been among those already in employment. The data that does exist suggests that average earnings among those who have completed higher apprenticeships are high, but this is skewed by a fair number of senior managers who were already earning well before they started an apprenticeship in, er, management.
The most recent iterations of this data add some more data points, but the point that the big money is in management returns – and earnings among the kind of thing that less academically-inclined 18 year olds might do are a fair but lower – still holds. That’s not to say that apprenticeships are a bad idea – far from it – but they are not the panacea that is often painted.
Election fever
Nobody was really expecting higher education to play a role in this election. What we have here is a repeat of something that has been announced and re-announced on a regular basis, with little impact other than a flurry of headlines.
Vocational and academic routes are not competing routes to be played off one against the other, there’s no easy way to spot and cull “poor quality courses” in any setting (other than direct student engagement or proper quality assurance), and any successful economy needs a range of post-18 destinations to provide the skilled workers that global competition dictates we need.
Because there’s no sensible metric that can identify any poor quality courses that may be happening right now, there’s no way to know if we’d be losing the chance to train young people in the skills we need in future at good local universities. Or via the (strangely absent from this announcement) flagship lifelong learning entitlement.
And there is no way of knowing what the quality of any course would be like in a world where it was properly funded and resourced.
Well said, dk
Good stuff. There are no public funding savings to be directed to apprenticeships simply by England’s universities cancelling courses. But it’s an even more “batshit crazy” policy when you factor in that students in England can currently study on courses regulated elsewhere in the UK, especially in Scotland but also in Cymru-Wales and N.Ireland. If you stop students domiciled in England going on specific courses in England, the policy would have to be extended to cover courses in Scotland etc – a “devolution power grab” that actually also overturns the Acts of Union 1707!
The reality is that there are ‘low quality’ courses out and there and anyone working in HE knows this. The issue is how you measure it in realistic and timely ways. If HESA had not stopped collecting module outcome information then it could have been done by :
1) Number of full time students still registered after the final SLC census point who fail all or most of their modules.
2) Secondary measure would be number of those students in 1 who are re-enrolled and still fail all or most of their modules in their second year.
3) Require SLC attendance confirmation points 2 & 3 to be positive confirmations, with institutions required to have evidence to show students are still engaged with their studies, (by the second attendance point most students should have submitted some work and most institutions have some form of attendance monitoring in place).
Chartered accountancy exams have a high failure rate; it’s not necessarily an indication of ‘low quality’, any more than high attainment can be causally attributed to ‘grade inflation’.
“In other words, it is likely that something other than the choice of provider is causing much of the salary disparities that we see on the more traditional LEO chart above.”
This may be true, but it does not answer the concern that courses which do little or nothing to enhance the employability of students may be exploiting those students by saddling them with large debts for minimal benefits.
Nice to see someone else who questions the reality, especially saddling students with debts for little benefit, to them. Of course some are now seeing Bliar’s 50% and subsequent commodification for what it is, a means to saddle ‘working (and middle) class’ students with debt, so they cannot afford to take industrial action, let alone strike, once employed, Maggie would have been impressed.
Little know fact: higher education participation hardly changed under Blair and did not increase much under Gordon Brown either due to Labour imposing strict student number caps.
It is more accurate to say “George Osborne’s 50%” as it is his transformative removal of the student number cap that has led to the huge increase in participation. Quite possibly the biggest achievement of his – and the Conservative Party’s – time in office
What is a university course for?
If you’re not sure what the answer to that is you’ve no chance of deciding what a poor course is no matter what analysis you throw at it.
For bonus points: what will a university course be for in ten years’ time?
Mickey Mouse has been around for a long time.
He was important when, in the 1980s, the polytechnics were moving towards university status (under the rigorous CNAA) and this made some folk uncomfortable – so we heard a lot about Mickey, from the established universities and their chums in the ministry. We also heard a lot about the dreaded “pic n’ mix” (the educational sweetshop where you could buy your Mickey Mouse degree).
David Willetts gave a speech at the CBI in 2009 in which he said:
“People complain about Mickey Mouse courses without always explaining what they mean. Often, it is used to refer to vocational courses – presumably on the grounds that these are not for university and are what the old polytechnics were for. Universities have always excelled in vocational training, like Law and Medicine. And, today, most advanced countries use the term university to cover a range of different types of institution. That includes universities focussing on vocational courses. We have a long history of agonising over this. The Victorians worried whether Law was a university course……”
Spot on. Willets missed out that as well as law and medicine, the ancient universities excelled in vocational training for that most useless of parasitic professions, the priesthood.
Maybe that was advanced learning during medieval times, but should it still have permeated the system and been taxpayer funded throughout the 20th century and into the 21st without being called into question?
There was a certain university vice chancellor of a former polytechnic in the 1990s who pointed out that the then QR (‘Quality Research’) public funding in England, because it allocated funds purely based on historic volume of staff/doctoral students and ‘quality’ (as rated by their subject mates in the Reseach Assessment Exercise), resulted in MORE money being allocated to research in Theology than research in Social Work.
He pointed out that maybe rational people ought not to believe that the problems of society would be more likely to be solved by supernatural intervention than genuine social research …
[It didn’t work anyway, as 30 years later I now live in a country (Scotland) where a majority officially have no religious beliefs. ]
Mickey Mouse is a fantasy character and that seems appropriate to describe the theology and priest training disciplines, but I doubt thats what the Tories intended to target.