


If this year’s national student survey doesn’t show the impact of Covid-19, or of industrial action, then does it show us anything at all?
There was around a month and a bit (depending on how you count it) of data from after the scale of the pandemic became clear in the 2020 NSS – and, if you listened to what various smaller surveys were telling you, students were not happy. Barely a BBC radio phone-in went by without us hearing from students who had been effectively abandoned by their lecturers and were receiving no teaching at all.
A few months earlier, the “You and Yours” and “Jeremy Vine” lines were busy with students complaining about teaching being cancelled due to industrial action. Certainly, the idea that this year’s cohort of students have had a poor time of it is both everywhere, and largely inarguable. But not in NSS.
Business as usual
So why does this year’s NSS look so much like any other year? To the extent that none less than Richard Puttock (OfS’ Director of Data, Foresight, and Analysis) popped up to assure us that:
When comparing the 2019 results to 2020, there is a small negative shift in the agreement rate for some questions. However, similar shifts have also been observed in previous years.”
It is, shall we say, unusual for the OfS to be assuring us that year on year changes are inside the range of what would be considered normal between any two other years. We hear that 21 per cent of responses were taken after 11 March, and though this represents a slowing in the final period compared to 2019 it is inline with 2018 – a year widely regarded as pandemic free. Apart from around 3,100 respondents (1.6 per cent of all those who made written comments) noting that Covid-19 was a thing in some way, and a slightly greater proportion of responses taken by phone in the final month, you’d never know there was a pandemic at all.
The decision of the regulator to take such great pains to assure us that there was very little to see (there’s a nicely methodology heavy report, and even the raw power of Tableau comes into play – though maybe some of the data could have been published) means that we have to wonder: if the NSS can’t spot a global pandemic happening then why should we expect it to pick up that Dr McVitty in the Faculty of Politics is getting better at giving feedback?
I-spy pandemics and picket lines
As a quick test of my own, I would probably have expected to see that the strike and the pandemic would have combined to see more providers than usual performing under benchmark on the Academic Support question scale (Scale 4). These are the hygiene factors of higher education – organisation, timetables, communication of changes.
I ended up building a whole dashboard that lets you look at the range of performance against benchmarks for all questions. Scroll along on the left to go through all the questions, mouse over a dot to see details for the provider it represents, click on the dot to see a graph on the right looking at all questions for that provider. The usual region and subject filters (by default I’ve filtered out FECs and Alternative providers, you can easily add them back in if you need more dots) and there’s a highlighter for provider name too.
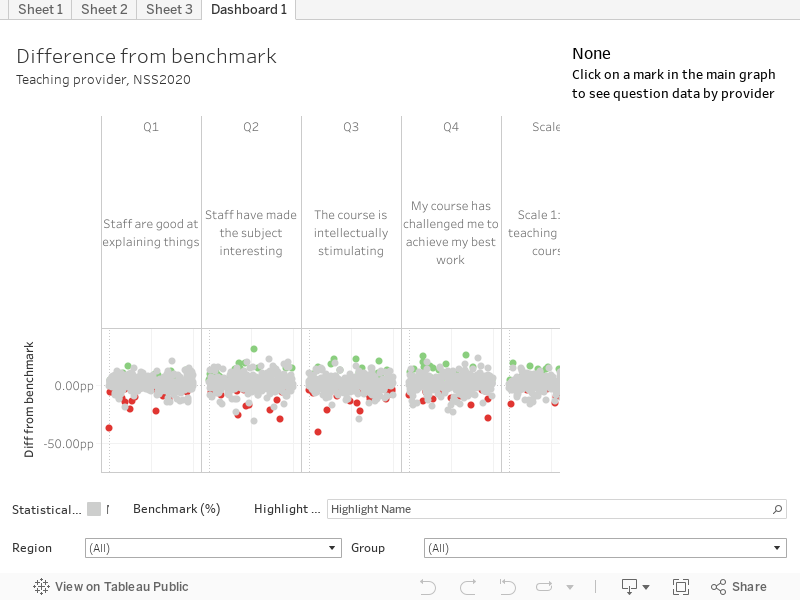
[Full screen] (strongly recommended!)
The range of answers here are nearly always more raggedy than most other questions, but looking at the scale as a whole there’s not much variation from the benchmark. And the benchmark did not take into account pandemics or strikes (it uses subject, sex, age, disability, and mode of study). Access to learning resources highlights two disappointing performances by two arts colleges – one of which participated in industrial action – but there are other arts colleges and sites of picket lines that do rather well on the same questions.
NSS like it was meant to be used
As I keep telling people, for all our pretence that NSS is some kind of a key performance indicator it was actually designed to be used formatively within institutions to improve the student experience. I’ve plotted a look across the most detailed (CAH3) subject level to give us a look of the kind of thing that course and module teams should be poring over today.
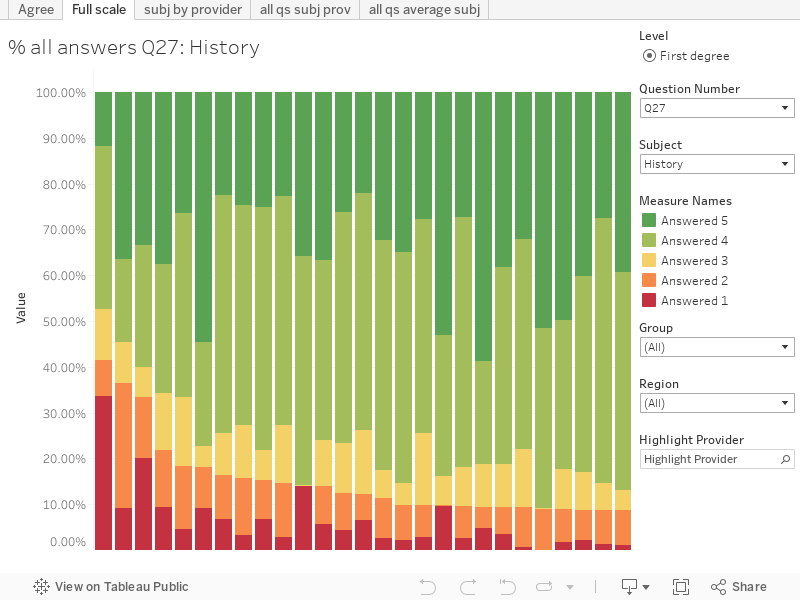
Here we can use subject and question filters to look at the experiences of particular groups of students and comparators across the sector, other views show us all subjects by provider, all questions by provider with a subject filter, and all questions for the whole sector with a subject filter. Here we can see, for example, that art students are more likely to be negatively exercised by Q15 (“The course is well organised and running smoothly”) than anything else, whereas sociology students tend to be more likely to complain on Q21 (“I feel part of a community of staff and students”) and Q25 (“It is clear how students’ feedback has been acted on”).
It will be different in different departments at different providers, which is kind of the point – the NSS points to issues that may not have been picked up in course questionnaires or feedback sessions, so you can fix them for next year.
Everything is cake
I bring this up because I want to advance what I think may be a controversial thesis – students are using the NSS as it was designed to be used. They are feeding back on particular aspects of their course that future cohorts would benefit from seeing repaired. Old fashioned altruism, in other words. Not what you might expect in a customer led system, but hear me out.
We see NSS used as a kind of league table marker – which providers are best at keeping their customers satisfied, if you will. It turns up in TEF in a similar way. And there are annual concern tournaments about providers buying students cakes to engender positive feedback – if the baked goods are focused on getting students to complete the survey so it can be used to improve courses for others it all feels a bit nicer, doesn’t it?
On this measure, you wouldn’t really expect the pandemic or industrial action to turn up – these are things that are almost entirely out of university hands (though I would cautiously suggest – one for the SMT here – that if staff terms and conditions were improved there might be less strikes). There’s not much in terms of designing and planning teaching that could be done to prevent stuff like this.
The NSS website sternly advises that results:
Are made available through the Discover Uni website which is designed to help prospective students make the important decision of where and what to study in higher education”
But goes on to add:
These results are also used by universities/colleges themselves to identify what is going well, where improvements can be made and to enhance the overall learning experience for current and future students”
Two appeals to student altruism – one points to the potential for tangible improvements and the other requires a magical belief in data-driven market forces in HE.
A word from the regulator
An OfS spokesperson told me:
The National Student Survey invites students to reflect on their experience in higher education as a whole and many will have responded on that basis. While our analysis shows that there was not a significant impact on the survey due to the pandemic, students did for example raise issues relating to the pandemic in their written responses and we would expect universities to consider these responses closely. The survey also highlights differences in satisfaction between courses and different universities and colleges. This will be of value to providers for focusing improvements and for informing prospective students.
“Moreover, the survey has had a tangible impact in recent years. Satisfaction with assessment and feedback has improved markedly since the survey began and universities have responded to specific feedback in practical ways such as extending library opening times, creating more spaces for group work, and arranging forums for staff to student engagement.”
I think we can see which model of change wins out.
I am of the opinion that the NSS is only of use in evaluating one year in any one university in isolation. How can we expect students that largely have experience of one final year in one university to produce data that can be used to compare universities and courses. If I only bought bread once in my life then my opinion on the shop and the loaf would be of little value to other shops that sold different kinds of bread from different sizes and types of businesses. Given that any potential applicant using the NSS to compare courses is unlikely to experience the final year of a course for another 4 or 5 years then I really don’t see how it can be a reliable guide for applicants’ course level decisions either. The real benefit of the NSS is that providers are prone to worry about league tables ( and TEF?) so do take the results seriously and use the data internally to make year-on-year improvements. So rather perversely using the data in the wrong way makes the whole exercise valuable for the students.
“I would probably have expected to see that the strike and the pandemic would have combined to see more providers than usual performing under benchmark on the Academic Support question scale (Scale 4). These are the hygiene factors of higher education – organisation, timetables, communication of changes”
If you mean
Q15. The course is well organised and running smoothly.
Q16. The timetable works efficiently for me.
Q17 17. Any changes in the course or teaching have been communicated effectively.
…these actually form the Organisation & Management section, not Academic Support.