


One notable feature of the transition between TEF year 2 and TEF year 3 has been the commitment from the Department for Education (DfE) to improving and modifying the process.
Despite the general welcome for the year 2 results, there are clearly ways (in the eyes of everyone from ministers down) in which the results could better reflect the performance of the sector.
That incredible machine again
One of the most eye-catching interventions since TEF2 has been the downgrading of National Student Survey (NSS) data in the calculation of the initial hypothesis. For TEF3, the three NSS-derived criteria (on “The Teaching On My Course”, “Assessment and Feedback” and “Academic Support”) are weighted at 0.5, with the three other criteria (skilled and highly skilled employment derived from the Destination of Leavers from HE (DLHE) survey, and non-continuation from the HESA Student dataset) remaining at 1.0.
These six criteria are used to construct an initial hypothesis, which is then tested against other sources (including split metrics, supplementary metrics, contextual information, and the institutional statement) to produce the final award level of gold, silver or bronze.
In the initial hypothesis stage of TEF2:
- institutions with 3 or more positive flags and no negative flags were given a gold
- any institution with 2 or more negative flags was given a bronze
- and all the others were given a silver
But for the initial hypothesis stage of TEF3:
- institutions with 2.5 or more positive flags and no negative flags were given a gold
- any institution with 1.5 or more negative flags was given a bronze
- and all the others were given a silver
Alternate reality
We’ve used the new rules and applied them to the TEF2 data to create alternative initial hypotheses. These results do not represent what would have happened had institutions entered TEF3 – you can see it more of an alternate-universe TEF2.
We’ve no way of modelling the latter parts of the process (the role of the assessors and panel) – for these purposes, that is essentially a black box. So I’ve assumed that the black box would act in the same way with the new data (that an institution that had their award raised – or lowered – during this process would see the same result). There *have* been some suggestions that the raising/lowering after the initial hypothesis could apply to particular flags – we don’t know that for sure so we’ve not modelled it here.
So here – in the famous words of Jim Bowen from Bullseye – is what you could have won:
I’ve got three different visualisations on three different tabs. The first shows the overall split between bronze, silver and gold awards under the old TEF2 rules and the new TEF3 ones. There are fewer gold awards overall, and slightly more bronzes. There are exactly the same number of silver awards. So the general movement has been downwards – gold to silver, and silver to bronze.
The second tab shows the imputed TEF awards (TEF3 rules) as colours, sorted into columns showing the actual TEF2 awards. By default I’ve shown only the institutions that have a change of award between the two (you can use the “difference” control to adjust this).
Had TEF2 been run under TEF3 rules, Bristol, UCL, West London, Bradford, the Royal Agricultural University, Ravensbourne, Loughborough College, and KCL would all have been awarded gold rather than silver. Bishop Burton College, Trinity Laban, Southampton, and York St John would move from bronze to silver.
Those are the hypothetical winners – but there would also be a large number of losers under these rules, in particular FE colleges. Among HEIs, Bangor, Liverpool Hope, Nottingham Trent, Rose Bruford, Royal Central, Northampton, Derby, and Dundee would all be looking at silver rather than their current golds, with Birkbeck and Chichester slipping from silver to bronze.
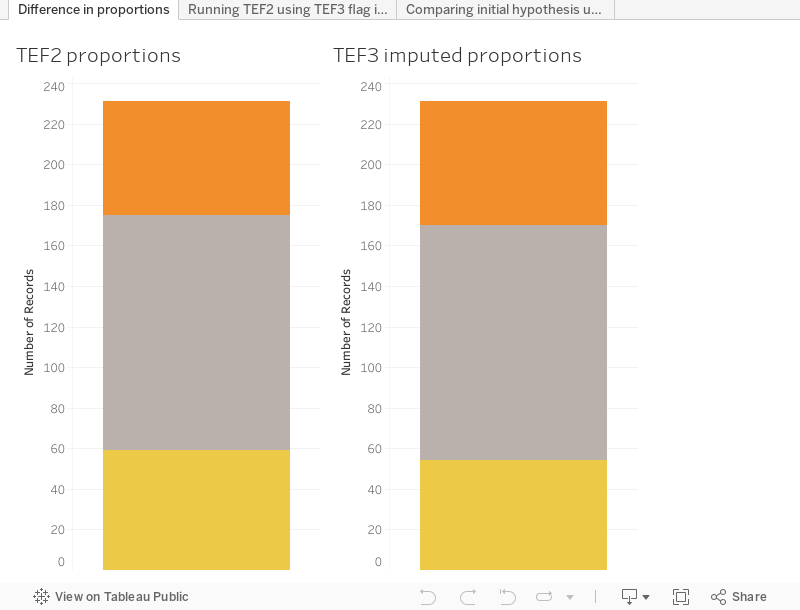
The third tab compares the initial hypothesis under TEF2 and TEF3 rules, ignoring the effects of the latter parts of the TEF process. Fascinatingly, we see fewer institutions meeting the criteria for gold and bronze under the newer rules, suggesting that TEF3 will place greater emphasis on the more “holistic” parts of the process.
What’s the difference?
This exercise, of course, is primarily for a bit of wonky fun. TEF fan fiction, if you will. But what we see here is an appreciable difference between TEF2 and TEF3 playing out in a simulation using real data.
You can bet that DfE and OfS have both run a similar simulation – these changes would be outcomes, it must be assumed, that would make those responsible happier. Is this the TEF2 that Jo Johnson really wanted?


