


A fee cut – whether across the board or targeted by subject – is the rumour that refuses to die in English higher education finance.
Even the disavowal of the Augar report’s £7,500 fee cap recommendation by none less than Philip Augar, and his continued argument that higher education should not be cut to provide more funds for further education, and his continued position that money taken off fee income should return to providers via direct grants, hasn’t stopped the speculation.
Incredible as it now seems, the idea of a fee cut was first postulated as a positive retail offer for Conservatives, following a perception that young people were attracted by Labour’s policy of abolishing tuition fees altogether.
The issue remains under active discussion in ongoing discussions between the sector, the Department for Education, and the Treasury. With that in mind, I’ve built a very simple model, showing a possible fee cut in terms of the proportional impact it has on a provider’s income.
A very simple model

For reasons that’ll I’ll get into shortly (hopefully demonstrating the complications of a headline policy change along the way) these calculations should be seen as indicative only. You can use the controls at the top to set your headline fee level (in £50 increments) between £3,000 and £10,000. You can chose to apply this cut (which in the real world, would be a selective reimbursement to providers) to any combination of three subject groups as follows:
- STEM – CAH top level groups 1 to 11 inclusive, plus the natural sciences component of group 12
- Social Sciences/Other – Social sciences (15), law (16), business (17), architecture (13), languages (19), and the social sciences component of group 12
- Arts/Humanities – humanities (14), communications (18), history and philosophy (20), creative arts (21), education (22), and combined studies (23).
The providers shown are those based in England that are in the Approved (Fee Cap) OfS registration category – those that are able to charge fees up to the high level fee cap that currently sits at £9,250. You can find providers of interest to you on the main graph using the highlighter and scroll bar at the bottom. The graph itself shows the proportion of total provider income that would be lost under the stipulated conditions, unless measures were made to compensate providers for this lost income as described in the Augar review.
All this is based simply on student (full time, first degree, undergraduate) numbers in each group, scaled by the overall proportion of students that are potentially liable to pay full time undergraduate fees and the assumption that all students pay the higher level English tuition fee, or an equivalent cost linked to that fee.
The provider colour groups are from the ongoing Wonkhe consultation on university groupings.
It’s a bit more complicated than that
The first and fundamental point is that there are many, many, students that do not pay the £9,250 fee.
The largest group, and the group of greatest financial importance in this calculation, are international students. HESA does not publish data on students by domicile and subject area – so because we are looking at subjects of study I’ve had to just use a scaling factor based on the proportion of all full time undergraduate students potentially liable to pay fees as reported through HESES.
So – I hear you cry – why not use HESES data to separate out home fundable students in price groups? Alas, if the new HESES data was here I could do that and separate out creative arts (group C1.2) students, but waiting till February 2022 doesn’t feel like an option at this point.
But even if we look only at student paying fees via the English finance system we stumble across problems – namely that the average amount paid by students is quite a lot lower than £9,250.
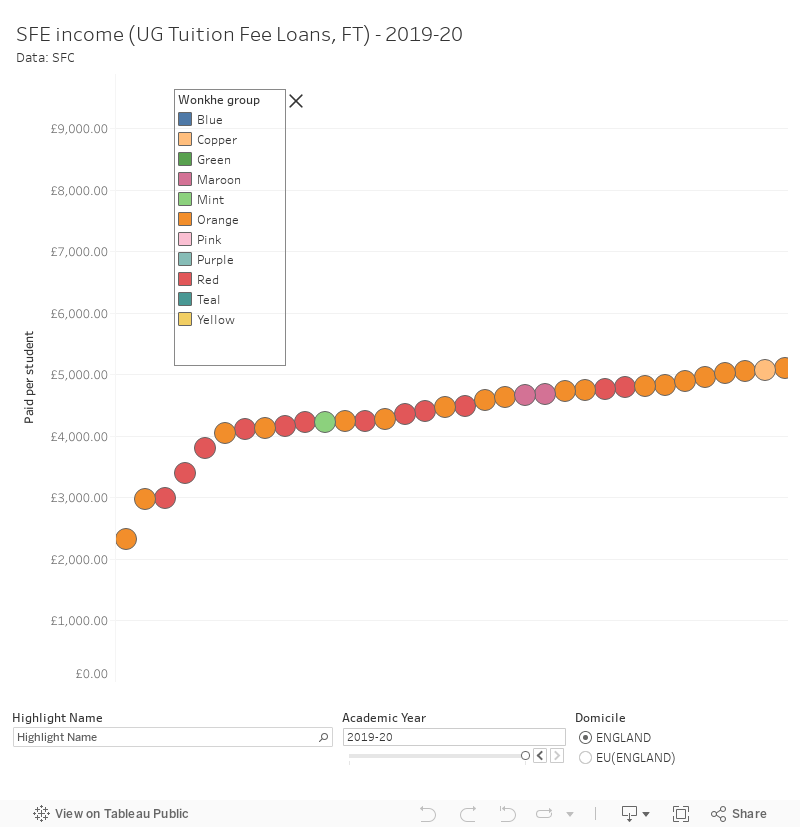
This is data from Student Finance England – you can look at either England domiciled or EU students paying English fees for either 2019-20 or 2018-19. Because we are given the total SFE income (with respect, here, to full time UG tuition fee loans) and the number of students this relates to we can simply divide the one by the other to get a per student figure.
Why isn’t this average £9,250? Many courses are priced below the higher fee cap – either by requirement (these are at providers that are not registered to charge full fees), by calculation (many providers teach some or all courses at below the maximum cost), or based on the use of partial fee waivers to support access and participation.
Wait, there’s more
Nine thousand, two hundred and fifty pounds feels like a lot of money when you open a letter from the SLC – or when you write it on a placard or post-it note. It represents the approximate total cost of teaching a subject in price groups C2 and D. It has been the cost of a year of degree tuition since 2017-18 – before that (and after 2012-13) the cost was £9,000.
But due to inflation the value of £9,250 today at 2012 prices is just £7,933. That’s the value in equivalent goods in 2012 – and really you should be surprised how high that is. Since the 2008 financial crisis the UK has seen very low inflation – we’ve not really been above 5 per cent since 2011. And the signs are that this is not going to last.
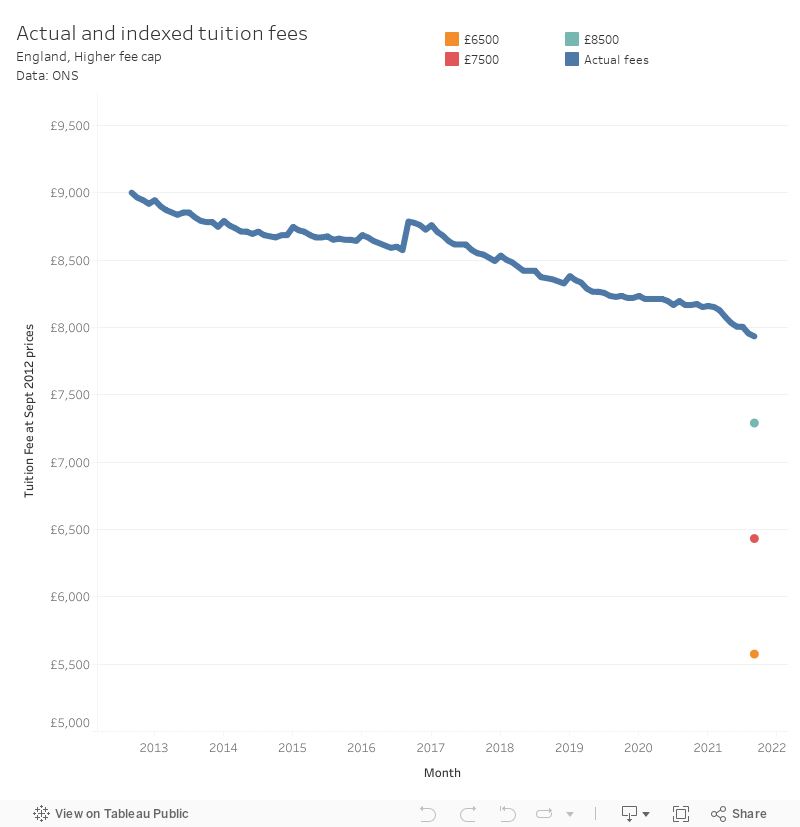
This chart shows the fee cap at the time in (September) 2012 prices – the coloured dots at the end show the value of the £8,500 rumour, the £7,500 Augar recommendation, and (for the nostalgic) the £6,500 Ed Miliband 2015 offer.
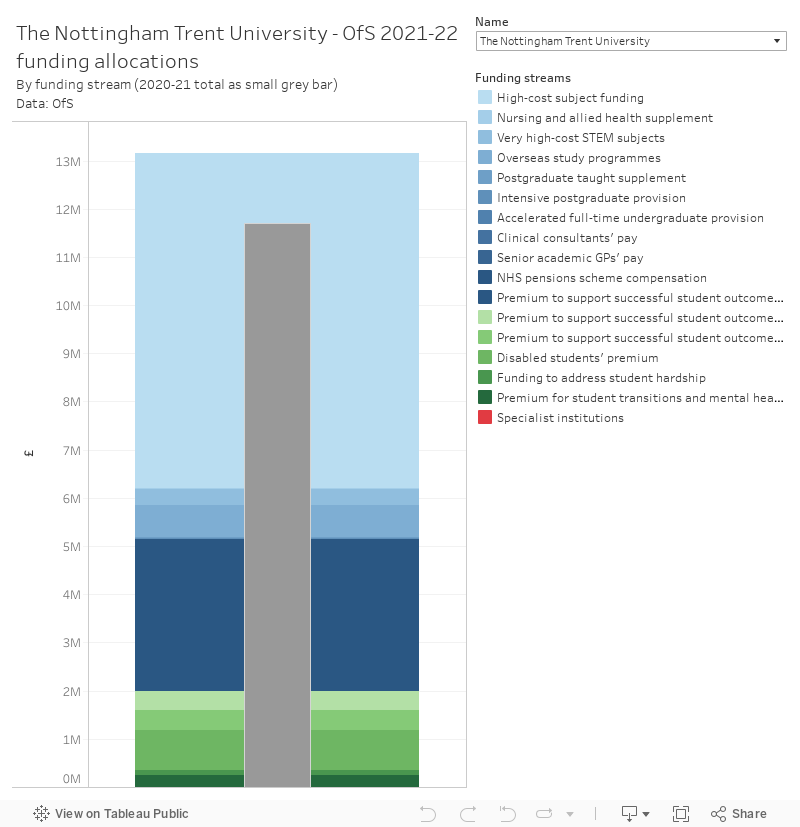
Any fee cut needs to be seen in context with any replacement funding that flows through the Office for Students – here’s a quick reminder of what your provider gets from the regulator now.
Where are we now?
Calculating the impact of a fee cut and related proposals initially seems deceptively simple – it’s laughably easy to come up with figures that will make your vice chancellor drop her toast in fright, or could cause a backbench Conservative MP to think twice before voting.
In reality, it is a leap in the dark. To calculate the impact properly we would need to know what fees are paid by every student in the system, how prices below both the old and new maximum would be likely to change, the likelihood that providers that are able would take international students in place of home students, and the likely behaviour of applicants faced with a more attractive retail offer alongside – perhaps – less choice.
I’m at the limits of public data in developing the intellectually unsatisfying model presented above. I’d like to think that deep within the bowels of the Sanctuary Building it is done better, but I would be very surprised if it was done accurately. We won’t know, in other words, until we make the change – beware always those bearing simple sounding solutions to hugely complex problems.
This is great David. I’d need more time to go through carefully but I have a few methodological thoughts… Probably better in an email.