


The Higher Education Statistics Agency’s release of widening participation data shows us that progress in the sector has slowed overall, and there remains wide variation between providers. A lot of coverage focused on the number of students from state schools entering higher education, but this is not a great proxy for under-represented groups because of the variability in performance – and intake – between different schools.
In his statement on this newly released data, Damian Hinds spoke positively of the number of applicants from state schools entering university: 90% of under 21 year-olds entering higher education in 2016/17 studied at state schools. Peter Horrocks, vice chancellor of the Open University, highlighted the 14% fall in part-time student numbers. He commented that, as part-time students are more likely to be from disadvantaged backgrounds, the drop in numbers is “undermining” efforts to open up higher education. MillionPlus called for a new approach to reverse the “damaging trends” among mature and part-time students.
We looked at low participation neighbourhoods – these are often the hardest prospective students to reach. Overall 11.4% of young entrants (under 21) were from low participation neighbourhoods, up from 10.0% in 2010-11.
Notes on the data
Those students whose postcode falls within wards with the lowest participation (quintile 1) according to the POLAR3 classification are denoted as being from a low participation neighbourhood. It isn’t possible to compare the results directly to the year previous as this is the first dataset to use the most recent version of POLAR3. Statistics aren’t available for institutions in Scotland, so these are not shown. And we’ve filtered out null values. You can read HESA’s definitions here, and you can access the statistics here.
Full-time
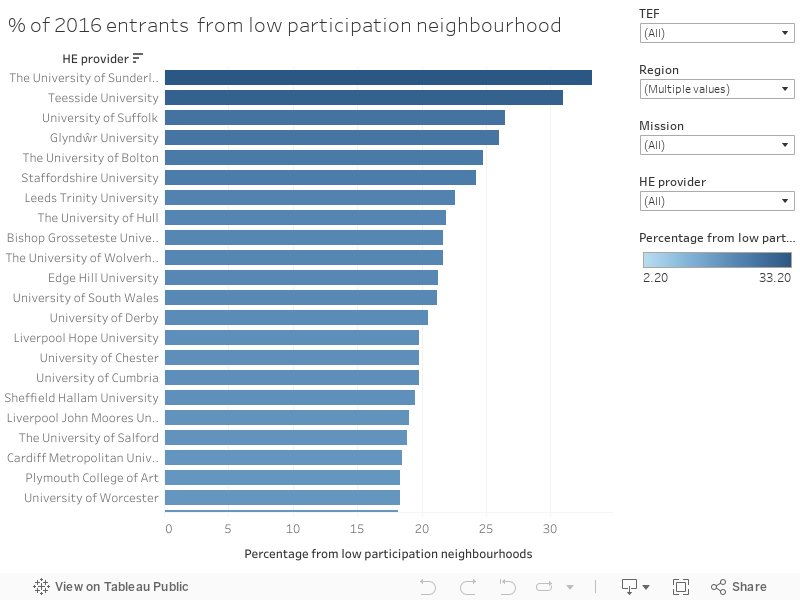
The data for full-time entrants looks at those under 21 years old, who are entering higher education for the first time. The five providers with the highest percentage of 2016 entrants from a low participation neighbourhood are as follows:
- University of Sunderland
- Teesside University
- University of Suffolk
- Glyndŵr University
- University of Bolton
The top five providers all had at least a quarter (24.8% and up) of entrants from the lowest participation neighbourhoods in 2016.
The bottom five providers – those with the lowest percentage of 2016 entrants from a low participation neighbourhood – are:
- Royal Agricultural University
- Guildhall School of Music and Drama
- University of Cambridge
- Royal College of Music
- University of Oxford
The above providers all took less than 4% of entrants from the lowest participation neighbourhoods.
High participation in the North
Almost two thirds of institutions in the North East, North West and Yorkshire and Humber regions took more than 10% of their 2016 cohort of students from low participation areas. Teesside and the University of Sunderland in particular took roughly a third of their entrants in the last year from the areas of lowest participation. At 5%, the University of Durham had the lowest intake of students from low participation neighbourhoods across the northern regions.
Meanwhile, the figure ranged between 2.2% to 18.3% across the southern regions. The highest percentage reported across the South East, the South West and London was 18.3% at Plymouth College of Art.
London
Zooming in to the capital paints a bleaker picture still: all 33 of the London institutions included within the data took less than 10% of their 2016 cohort from neighbourhoods of low participation. The best performers were a mixture of large and specialist institutions, while some of London’s biggest institutions, including UCL and Imperial College London, reported the smallest percentages of entrants from the quintile of lowest participation.
However, POLAR data has its limitations when classifying neighbourhoods in London and the South East, where there is a mix of advantage and disadvantage within the same neighbourhoods. In the capital, relatively disadvantaged families are more likely to live in POLAR Q3, Q4 and Q5, quintile areas (where Q5 denotes the highest participation).
Little TEF correlation
Yet another dataset confirms that TEF year 2, the results of which were released in June of last year, has had little noticeable impact on the 2016-17 UK admissions cycle. As the results were released after application deadlines for the main cycle, any influence of the TEF would only impact applications through clearing. The percentage of WP entrants to institutions awarded Bronze ranged from 4.2% to 26.5%, while the corresponding range for institutions awarded Gold was 3% to 21.7%. Just under 6 in 10 Gold institutions took less than 10% of its 2016 cohort students from the lowest participation areas. There were fewer Bronze institutions included in the data, but just over half took fewer than 10%. The largest range was found among Silver awarded institutions, who took between 2.2% and 33.2% WP entrants in the last year.
Mission Groups
University Alliance members performed particularly well: 14 of 18 alliance providers took more than 10% of their students from low participation neighbourhoods, and none reported lower than 5%.
All Russell Group institutions accepted fewer than 10% of their 2016 cohort from the quintile of lowest participation, with the Universities of Oxford and Cambridge reporting the lowest statistics at 3.5% and 3%, respectively. Figures were more varied across MillionPlus institutions and small, specialist institutions.
Part-time
Our visualisations of the data on part-time students cover students of all ages, and find that participation of those from low participation neighbourhoods in part-time education entering HE for the first time was altogether lower in 2016 than the figures for full-time education. A standalone institution is the University of Liverpool, which took a staggering 41.6% of its part time students from the lowest participation quintile – exactly double the next highest figure of 20.3% (from the University of Leeds). King’s College London (KCL) reported that it placed a miniscule 0.2% of part-time new entrants from low participation areas – the lowest figure recorded across all providers included in the data. The statistics for part-time entrants consider only those who entered into higher education for the first time in 2016.
There is more correlation between TEF award and proportion of part-time WP entrants than we noted among full-time entrants: with the exception of the University of Liverpool, Bronze providers generally performed poorly (roughly 10% or less). There was a greater range in performance among Silver- and Gold-awarded providers.
While most Russell Group institutions recorded less than 7% of their part-time entrants as coming from low participation areas, there were three outliers in the Universities of Bristol, Leeds and Liverpool (mentioned above), which all reported roughly 20% or greater.
The Open University reported positive figures for part-time students, with the OU in England, Wales and Northern Ireland placing 16%, 17.9% and 10.6% of their students from low participation neighbourhoods, respectively. The Open University Scotland is not included in the data.
Welsh providers generally ranked in the middle of the UK-wide range. There was a low- to mid-range performance from providers in the Midlands, but some strong results from outliers in the southern regions – the Universities of Bristol (19.2%) and Kent (17.1%). London providers’ intake of part-time students from low participation areas was strictly on the lower end of the spectrum: St Mary’s University, Twickenham, recorded the highest figure for part-time WP entrants at 5.7%.
On the whole, the data shows us that the largest chunk of the sector – first-time undergraduate full-time entrants under 21 – is performing steadily, and growing at a slow rate. When we focus on its often-neglected subsections – including mature and part-time students – we can notice long term trends of decline that have a particular impact on the sector’s ability to widen participation.
[Data visualisations by David Kernohan]


Usual caveats with London surely? POLAR is very misleading when considering neighborhoods with a mix of both advantage and disadvantage in the capital.
Lokking at the full time entry from WP is it any real shock those high performing universities are in areas where the average earnings are lower and where their is lower social mobility. Having grown up in County Durham seeing friends who got Educational Maintenance Allowance in FE (anyone remember that!) largely attend Sunderland, Teesside and Northumbria if they chose to go to university this hardly comes as surprising. Looking at the universities with over 20% how many are located in area where the income is below the national average.
If anything it shows two key things for me, firstly that students from a WP background are more likely to attend a ‘home’ university that is likely to be an ex poly. Secondly, there is still a case of elitism in universities which may have just as much to do with perception than anything else.
Something I would be really interested in knowing is how many students who are from a WP background are in the commuter category or have attended a university in their home county or region.
Doesn’t work.
Updated to add the caveats for London and the South East – thank you for pointing out!
I expect much of the difference in WP participation rates is due to schools careers advice: “don’t bother applying to x as they’re elitist and won’t take applicants like you”. It will take tremendous effort on the part of high performing institutions to overcome such bias
In response to Julian Sim’s comment on careers advice in schools, can I point out that a core principle of careers guidance by professionally qualified Careers Advisers is NEVER to tell pupils / students / clients what to do and where to go, but to establish in discussion what the client’s needs and interests are, help them to discover the potential options, take into account any limiting factors that the client identifies, challenge stereotypical views / assumptions and assist them to come to a clear decision themselves. It may be hat for pupils from low income households, it is a perfectly logical choice to go to their ‘home’ university if it means they can still live at home (which would be likely to cost less). If the course that they want is available there, that might be the right choice for individuals. The difficulty comes when a client’s chosen course is not available locally and they stat to limit their horizons to only those courses that are available locally. That is where the guidance and discussion is so important, to ensure that their final choice is based on recognising the alternative options that are available and actively choosing whether to take advantage of these alternatives or not.
It is more likely that the destruction of the Careers Service in schools in England and the decimation of the profession of Careers Advisers, by governments of all types over the past 10-15 years, has led to a lack of any effective careers guidance in most schools in England and therefore much more limited support to choose the course / institution that is right for them!
Of course, in Scotland, where there is a publically funded, national, all age guidance body, Skills Development Scotland, there is still careers advice provided by professionally qualified Careers Advisers.