


HESA student data is the gold standard for understanding the size and shape of the whole higher education sector.
There’s more than enough in these releases to fill a lifetime of these articles – I’ve chosen here to plot a few of the newer and less-seen slices with a focus on place.
Headlines
In releasing this data, the higher education statistics agency (HESA) notes – in particular – the rise in the post-graduate population, as we noted when we plotted the early statistical release back at the start of last month. The shift to postgraduate enrolment speaks to an economic necessity – undergraduate income (specifically for home students) isn’t rising any time soon, so providers are looking to postgraduate and international recruitment during this period of sharply rising costs.
We can see both postgraduate and international growth by provider in this latest HESA release – and also examine the parallel growth in non-resident students, who study remotely or spend a year on a placement. For those who do attend the campus, accommodation has become an increasingly pressurised experience and we can see that in the data by provider as well.
Where and to whom
Providers have what we could best describe as a catchment area, both in the UK and further afield.
Here, for instance is a look at international recruitment by provider (use the filters at the top, to set the provider, mode, and level of study of interest – see the growth over three years on the chart at the bottom by mousing over your country of interest on the map).
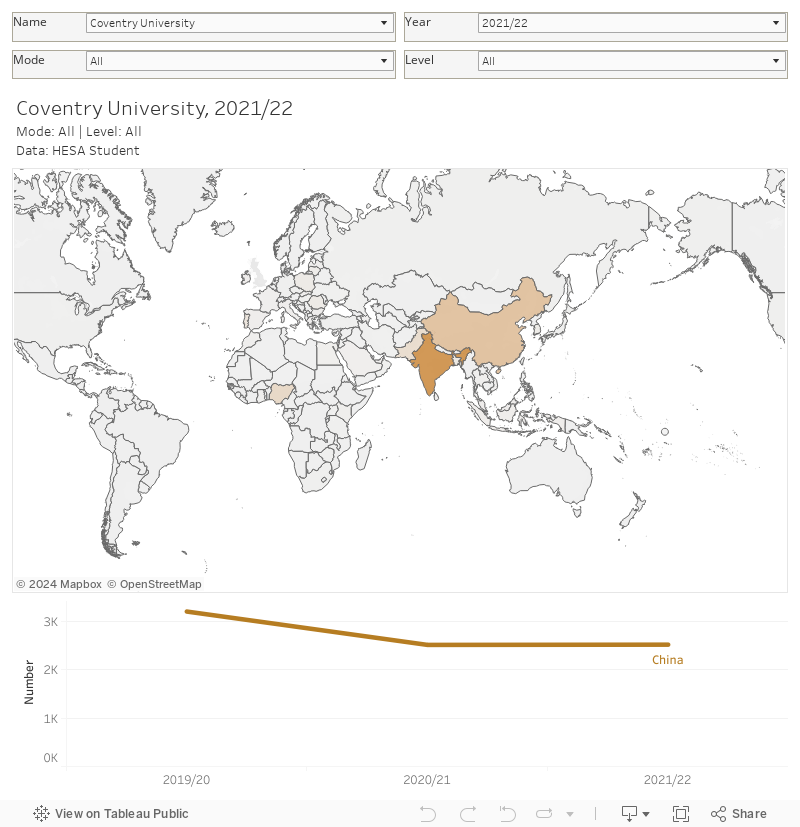
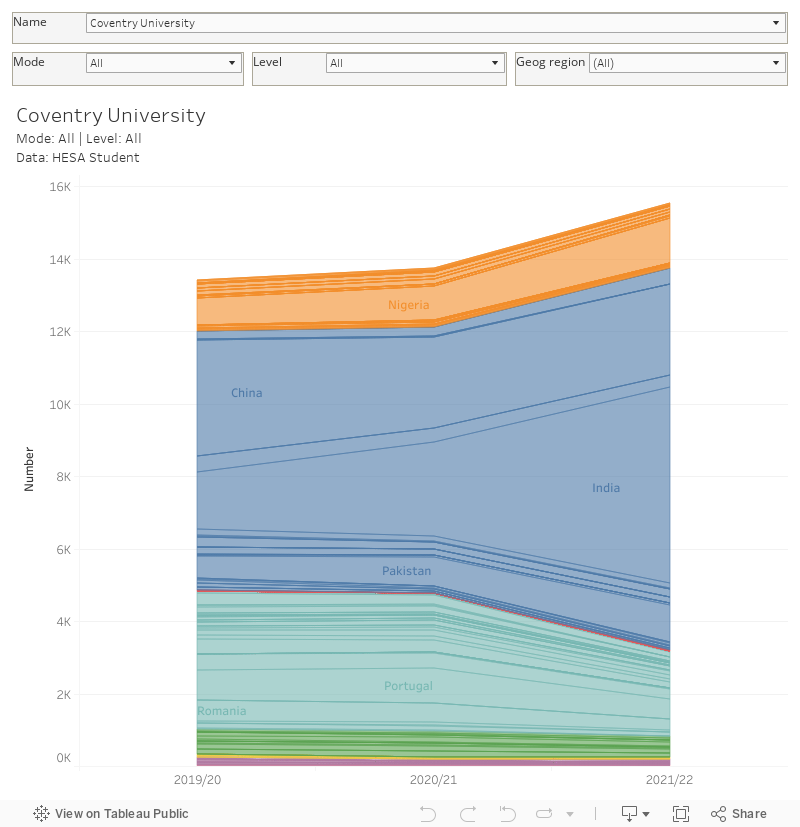
For a closer look at the global breadth of a provider, this chart stacks international recruitment into an area plot and allows you to filter by level and mode – or select your geographical region of interest.
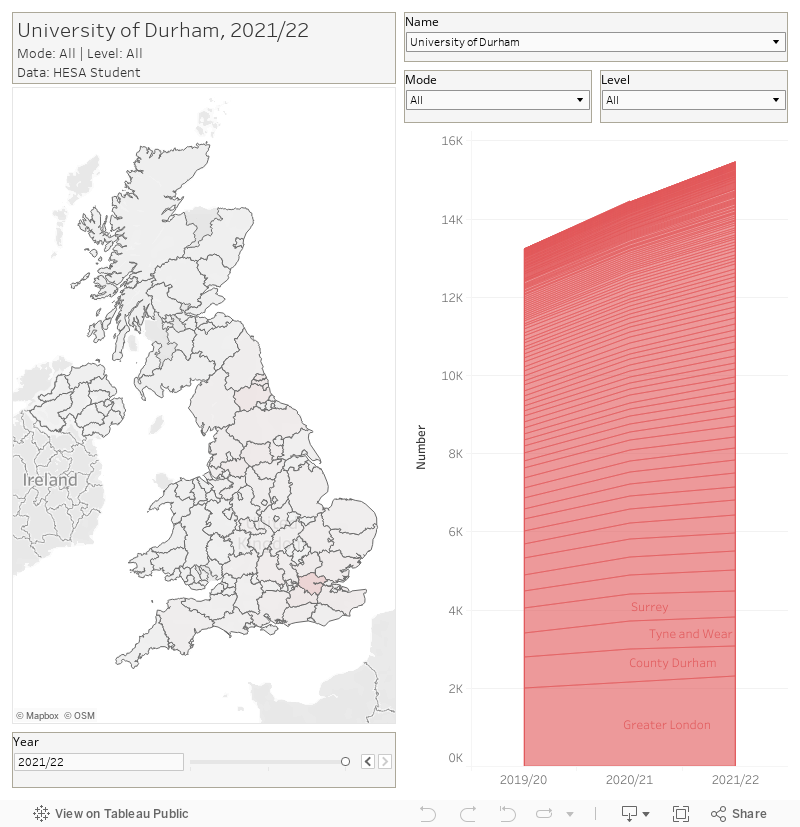
But we can also do this on a UK basis – looking at recruitment from a range of local authorities across the UK – though not before the rest of this paragraph, which exists to lament HESA’s choice of a non-standard mixture of counties (including ones that no longer exist like Northamptonshire), unitary authorities, metropolitan counties, and the actual ILTS region that is Greater London. I’ll be honest, if I have to grab three loads of shapefiles from the ONS geographies portal it is not a good day for me.
Here, you should set provider, mode and level using the controls on the top right. The intensity of the colour of each region on the map shows the number of students from each area in the most recent year (change that with the controls on the bottom left). The area chart shows each area ranked by proportion – mouse over an area on the chart to highlight it on the map – and vice versa.
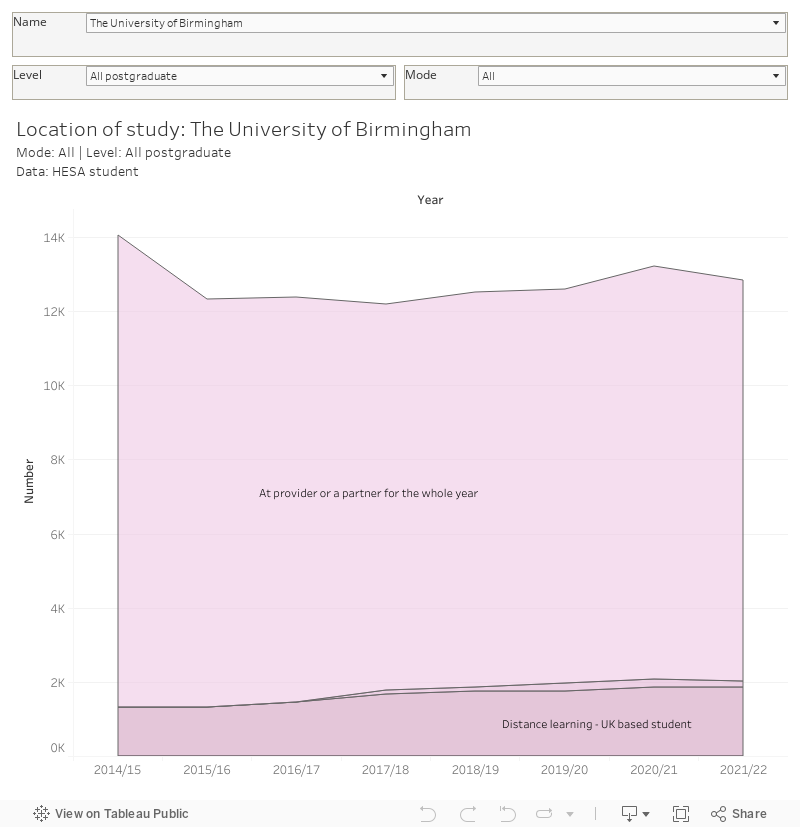
Where do they live when they get there? It’s an issue of increasing salience as numbers rise while the accommodation sector fails to recover from the pandemic. Accommodation costs are rising and availability is shrinking – we’ve all heard the horror stories about first years having to live in a completely different town (or indeed country!) at great detriment to the quality of their lived experience.
Of course, not all students studying at a provider end up living there – new for 2021-22 we get a “location of study” dataset. It’s not perfect – I would have liked to see the “at provider or partner” field split – but it is interesting to see the growth of distance learning since 2014-15 by provider.
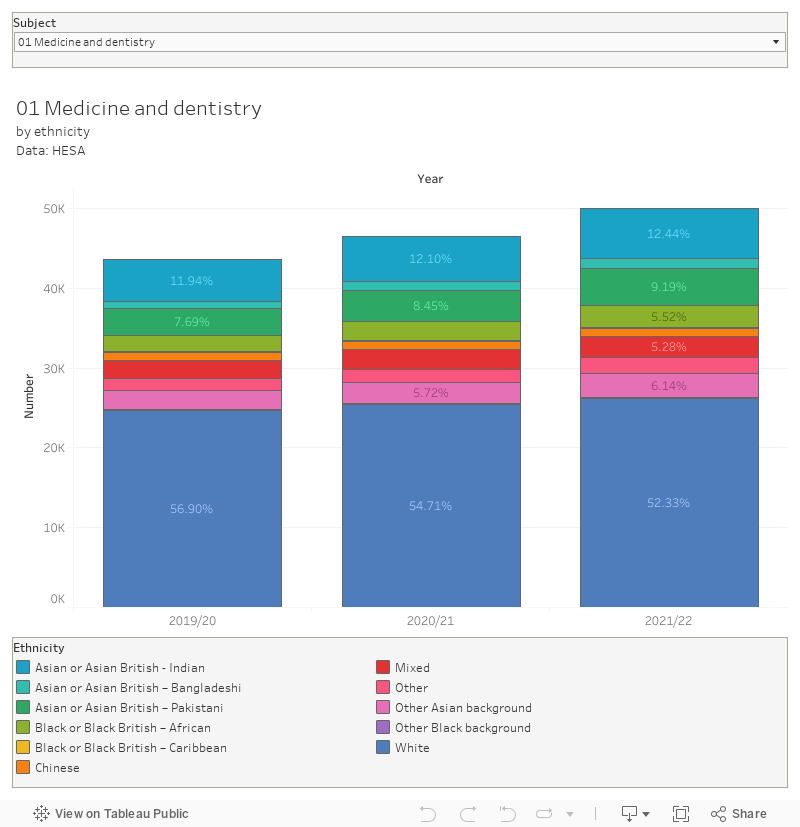
Bonus chart
Nothing to do with the location theme of the article, just something I found interesting. Here’s the ethnic mix of each top level subject of study for the past three years.
Great data set. It points up the very different missions of different HEIs in relation to their local geographies – with University of Bristol for example serving London and the Home Counties and UWE Bristol majoring on Bristol and the adjoining areas. Could you present the equivalent analysis for destination after graduation?
Hi Martin – yes. It’s not for the same cohort but there will be data on this in the HESA Graduate Outcomes release due in May.
It’s really useful! May I know if there is an option to filter by new enrolment only instead of total number of students?
Hi Connie – not with these datasets, I fear.