


It’s not a great year for keeping students on course. 6.8 per cent of students in the UK did not continue their studies in 2017-18, 0.3 per cent up on the previous year.
This appears to be a UK wide pattern, with the increase smallest in Scotland and the percentages smaller for the year in England and Wales. The OfS’ Nicola Dandridge said:
An increase in the proportion of students dropping out is a concern. Rates vary significantly between different higher education providers, and a number of providers will need to think seriously about what they can do to reduce these rates”
The regulator promises to take action with respect to particular providers of concern. So who might these be?
Those letter recipients in full
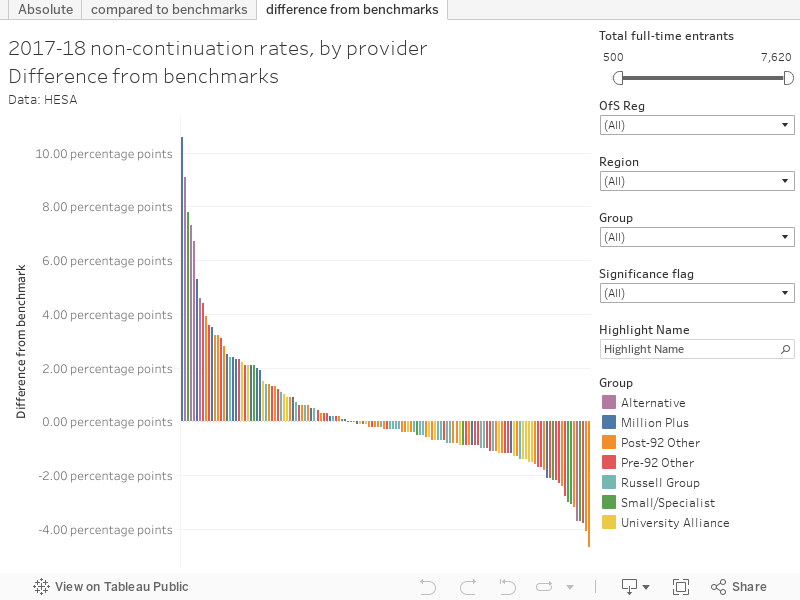
In some ways it depends how you measure it. Clearly the University of Bedfordshire will be getting a letter, as will Ravensbourne and the London School of Business and Management if you look at the difference between actual non-continuation and benchmark for providers with more than 500 students (“difference from benchmarks”). Less painful to look at (and prettier), is the scatter plot (“compared to benchmarks”) – everybody above the trend line may potentially be in trouble, but the way the benchmarks vary by mission groups is quite striking.
Lastly, you could look at raw non-continuation rates (“absolute”), showing that a range of alternative providers (topped by the Fairfield School of Business) are most likely to be held responsible.
Are we projecting?
But there’s another way. The data above uses data from a new methodology which – for the first time as official statistics – includes alternate providers. Previously, this data took the form of projected outcomes – assuming students in the year in question behaved in a similar way to previous years. Data based on that methodology is available and looks like this:
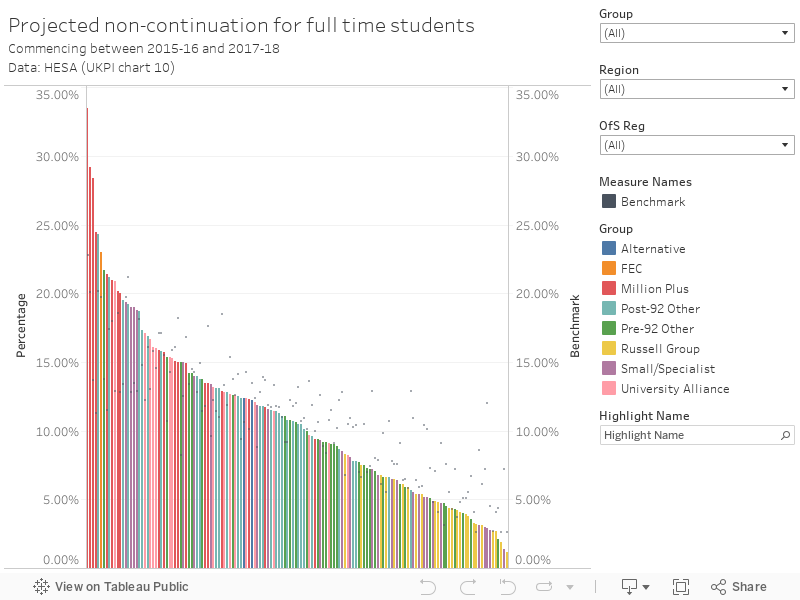
On this reckoning, Bedfordshire, London Metropolitan, and Canterbury Christ Church can expect some unwelcome post for sure. We’re looking here at UK domiciled undergraduate students expected neither to gain an award from their current HEI nor transfer to another one.
Which is correct? Well, although impact for more students would be seen through changes to enhance continuation made at the larger providers with a larger non-continuation rate, in practice the benchmarking process – which attempts to separate institution-specific issues from more general differences attributable to background and characteristics – is seen as particularly important.
Benchmarks for non-continuation – and the differences between benchmarks and observed rates – are probably most familiar to those used to pouring over TEF work books. The positive and negative flags are within this dataset, so you’ll find them in the tooltips and there’s a special extra filter. Of course a single flag here means a double flag in TEF.
Macro level
So 34,870 students did not continue in HE during 2017-18, 33,745 did not continue during 2016-17. This is against a background of a slight drop in the relevant UK student population – and no change in the number of providers involved. The characteristics of the student body are broadly similar. What is going on?
Bluntly, we don’t get enough information in this release to know. The largest non-continuation percentage increase is in mature full time students , but as these constitute a comparatively low number of students overall that’s not going to be a major contributor. More students than ever before are starting foundation years – enough to put an appreciable dent in the percentage share of year one starts – but again there’s not enough to connect these to dropout likelihood.


You should make it clearer that the stats referenced in the headline and the bulk of the article are for 1st to 2nd year non-continuation, not total student drop outs.
Employment in the UK is high and trending upwards at the moment (https://www.ons.gov.uk/employmentandlabourmarket/peopleinwork/employmentandemployeetypes/bulletins/uklabourmarket/february2020), even though the productivity data may give us concern about the quality of those jobs. Surely we should expect more drop-out (all other things being equal) when the availability of jobs to drop into is improving?
“pouring over TEF work books”?