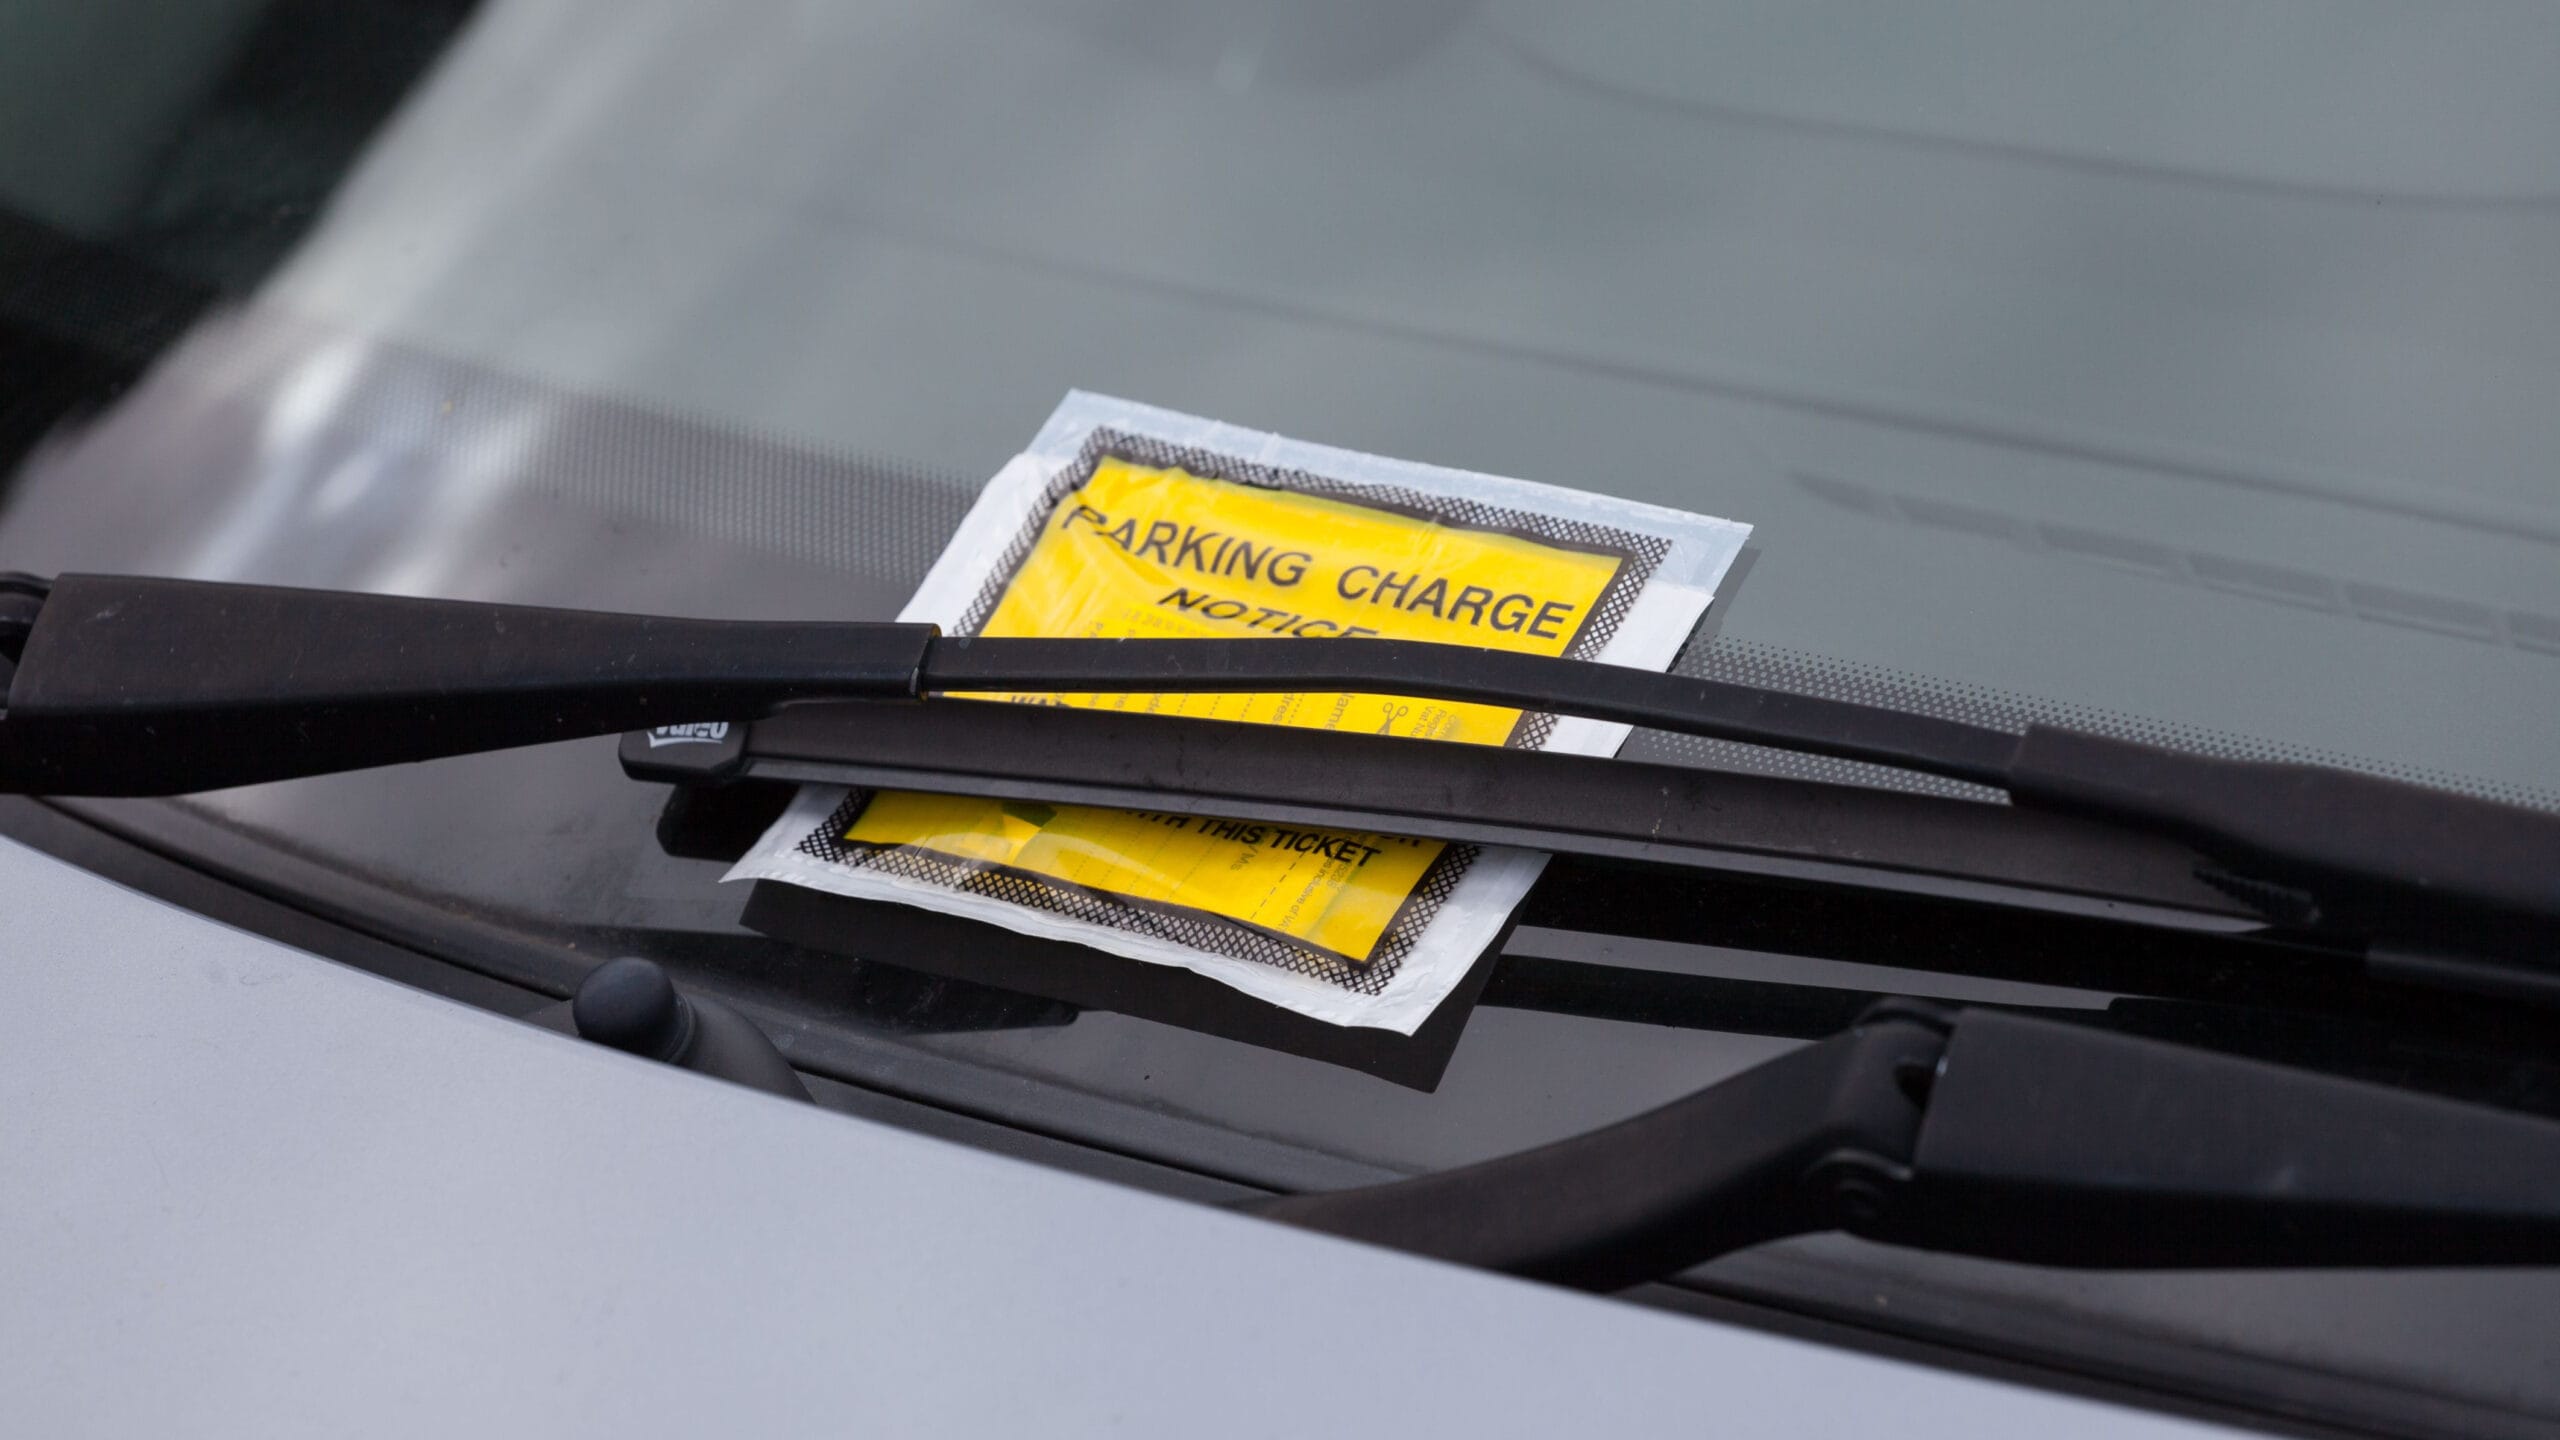
Hard standing: the Wonkhe Car Parking Ranking 2020
Tongue firmly in cheek, David Kernohan and Paul Greatrix rank universities according to their ease of parking, and announce the 2020 Wonkhe Car Parking University (College) of the Year
This article is more than 7 years old
Stacks|

David Kernohan is Deputy Editor of Wonkhe
Paul Greatrix is an HE expert and was until recently Registrar at the University of Nottingham
The numbers have been crunched, the findings have been visualised, and we are delighted to announce our 2020 Car Parking University of the Year: Writtle University College.
Writtle offers free parking to all staff and students, and is based in a beautiful campus just outside Chelmsford. All this is irrelevant to our ranking, which is based entirely on metrics from data provided to HESA as a part of the Estates Record for 2017-18.
Our ranking
We’ve had some rather interesting rankings here on Wonkhe over the years, from the fictional universities ranking to the climate change league table and the hipster rank to the most subtle of free speech tables but one of the most popular has been the very niche league table produced for the first time back in 2018 on car parking. This time round, we’ve elected to double down on our success and name a Parking University (College) of the Year.
Our calculations are based on the supply of parking (the number of spaces on campus) divided by the demand for parking (based on the percentages of students and staff driving or carpooling to campus). Such a clear methodology means we can ignore the qualitative opinions of students and staff, which are messy and difficult to put on a league table. This puts this table in competition with several other major rankings – but we feel we’ve created something uniquely useful to prospective students, because:
- We’ve done it in tableau, so you can waste a morning playing with it. As well as the raw rankings, you can look at in year car parking capacity change, underlying data, changes in student behaviour, and – for the small percentage of our readers that like looking at maps, a map.
- We’ve focused on a metric people actually care about (how easy it is to find a car parking space) that is not often covered in other tables focused on wider concerns like teaching, research, living costs, and the wider student experience.
- Frankly rankings are all about click rates, we’re late to the party, so we needed to find a niche and are not too ashamed to admit it.
Our ranking is the only university performance table to assess a record 146 universities across all of their core parking indicators. We use a carefully calibrated set of indicators, most of them sadly invisible to the casual observer so you’ll just have to take our word for it, to deliver a totally comprehensive and balanced league table which is completely trusted by security staff, students, governments, city councillors and car parking fetishists everywhere. It both encourages providers to improve their parking provision, and offers a guide to prospective students with ease of parking on their mind – thus providing a valuable public service as well as lots of lovely traffic.
It’s not just a parking beauty parade though. We are not merely rewarding those that can afford to pay top dollar for their parking facilities, valet parking options, multi-storey car parks or security team. This is the tough reality of a highly competitive, unequal world and the global market for on campus parking. Our ranking rewards those who do it right, not just those with the best logos, fine notices, and wheelclamps.
Movers and shakers
Since the first landmark ranking last year there has undoubtedly been some significant activity by institutions to address the core issues and to seek advantage in the table. You’d expect this, given that half of the calculation is based on self-reported behaviour and the student cohort has changed. But movement adds drama to a ranking, and allows us to build compelling (and click-worthy) narratives into what are essentially statistical artifacts.
So there will be hard questions asked of estates staff at Portsmouth – last years winners have plummeted to fifth place. But we’ve seen great performances from Manchester, Leicester, and City University, rising 68 places, 74 places, and an incredible 137 places respectively. In the case of Leicester this is despite the in-year loss of 128 car parking spaces.
Whether painting more lines or narrowing spaces, building new multi-storey car parks, using parking as income generation or increasing spaces to make more people happy, universities have undoubtedly adopted a variety of strategies to improve their positions. Cranfield’s bold plan to replace parking with flowerpots correlates with a rise of 5 places. Or does it?
Perverse incentives
So if it’s not extra estates investment, why are we seeing these changes? For Manchester it’s a reduction in the percentage of students choosing to commute to study as sole car occupants. But for Leicester and City the answer lies in a strategic decision to submit percentage modal commuting splits to HESA this year, despite not doing so last year.
Perverse incentives abound in league tables, and the decisions made by these universities to “game the system” (causing us to use supplied values rather than a regional approximation from the National Transport survey we used last year) must surely be addressed in the next policy intervention from Damian Hinds.
Our plan therefore will be to recreate this dataset using detailed FOI requests to every individual provider. The addition of further data demands on the sector for the purposes of a media-generated ranking has a rich methodological history to which we are delighted to be contributing.
And while the rankings are currently UK only, our ambition is to go global for next year to ensure all universities around the world are properly able to compare their parking achievements with their parking peers.
These rankings, though far more robust than they need to be, are for entertainment purposes only. We’re not making a bold pivot to the rankings industry. And obviously we’re not saying that easier parking is a goal towards which the sector should be striving.