


We got three new OfS dashboards in November, all relating to the sector as a whole, with no individual institution splits. Sigh of relief there then.
Nevertheless, these new student characteristics dashboards contain evidence to suggest why so many institutions may be struggling with a range of issues, such as degree awarding gaps – as well as providing much fun for data geeks like myself.
Make a dash for it
There’s the population dashboard, which shows trends from the last ten years in access to higher education. And there’s lots of new groups to explore – from free school meals eligibility to gender identity, religion or belief, sexual orientation, household income and the no doubt soon to be ubiquitous ABCs quintiles.
Then there’s the outcomes dashboard, which, with continuation, completion and progression (and, as a bonus, attainment) indicators, to my untrained eye looks suspiciously like the B3 regulation dashboard, although this time we can split by student group.
Again, loads of interesting stuff going on although, unfortunately, free school meals eligibility is as yet unavailable. Looking at the most recent data from my own institution, I can see FSM being a key student success as well as access target group of interest.
Cutting a dash
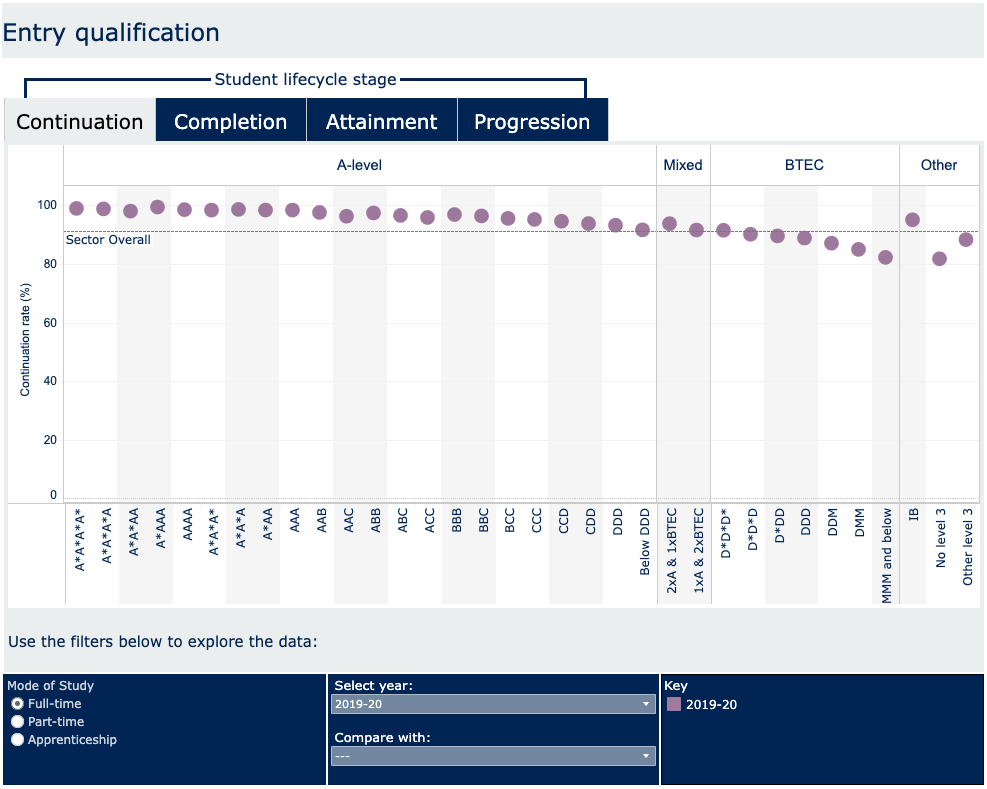
There’s plenty for data wonks to get their teeth stuck into. But the reason I felt compelled to write this blog was the third and final dashboard – entry qualification and subject data, or more specifically the entry qualification element of this fascinating duo.
No messing about with filters required to see the stark differences in outcomes between students entering higher education through the “traditional” A level route and those qualifying via the BTEC only route (typically a BTEC Extended Diploma equivalent to three A-Levels).
The default page focuses on continuation, where we find – as might be expected – the higher the grades, the higher the continuation rates. Or at least that’s the case when separating the different entry routes, as the dashboard handily does.
Are these routes really equivalent in terms of academic preparedness for the transition to higher education? One glance at the dashboard suggests not. Indeed, students with below DDD at A level (<72 tariff points) actually had higher rates of continuation than BTEC entrants with the very highest grade of D*D*D* (144 points).
And if we flick over to the other tabs, we find a similar pattern for attainment (2:1 or First class) and progression (to graduate level occupations or further study). This is despite the fact that the UCAS tariff treats the two routes the same.
Two pathways both alike in dignity
Having qualified for university entry via the BTEC route myself, I’m by no means criticising this qualification. Indeed, it offers an alternative route into higher education for those of us who had not negotiated the “traditional” pathway.
But we do need to at least acknowledge these stark differences – because underneath the overall average position, we might find courses, or specific modules within courses, for which such pathways are an unsuitable match to the demands of the undergraduate curriculum or its assessment practices.
If we dig deeper we find that specific groups of students are more likely to enter higher education through the BTEC route. For example, according to data from my institution, BTEC entrants are disproportionately black, disproportionately commuting to study, disproportionately eligible for free school meals, disproportionately male, disproportionately mature, disproportionately from deprived neighbourhoods and disproportionately eligible for a NTU means tested bursary.
It is perhaps no coincidence that these supplementary characteristics in their own right are also statistically associated with inferior outcomes. Although our performance in tackling gaps is ultimately judged from a homogenous perspective, we cannot ignore that multiple socioeconomic and demographic factors converge to influence student outcomes.
In a nutshell, when we talk of BTEC students, we are also talking of a host of other individual characteristics that influence their higher education experience. Understanding this intersectionality is crucial, because any interventions targeted at one specific group of students will automatically be targeted at other groups by proxy.
Cycle challenge
There is an inextricable link between the admissions and student success stages of the higher education student lifecycle. Our endeavours to diversify the student body by means of inclusive entry criteria inevitably influences continuation, completion, attainment and graduate outcomes.
Between 2017-18 and 2021-22, for example, the number of BTEC only entrants at our institution has increased by some 40 per cent and so, by definition, access of students from our other target groups has also increased. In effect, at the same time as we have been working to address degree awarding gaps, we have also significantly increased the scale of the challenge.
We know that many of the beneficiaries of widening access interventions, such as outreach and contextual admissions, will enrol at our institutions. Sector efforts to widen participation have a direct link to the success stage of the lifecycle.
We should not shy away from this dual challenge. A student from a deprived neighbourhood, formerly eligible for free school meals who came through the BTEC route and who goes on to achieve a 2:2, for example, may be an excellent outcome for that student.
But we should be mindful of the links between the diversity of the student body recruited and differential rates of success. Equality of opportunity differs from equality of student outcomes. The latter may be a desirable and well-meaning goal, but not a realistic one.
Beyond the tariff
Whilst there are equivalences in terms of tariff points for BTEC and A level qualification routes, there the similarity ends. Students with the lowest tariffs gained from A levels tend to do better than those with highest possible tariffs gained through BTECs. Tariffs are therefore a very poor indicator of academic preparedness if they are treated in this identical way for these very different entry routes.
Moreover, BTECs tend to be disproportionately studied by students with other characteristics known to be negatively associated with success. We should therefore not expect equal outcomes between the two routes, as they are clearly very different cohorts. However, we should identify risks to equality of opportunity, such as modules for which BTEC entrants are clearly inadequately prepared, and intervene accordingly.
With the future funding for BTECs in doubt as the sector moves towards T levels, we need to minimise any mismatch between Level 3 qualifications and any undergraduate curricular and assessment practices that hinder students’ opportunities to succeed.


Thanks for digging into this.
It would be interesting to see if the BTEC reform from QCF to RQF changes the picture.
In theory, the new RQF framework with its examination components, will potentially result in applicants/students having lower tariffs yet, paradoxically, improved outcomes. A combination of difficulties in distinguishing between the two frameworks in our own data and the Covid related restrictions meaning that there were no examinations anyway, has meant it has not yet been possible to compare access and student success outcomes between these two frameworks. So I agree – will be be very interesting….
Excellent piece Mike. Thank you for this contribution.
Thank you for providing these points. So what are we going to do about it? Do we modify the BTEC curriculum to better align with A level or university studies? Do we provide additional support for BTEC entrance students at the University level? Universities should be inclusive and I for one would welcome BTEC students.
Providing extra support for BREC students seems obvious. But bearing in mind the other population characteristics of BTEC students (as described in the article) this would start to look like extra support for poor black males. How is that going to feel? And in any case, extra support is a deficit model. At the institution where I worked some years ago, we offered extra support on engineering courses for students with BTEC not A level maths, whom we found we were struggling on our courses written on the assumption that engineering students had A levels maths; and in each year of the course there was a standalone engineering maths module. However, we had a rethink, and started to redesign the courses with modules that incorporated the maths into the particular application of that maths eg. designing an aircraft wing. This is more of an applied, BTEC approach, but would not disadvantage the A level maths students. Unfortunately I’ve changed job and so cannot report on the outcomes of this initiative.
It’s not just a question of support – although that is important as Mike pointed out there are other factors at play besides the qualification itself. The first year undergraduate approach to pedagogy and curriculum is largely designed to accommodate A Level students so the skills and capacities that BTEC students have developed – such as group work and projects – are not present.
A very interesting article, Mike. Thank you. There’s a great book that I reviewed in the following article https://www.tandfonline.com/doi/full/10.1080/13636820.2021.1957303 by Banerjee P and Myhill D which connects well to some of the matters you raise. I believe the answer very much lies in universities making small but meaningful changes to first year course content and assessment methods such as the other contributor suggested in relation to engineering. I have taught quite a bit of economics to many students who have joined my University via a BTEC pathway. We show them that assessment success at level 4 in their first year (and usually, first time ever studying economics) on our economics module IS possible. It really boosts student confidence and esteem.
Interesting article to bring this back to people’s attention! There’s been a lot of research on the awarding gaps between students with BTEC and A Level qualifications – including some great work by NTU (coincidentally, considering Mike’s institution!) around 2015 so the dashboards aren’t showing us anything new. What is concerning though is how little distance we’ve travelled in addressing these gaps. NEON has a working group on “Supporting Access, Success and Progression for Vocational Learners” for those interested in what more we can do to address these gaps.
Interesting article. On the tariff points, the UCAS tariff takes Ofqual at its word and if they say it is Level 3 then it gets UCAS tariff points – hence the equivalence in points between A Level and BTEC. All the tariff does is calculate/smooth the equivalence between different grading systems such as A*-E for A level or D*D*D* etc for BTEC
Good article on an important topic. This is the data that in part has driven DfE to want to replace most/many BTECs with T Levels. The complex interplay of student characteristics and whether they study A Level of BTEC has not been properly considered in the policy discussions in my view. That’s starting to bite the roll-out of T Levels as well, with signs that students who might in the past have taken a BTEC struggling with the T Level. That’s no surprise given the average score at GCSE of a BTEC or T Level student is a long way behind the average of an A Level student – around 4 to 5 compared with over 6. It would be interesting to plot the GCSE scores against outcomes and see how much that explains things.