


Based on last week’s Home Office statistics, we are looking at some fundamental shifts in international recruitment (and, indeed international enrolment) patterns.
Jim’s piece on the data release goes over what is happening in more detail – changes in international currency exchange rates, and a perception that our government’s hostility to immigration in all forms will have an impact on study and post-graduation work visas, has made for some painful looking differences in who is actually turning up to study and pay fees.
What this means for a bunch of already-struggling higher education institutions is less easy to say – so I thought I’d have a go at modelling it.
Here I’m using HESA Student and HESA Finance data for 2021-22 – incredible as it may seem that is the latest available data on both provider finances and student numbers. The Office for Students do have the finance data (see the write up from the Public Accounts Committee for Susan Lapworth’s hot take on that – spoilers: it’s not looking good) and we’ll get that at the usual time. On student numbers, we literally do not know how many students are in UK HE at the moment and we probably never will know for sure for last year – the glory of Data Futures.
National express
The first thing to be aware of is that different providers are exposed to recruitment from different countries in different ways. Here’s a quick way to check this out – and if you want the reverse version (all the providers recruiting from a particular country) I have you covered too.
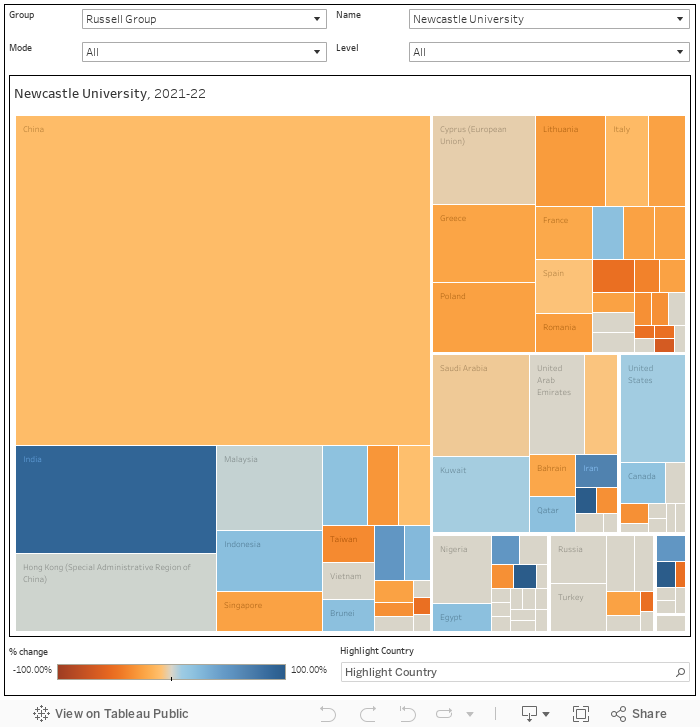
Note that the group and provider filters interact – by selecting all for providers within a group you can look at the performance of mission groups overall. In my continuing quest to show meaningful subsets of the sector you’ll note that I have once again separated out the “big 7” (providers with income above £1bn) from the rest of the Russell Group, and new categories include the Cathedrals Group and the UKADIA group. You’ll need to select “all” on both filters to move between groups.
Unlike home fees, which are generally identical at undergraduate level and within a fairly tight range at postgraduate level, international fees vary by country of domicile, level, subject, and provider: often quite drastically.
The missing international fee data
I can’t do anything about different fees charged in different parts of the world, or about different subject fees, but I can give you a rough income per FTE by mode, level, and provider.
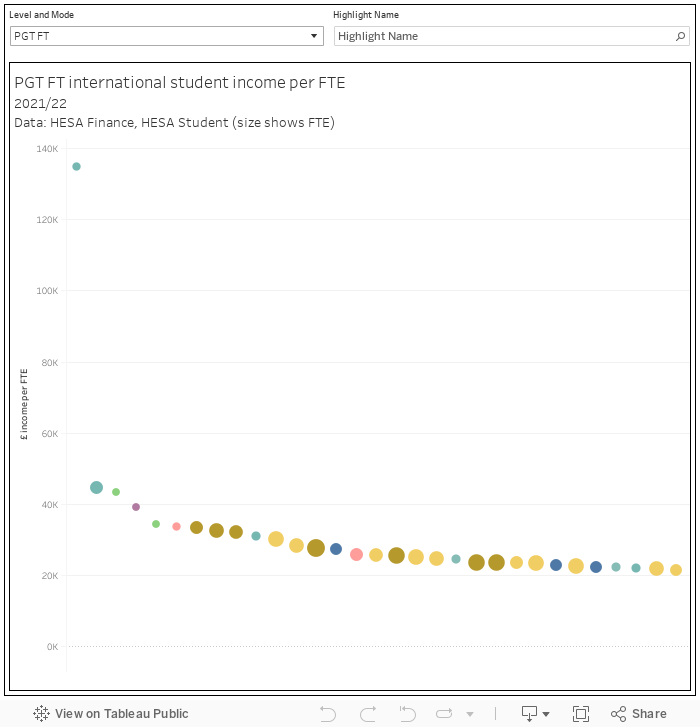
Here level and mode are combined in the filter as we are able, for example, to differentiate between full time and part time postgraduate taught numbers and income.
There’s some odd outliers that feel like data errors, but if you look at larger universities you get a sense of the range of income per international student that generally (but not always) maps to what we might loosely call prestige (the dots show the number of students involved). There are interesting differences by level and mode of study too.
Financial impact
What this doesn’t really show us is the impact that a change (or reduction, most likely) in recruitment patterns would have for each provider.
To build this next chart I’ve had to make a few assumptions which don’t hold up in real life:
- I’ve assumed there is no fee difference by subject (the data just isn’t there)
- I’ve assumed there is no fee difference by country of residence (again, no way of modelling this).
- I’ve assumed that, other than the five largest markets, recruitment moves in lockstep across the world.
What this does model under the bonnet is fee differences by level, mode, and provider – and tot these up to shift provider income (and thus surplus/deficit). Again, this is 2021-22 data, so imagine a version of 2021-22 with this year’s recruitment patterns – unless your provider has radically changed direction it is probably good enough to be at least indicative.
The key to this dashboard is the parameters at the top. For each of the five most likely countries (China, India, Nigeria, Pakistan, USA) and the rest of the world you can set the amount of change in actual, fee paying, recruitment. A value of 1 assumes no change from 2021-22 patterns, but you can scale between 0 (no recruitment at all) and 2 (recruitment doubles) in increments of 0.01). By default I’ve used the changes between Q4 2022 and Q4 2023 that we saw in the Home Office figures, but you can do anything you like – including banning all international recruitment in a Suella Bravermen fantasy style.
The chart shows the predicted surplus or deficit (given the parameters) as the thick bars, and the actual surplus or deficit as the small bars – this is calculated using the HESA values for income and expenditure from table 1 of HESA Finance. It is, as you might expect – pretty complex under the hood, so have patience.
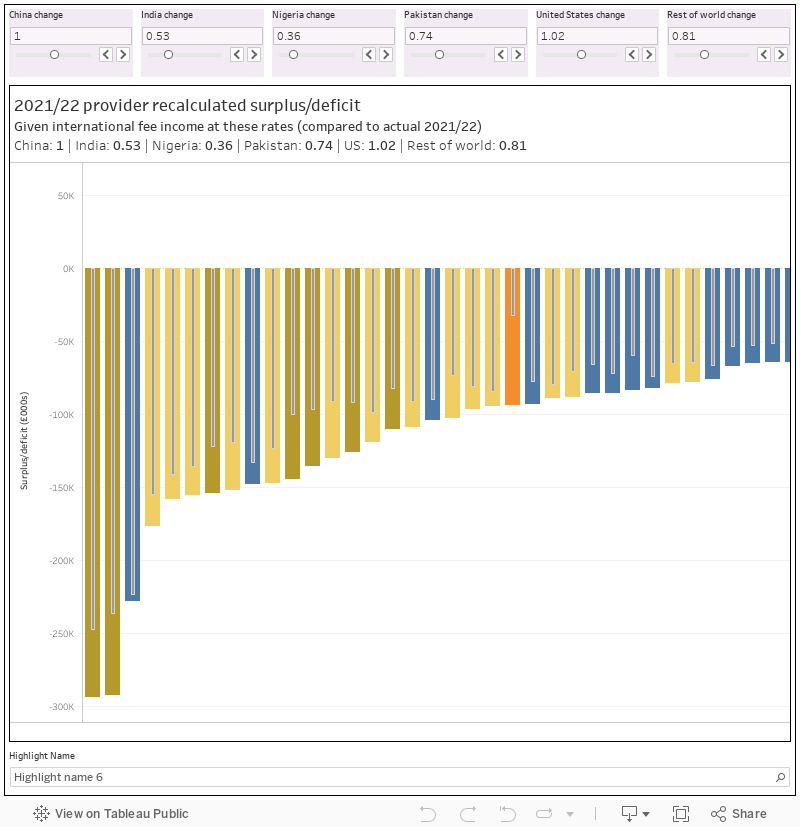
(As a technical note, 2021-22 was the year that actuarial adjustments to USS pension treatment slightly flattered the income of the pre-1992 sector – I’ve gone with the unadjusted total to enable an easy read across to what is in HESA and institutional financial statements, though the precise figure will be different as I’ve used total income minus total expenditure to build the comparator as I obviously needed to do so for the recalculated value. As always, if you want to know the exact and up-to-date financial position of your provider, buy your director finance a pint.)
You’ll note that it is, for the most part, Russell Group and the old civics that get the hammering. At the other end of the spectrum we will see comparable effects on newer universities from changes to foundation year funding, a possible clampdown on franchising, and the ongoing Teachers’ Pension Scheme scandal – with the wider impact of rising costs against static home student income playing a part everywhere.
It is, in other words, a bleak year ahead for the sector – wherever you are in it. But we knew that.
It’s noticeable that most of the universities that have seen large increases in international PGT numbers over the last few years are near the bottom of the income per international PGT student chart. Hertfordshire, UEL, Teesside, Northumbria, Greenwich, Sheffield Hallam and Ulster are all below £9,250 per year. Coventry is the only partial exception at £13,714 per year. These will probably be hit hard by the incoming drop in student numbers though.