

I’ve stopped believing in Father NSSmas. Here’s why
Jim is an Associate Editor (SUs) at Wonkhe
Tags
I think I believed in it all back then. Students would use it to make choices, back when the student finance system was supporting their ability to go anywhere other than their local university.
And universities – motivated by those decisions and a general desire and capacity for improvement – would work to drive up their scores.
But as I’ve grown older, it’s all started to seem a little implausible. Once melted into a university-wide TEF medal, pockets of dissatisfaction become something you can ignore.
It remains the case that sometimes what you’re looking at is cost of living, or disability, or the percentage of international students on a programme, all standing in for objective measures of satisfaction.
I’ve lamented the loss of the student community question at just the point universities were starting to take belonging seriously. I’ve chuckled at the top performers on the SU question every year that don’t, er, actually have a students’ union.
I’ve sounded off about the repeated failure to survey PG students as their numbers (and their wallets’ contribution to the UGs we do survey) have grown exponentially. I’ve grown tired of OfS sitting on years of free text comments and never deigning to do us even a little light analysis on what might lead to the scores we see.
DK has your headlines. Here I’ve pulled out a bunch of other moments making me wonder whether the theory of change embodied in Father NSSmas is actually real.
A quick note on method – unless I say otherwise, everything below is the taught population (students taught at a provider, wherever they’re registered), and where I talk about institutional patterns I’m working with the 130 “mainstream” universities in the Complete University Guide league table rather than the full list of 450-plus providers. Sector-wide claims come from the UK-level rows and the OfS student characteristics data.
A survey that can’t tell anyone apart
The theory of change starts with choice. Applicants were supposed to look at the scores, compare, and vote with their UCAS form. That only works if the scores differ.
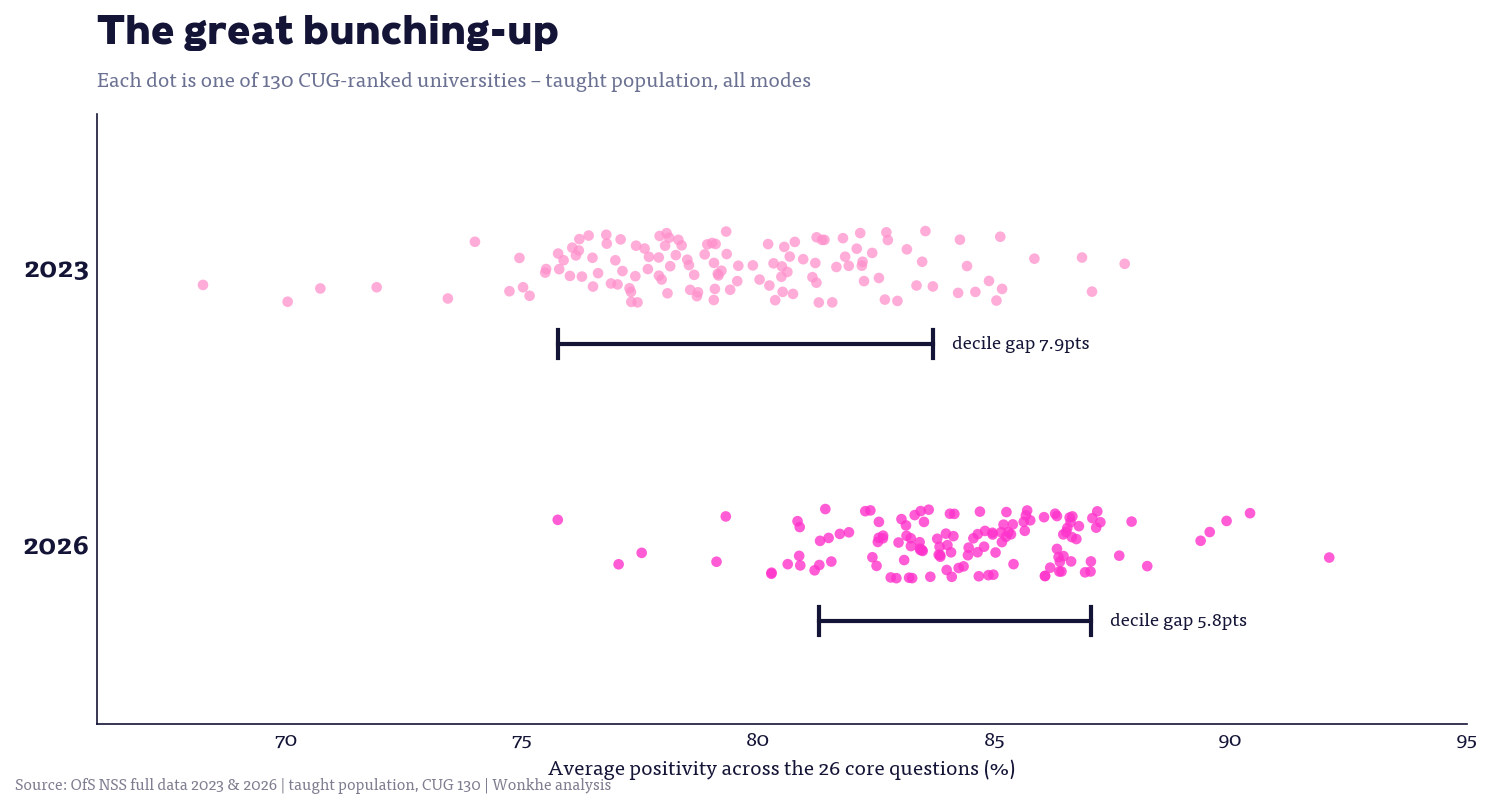
Across the 130, the spread between universities has collapsed – the standard deviation of overall positivity has fallen from 3.4 to 2.5 in just four years, and the gap between the top and bottom deciles from 7.9 points to 5.8.
It has narrowed on every single one of the 26 core questions. The lowest-scoring university in 2026 would have been comfortably mid-table in 2023. An applicant using this year’s NSS to choose between mainstream universities is, for the most part, choosing between an 84 and an 86.
And it’s getting harder to be good, not just harder to be bad. Since 2023 the number of results materially above benchmark has fallen by 28 per cent, nearly twice the fall in results materially below.
The survey is losing its ability to identify excellence faster than its ability to identify trouble. With the top question now at 93.6 per cent nationally, that’s less a moral observation, it’s an arithmetical one. The instrument is running out of scale.
Everybody has won, and all must have prizes
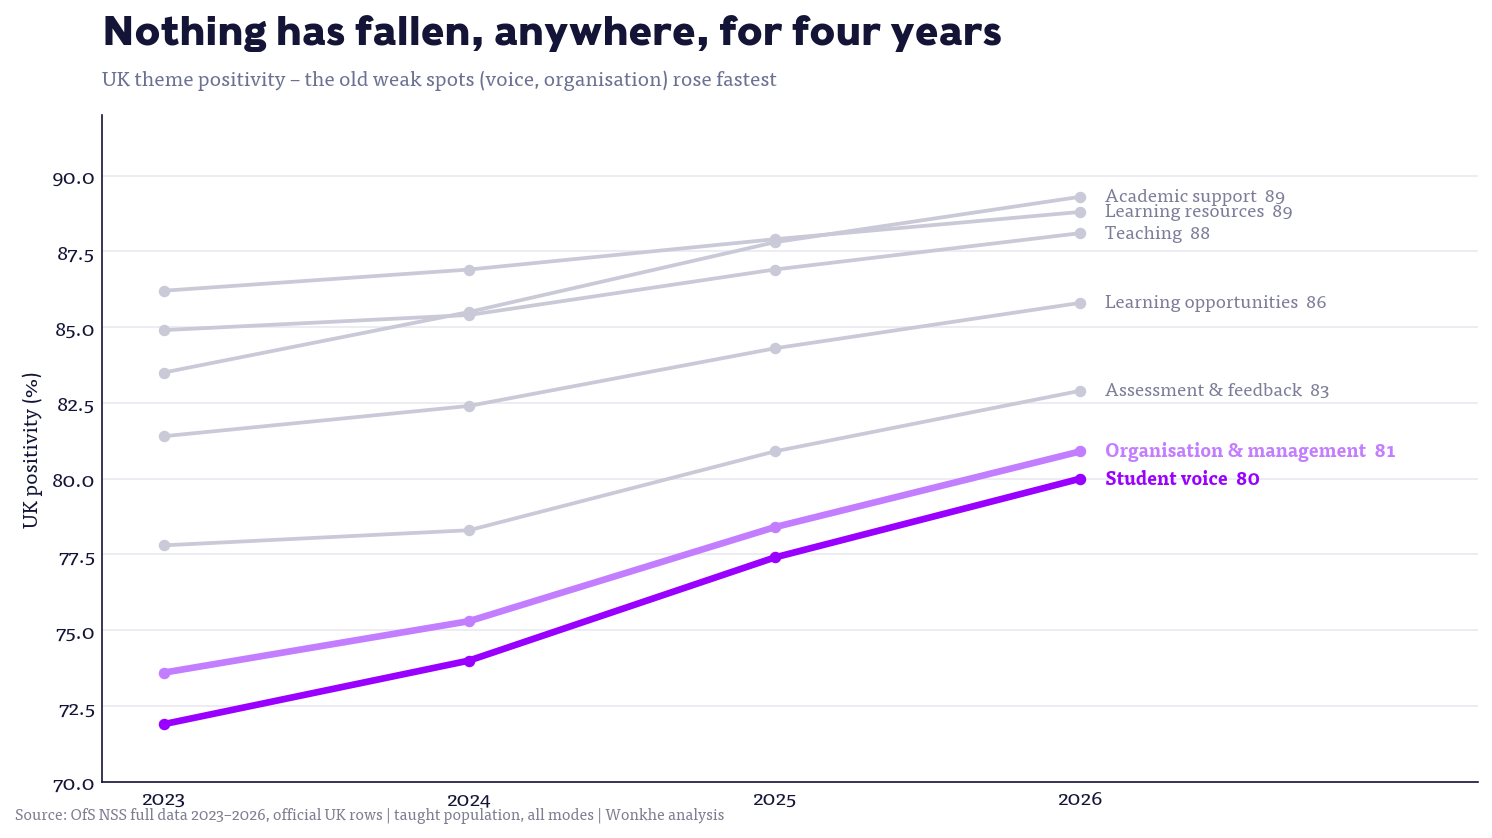
We’ve now seen four consecutive years in which not one theme or question fell nationally. This year 115 of the 130 improved, and 125 now sit above their 2023 score.
Every one of the 21 subject groups has improved since 2023. So has every demographic group in the characteristics data – every age band, every ethnic group, every disability type, every mode.
When only four institutions in the country are capable of declining, “improved on last year” stops being information.
There’s one bit that that has convinced me something structural is going on. In the early years of the rebuilt survey, a big rise one year predicted a fall the next – ordinary regression to the mean, the signature of noise. That relationship has now vanished entirely (a correlation of –0.28 between successive year-on-year changes has become 0.01).
In other words, improvement has become persistent. Which is exactly what you’d expect once providers install permanent machinery for managing the metric.
Just look at where the improvement has landed. The two biggest theme rises of the whole era are student voice (up 8.1 since 2023) and organisation and management (up 7.3) – precisely the two themes providers were being beaten up over in OfS press releases of old.
The fastest-improving question in the survey is “it’s clear that students’ feedback is acted on”, up 10.7 points. I don’t doubt some of that is real. But a chunk of it looks like what it is – closing-the-loop comms campaigns, “you said, we did” screens in receptions, action plans about the action plan. The sector got better at the survey. Whether students’ lives got 10.7 percentage points better is a different question that the survey can’t answer.
One more tell. The universities that have engineered spectacular turnarounds almost all plateau at around 85 to 87 and stop. You can manage your way to about 86. Then the technique runs out – which suggests the technique wasn’t really about the underlying thing.
Measuring something – just not the thing
The composition problem your NSS-sceptic colleague always mutters about is visible in the sector data, and it’s not subtle.
Students aged 31 and over score 88.9 against 84.1 for under-21s. International students run positive even after benchmarking. Disabled students run 3.4 points below their peers. Meanwhile the 31-plus population is up a quarter in three years, disability disclosure is up 22 per cent, and the EU cohort has collapsed by 61 per cent. Change your intake and your score moves – no quality improvement required.
Stranger still is what I’d call the expectations gradient. The most satisfied students in England are from the most deprived neighbourhoods – quintile one scores 86.3 against 83.5 for the leafiest quintile, a gradient that runs cleanly in the “wrong” direction. First-in-family students are more satisfied than students with graduate parents, and the gap is growing. Care-experienced students have moved above benchmark. Either the sector serves disadvantaged students brilliantly – a story I’d love to believe – or satisfaction partly measures the distance between experience and expectation, in which case the NSS systematically rewards recruiting students who expect less.
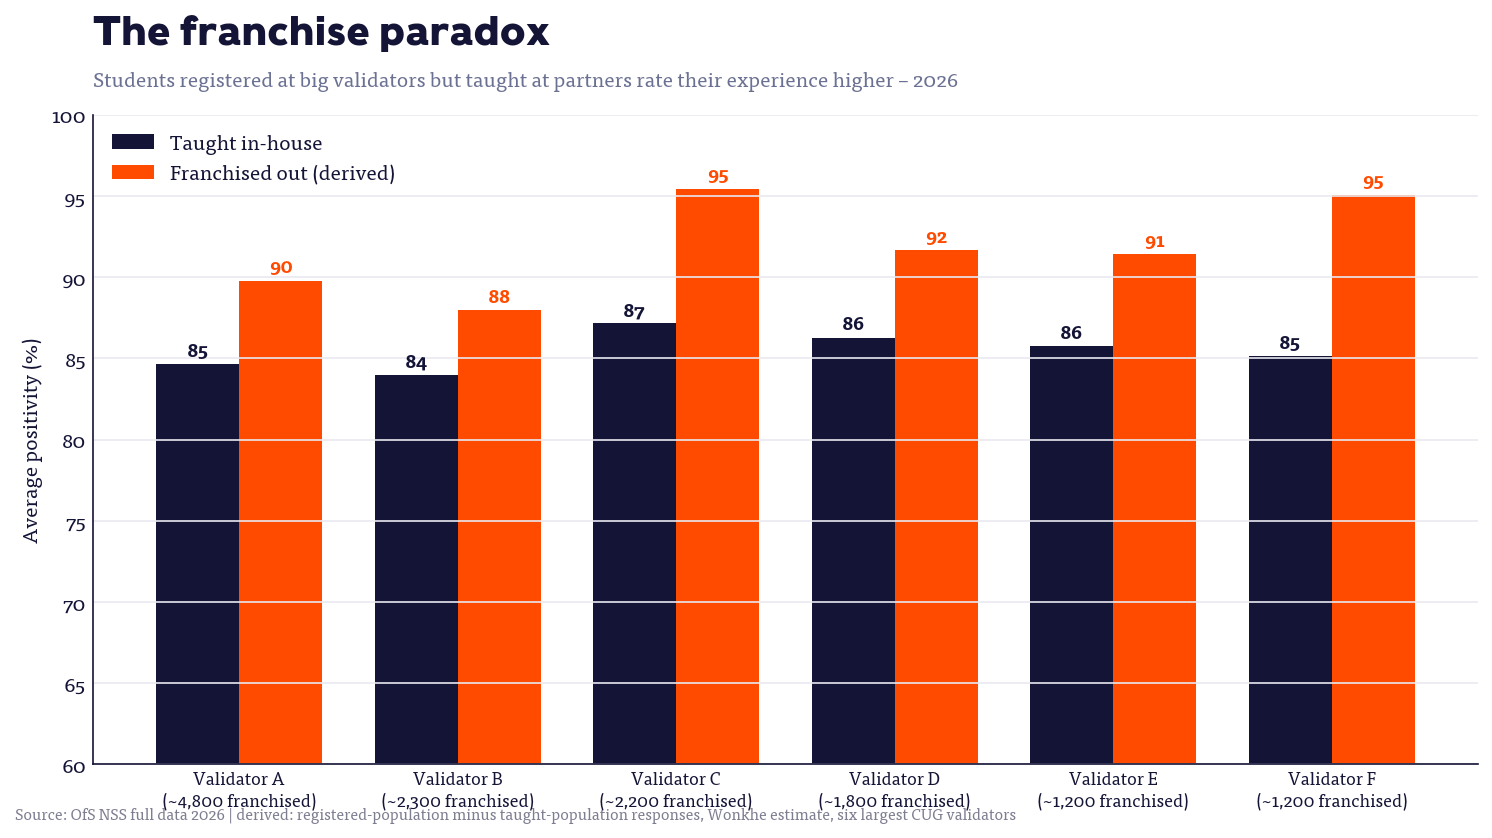
And then there’s franchising. This one needs careful wording because it’s my maths rather than a published figure – the data reports each university twice, once for students taught there and once for students registered there, and subtracting one from the other isolates the students registered at big validating universities but taught elsewhere – franchised out to partners.
Across 20 large validators, roughly 19,000 such respondents per question average 89.3 per cent positivity against 85.0 for the same universities’ own campuses. At some validators the derived partner-taught score pushes 95 – effectively the ceiling. The regulator regards franchising as the sector’s biggest quality scandal. The sector’s flagship quality survey says franchised students are its happiest. At least one of those two positions must be wrong, and the NSS gives us no way of knowing which.
The SU question, honestly
As I’m spending my summer in seminar rooms with SU officers, indulge me for a sub section.
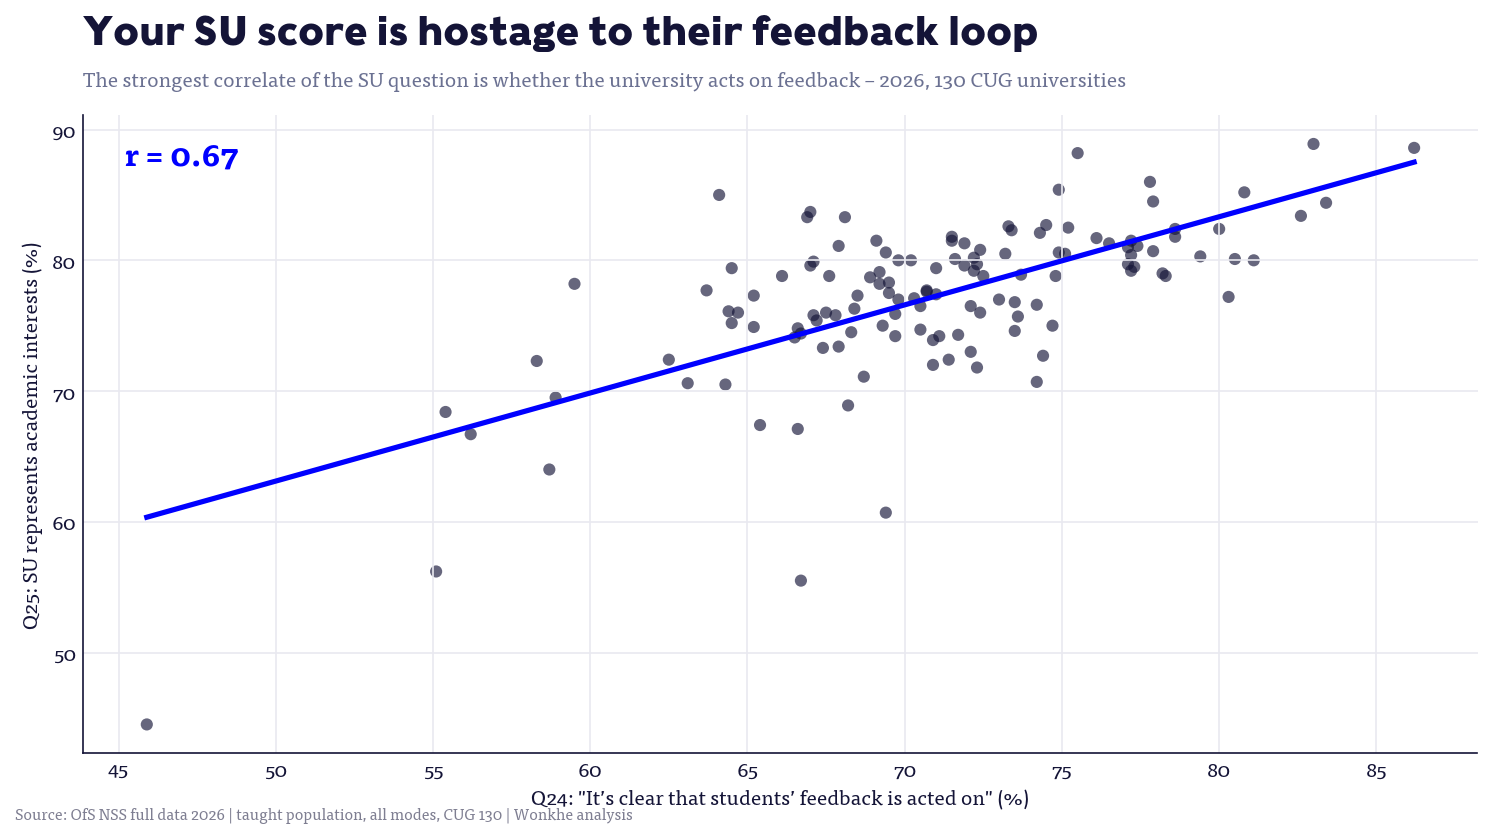
The strongest correlate of the SU question anywhere in the survey is not anything a union controls. It’s Q24 – whether the university acts on feedback – at a correlation of 0.67 across the 130 this year, far ahead of the link to overall satisfaction. SU scores are substantially hostage to whether the institution closes feedback loops. Officers get praised or berated on a number their university half-owns.
Then there’s the visibility problem. Nationally about one in seven respondents says the question doesn’t apply to them – at one university it’s over 40 per cent, and among distance learners it’s 69 per cent. The question cannot distinguish a bad union from an invisible one from a place that doesn’t really have one. Meanwhile the six collegiate universities sit 15-plus points below the sector on Q25 in every year of the data, because colleges do the belonging and the SU can’t buy visibility. That’s architecture being measured, not representation.
Who’s still filling it in
The response rate headline – 71.8 per cent, the envy of every pollster – hides a fascinating sorting. The lowest response rates in the country are now all at the high-tariff and collegiate end – 53 per cent, 54 per cent, several below 58, falling year on year while everyone else holds steady.
The institutions whose students are most sceptical of the survey are gradually opting out of it, which flatters everyone’s comparisons and nobody’s understanding.
The survey also has its own gender gap – men respond at 68.7 per cent against women’s 74.0, a bigger gap than most of the satisfaction gaps it reports – and distance learners respond at 55 per cent. Every headline number slightly over-weights the people the survey already reaches best.
Four years of good news, and not one gap closed
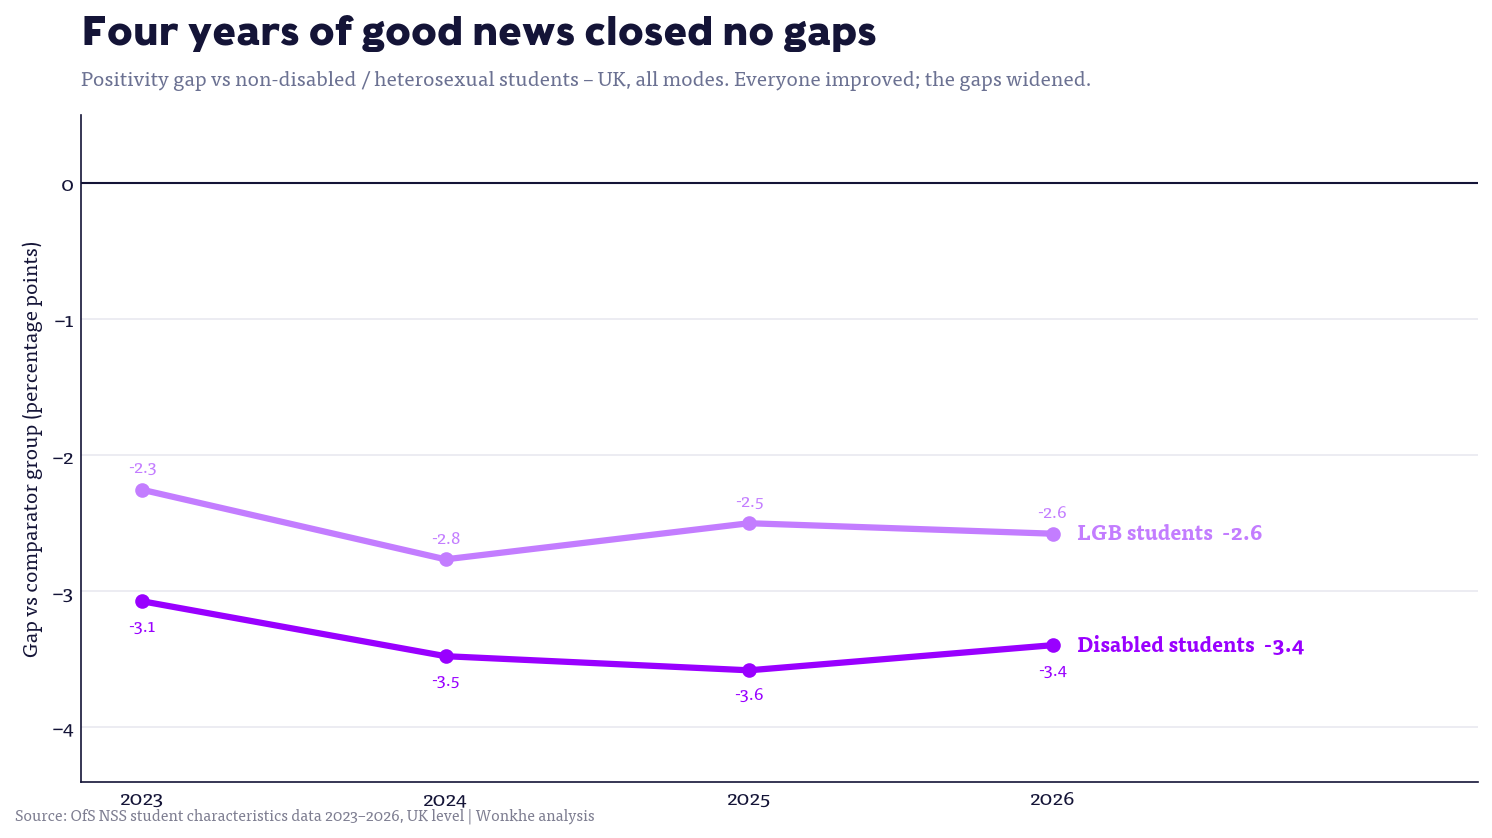
One observation I keep returning to is that across four years in which every group improved, the disability gap widened – from 3.1 points to 3.4. So did the gap for LGB students. Students with multiple impairments – a population up 56 per cent – went backwards against benchmark. Students with social or communication impairments flipped from above benchmark to below it.
If the NSS exists to drive improvement, the groups who most needed improvement got the least of it. The survey documents the same inequalities annually, with laser-like precision, and demonstrably doesn’t move them. A rising tide, it turns out, lifts the already-buoyant fastest.
Show an interest in your own framework
In England, the B conditions of registration spell out what students are entitled to – and the NSS asks about remarkably little of it. B1 requires courses to be up-to-date, but there’s no question on whether content reflects current thinking in the field.
B1 requires courses to be coherent, with an appropriate balance of breadth and depth – nothing, at exactly the moment module choice is being cut.
B2 requires a staff team “sufficient in number”, with enough staff time per student and “minimal impact” from staffing changes – the NSS asks whether staff are easy to contact, not whether there are enough of them, and stays silent through a redundancy round.
B2 requires learning resources to be provided without additional charge (hidden course costs – unasked), careers support (unasked), and support to avoid academic misconduct (unasked, in the age of generative AI).
B4 requires credible assessment that protects the value of the award – the NSS asks whether marking felt fair, not whether the degree will hold its worth.
The regulator sends investigation teams into providers to check these things precisely because its flagship survey of 360,000 students never asks. A reformed NSS could start from the rulebook – if students are entitled to it, surely students should be asked about it?
The case for reform is completion, not failure
The good news in overall satisfaction is real. The rise isn’t a response-rate artefact – the correlation between response-rate changes and score changes is effectively zero. It isn’t mild-agreement inflation – strongly positive answers rose faster than positivity itself, and the strongly negative share fell again this year. Nobody detectable is gaming it at scale.
Which is, for me, the problem. The NSS worked. Two decades of it drove genuine, verifiable process improvement, and the processes duly improved. What’s left is a survey where everyone scores about 86, nobody can meaningfully rise, hardly anyone can fall, the choices it was built to inform can no longer be made with it, and the inequalities it reveals don’t respond to it.
Handily, we don’t have to imagine what better looks like – other countries run national student surveys built on different theories of change.
Ireland’s StudentSurvey.ie is an engagement survey that asks first years as well as finalists about the whole of student life. The Dutch NSE surveys nearly every student in the country about their programme, and publishes the results as course-choice infrastructure. Norway’s Studiebarometeret asks students in the middle of their programme and publishes distributions, response numbers and context alongside the scores. None is perfect. Each fixes something the NSS can’t. Between them, and the evidence above, a reform agenda more or less writes itself.
The NSS surveys people on their way out about a service they can no longer receive. Norway asks second years, Ireland asks first years and finalists both. A mid-course instrument turns “improvement” from something done to next year’s cohort into something the current one might actually feel – and it would tell us whether the closing-the-loop machinery is real, because the same students would still be there to check.
Ireland asks about accommodation, finance, paid work, commuting, caring, belonging and whether students have considered withdrawing. The NSS asks none of this – which is exactly why cost of living, disability and intake mix end up silently standing in for “satisfaction” in the scores. Measure the conditions directly and the composition problem becomes a finding instead of a confounder. And yes – this is where the belonging and community question comes back.
Norway publishes programme-level scores with distributions, respondent numbers, standard deviations, history and programme facts, behind sensible robustness thresholds. If applicant information is the point, that’s what informing an applicant looks like. A single positivity percentage converging on 86 everywhere informs nobody – and if we’re not willing to publish properly, we should stop claiming choice as the justification.
Ireland runs a dedicated postgraduate research survey and covers taught postgraduates – the NSS covers neither, and the data above shows it barely functions for distance learners and apprentices even where they’re in scope. A national instrument that misses postgraduates, half-misses distance learners and under-hears men is measuring an undergraduate campus experience that is a shrinking share of the sector.
The one place the NSS still discriminates powerfully isn’t between institutions – it’s between students. Disabled students, LGB students, distance learners, the expectation gradient. Ireland’s survey exists under statutory monitoring duties; ours could too, with the characteristics release as the main event, and gaps that don’t close carrying consequences.
Ireland gives institutions their own data and publishes national reports – no league table, no medal. It is surely not a coincidence that the survey with the least riding on it is the one that still asks interesting questions. Twenty years of TEF medals and marketing licences have taught UK providers to manage the metric, and the metric duly stopped moving. An instrument nobody can win is an instrument nobody needs to game.
Father NSSmas isn’t real. But the presents were – and the grown-ups in Dublin, Utrecht and Oslo have already worked out where to shop.
The NSS never really discriminated at provider level, look at subjects (or if they were published courses) and you’d see much more variation and that’s where the value lies. Sure, at subject level some of the variation will be statistical noise but a lot of it represents genuine issues that providers spot tackle and the experience improves, this is all at course level and probably on one question so the impact on the provider overall might be small, fractions of a percent, but huge for that cohort. The reason you see the plateau is almost certainly that you go from fixing systemic provider wide issues to local issues.
Of course there will be improvements caused by actions such as closing the feedback loop but they still lead to courses where the provider can effectively articulate why the course should be the way it is, I don’t see that as a failure.
You are right that the franchise paradox is almost certainly influenced by only asking final years but maybe there’s something about these providers and what they are offering students that means asking for their views isn’t really getting at the truth in a way that it would in a provider/student dynamic where both sides are focussed on educating students.
Of course we need a PG survey and the OfS have said they will explore it as part of including PG in the TEF but the lack of progress is astonishing considering HEFCE and its partners had a survey ready to go in 2017, maybe the new chief executives will actually unblock it but I am not holding my breath.
I agree with you on the subject level discussions, although I’ve found that in some instances some lower scoring courses have not objectively had their issues dealt with because it is masked by the institutional score – so sometimes it works the other way.
Having been near those discussions, the real reason why the PG survey doesn’t exist is the sector itself. OfS pushed towards it, but the sector circled the wagons that ‘it’s not tenable for X administrative reasons’.
With regards to the steady increase between 2023 and 2026 you are missing one important thing: covid. Almost all the NSS open comments in my department in the last few years were about the effects of covid. In many other data sets, the covid years are clear outliers. In the NSS there is a lag because final year students are surveyed. I’m not saying this is the (only) reason for the increase, but it could be a reason.
Historically, the value of the NSS was the fact that it could give you a sense that there might be something in an area that you might need to look at further. Due to the aggregation referenced by Richard, you might get an inkling of the subject areas too (or not), but you had a starting point. If you had your own processes, none of this should have been a great surprise, but you nearly always needed to do more to understand what exactly it was telling you.
I like the idea of asking about cost of living, commuting, and the elements that make up the broader student experience, especially if the question about value for money is to be posed, but I suspect the answers might not be to the regulator or DfE’s taste.