


The first iteration of any new dataset is both more interesting and less useful than any subsequent release.
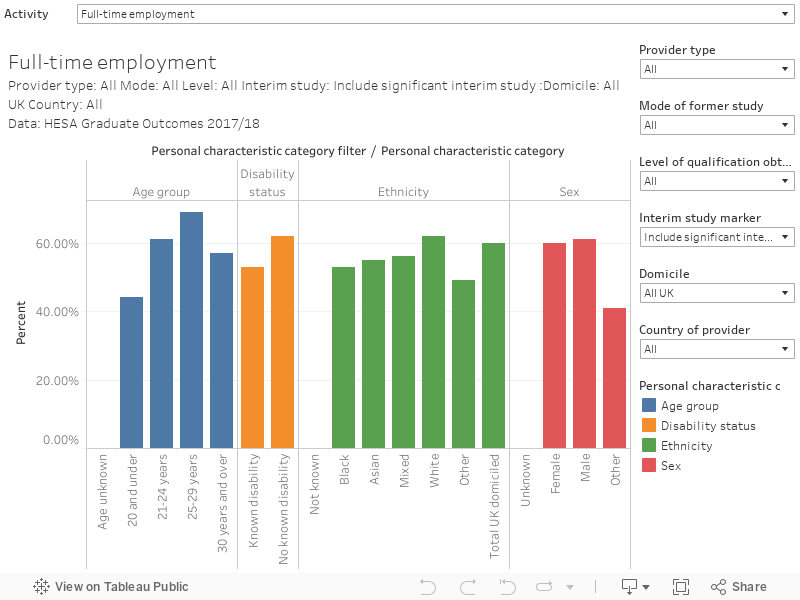
It is less useful because we have no way to put the findings in context, and no way to make any judgement about trends and directions of travel. As all survey instruments generate flawed reflections of reality and Graduate Outcomes (never, ever “GO”!), we need multiple iterations to understand what the response rate is telling us. So the headline figures – that 60 per cent of UK graduates were in full time employment (87 per cent in full-time employment or further study), or that there is an eight percentage point gap between full-time employment by ethnicity – lack context.
As with most good large-scale surveys – this being the largest annual social survey in the UK – graduate outcomes questions have been cognitively tested so we can be fairly confident that the responses are reliable in themselves.
And it is important to remember that, even though the coverage of this survey is fairly huge, it is just a survey. We don’t know – and shouldn’t pretend to know – about “all graduates”. The response rate for the UK is 52 per cent (55 per cent if you include partial responses), dropping to 47 per cent (54 per cent) for all graduates. And this is a population survey (all possible responders were contacted), where a decision has been made not to weight, for this year at least.
New data, new concepts
Talking to graduates about their experiences 15 months after they graduate from their first degree has a very interesting side-effect. It is entirely possible to squeeze a Masters, or other one-year postgraduate course, in during that time – and another qualification (or another year out of the workforce) could have an impact on employment opportunities. The key term is “significant interim study” – by default the presentation of much of this data excludes graduates with this experience.
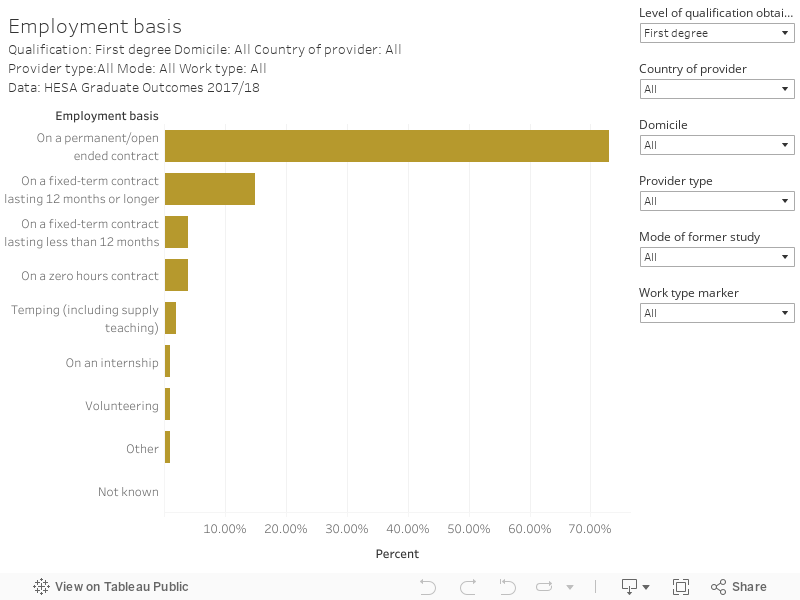
We’re also introduced to the concept of work type – the nature of the contractual (or other) basis of employment. The default filter separates out paid employment from voluntary work – but there is more detail available. As well as open ended contracts (the dominant mode), we see short and long fixed-term contracts, temping as a separate category, and also things like zero hours, internships, and volunteering.
For data about graduates are working we can flip between seeing those who defined work as an activity, or their most important activity. This is one to be applied cautiously – the concept of importance is one laden with meanings and needs to be seen in the context of the data you are looking at.
SICs and SOCs and salaries
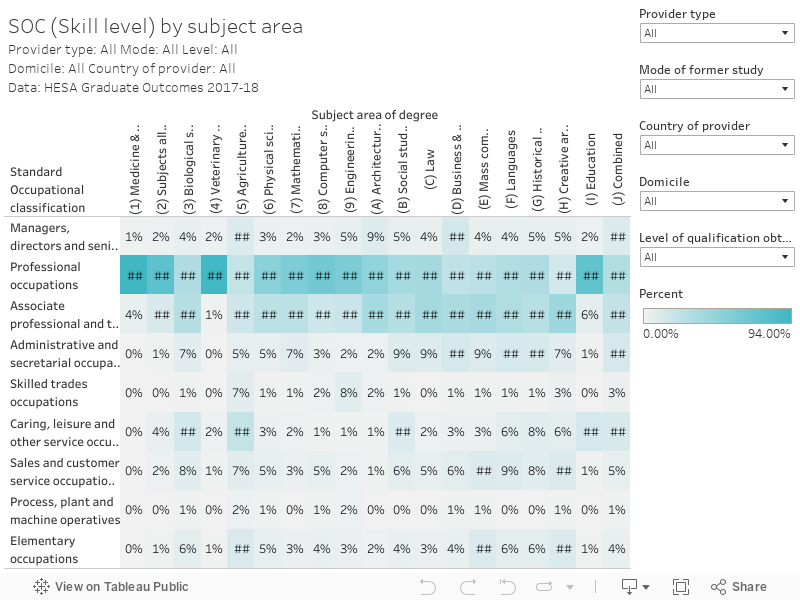
The Standard Industrial Classification (SIC) and Standard Occupational Classification (SOC) will be familiar from the bad old days of DLHE (the Destination of Leavers from Higher Education survey, which Graduate Outcomes replaces). The former defines the industry (what the employer of a graduate does), the latter the skill level based on comparing a job title against a standard list.
You’ll also recall the fun we had understanding precisely which job titles are “graduate jobs” (usually mid- or high-skilled in the new HESA analysis) using SOCs. Suffice it to say that the venerable SOC is at least arguable on many points – much of the initial concerns about this release concerned the way graduate responses were coded to SOCs.
This is where policy happens. Don’t look at ministerial statements, look at data definitions.
On this basis, the slant towards “high skilled” occupations in science students as compared to arts and humanities students (at 61 per cent, creative arts students are least likely to be in high skilled occupations, but more likely than most to be in a “skilled trade” occupation. HESA should be applauded for offering us the full list of classifications rather than the three categories.
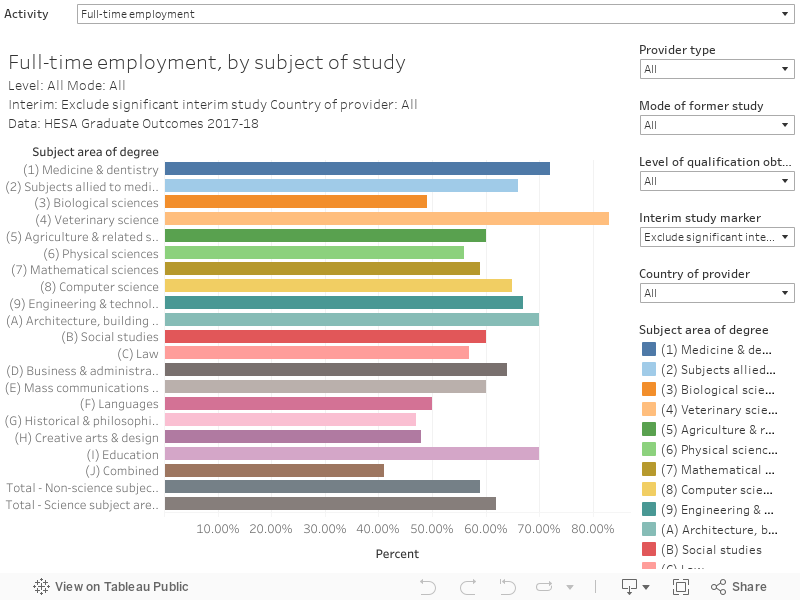
Likewise, the slight majority of creative arts graduates in retail occupations needs more qualification, both in terms of the likelihood of artists to work multiple jobs and in the way these jobs are coded in SIC. But it is also worth noting that the difference between the proportion of creative arts graduates in full time employment and a similar proportion of biological science graduates is a single percentage point.
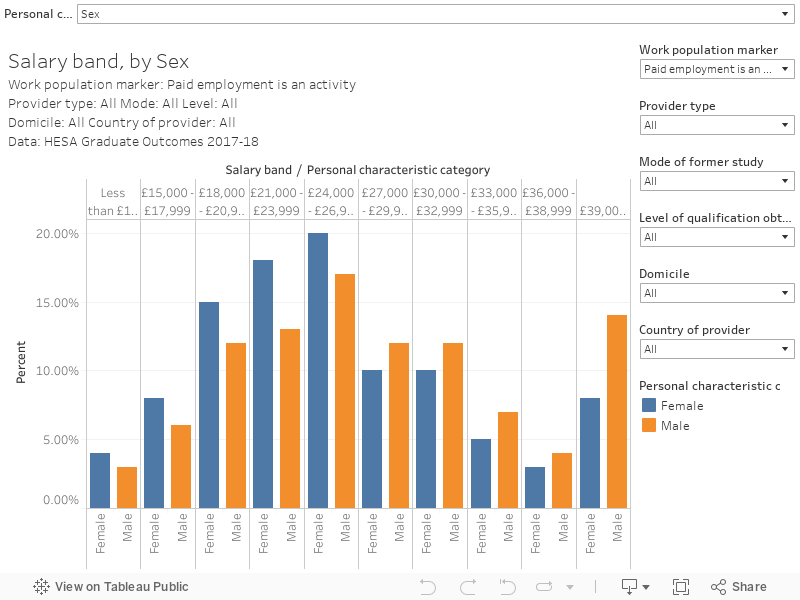
We also get salary data (based on graduate reports rather than tax receipts as in LEO), in £3,000 wide bands. Women are disproportionately represented at the lower end of this scale, men at the top, putting paid (hopefully) to the persistent myth that the gender pay gap is due entirely to career breaks. Wonderfully, LEO data for the same year is available, offering us the chance to compare reporting against reality.
Reflections
Eighty-six percent of surveyed graduates reported that they felt their current activity was meaningful (be that work, further study or other activity). Eighty percent reported that their current activity matched their future plans – which could be seen as an indication of careers being started – and seventy two percent reported that they were utilising what they learnt in their studies in their current activity.
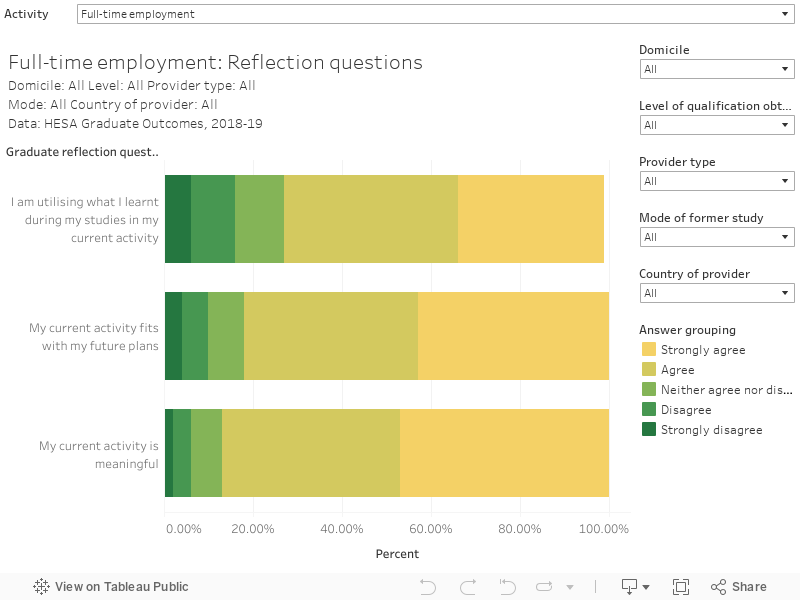
Sadly, we don’t get these responses split by subject – data that would be genuinely fascinating to compare against media shibboleths about arts students in particular. The construction of meaning within post-graduation activity is a hugely complex sociological question, these questions offer us merely a glimpse into a topic probably better addressed with qualitative methods.
My reflections
There are a few points where I found myself looking for numerical information where only proportions were provided. I don’t necessarily need to know how many graduates reported a particular outcome, more to get a sense of where I might be comparing a larger group with a much smaller one.
And there are a few presentational choices that prompt questions – I struggled greatly with figure 9 on understanding the impact of classifications – hopefully the attempt below is clearer.
But this – global pandemic and data-distorting economic slowdown notwithstanding – looks like developing into a very interesting dataset. It already feels more robust than DLHE, and the choice of questions and categories are well designed.


David, apologies for this as I’m generally a big fan of your work, but there are a couple of points of clarification to make here. Firstly, work type is not a concept that is new to GO (yes, we’re not supposed to call it that, but it happens!), it was also in DLHE. Secondly, the 15-month survey point leading to an ‘interim study’ derivation is definitely a side effect, but not so much ‘interesting’ as problematic. Surveying the UG cohort in September, a transition point between further study and employment, has caused real headaches with the data, with a discrepancy between different graduates’ interpretation as to whether or not their Master’s or MRes is ‘previous’ or ‘current’ further study, even if.the leaving date on their student records would suggest they were still in further study. Peers at Portsmouth wrote a good HEPI article on this earlier in the week, if anyone is interested. Finally, I’m afraid that rather unwonderfully, we don’t have LEO data for the same tax year to provide the comparison, as the UG responses are mostly based on employment in September 2019, the 19/20 tax year, a couple of years ahead of current LEO data. This is one reason that the promised linking of GO data to other sources (LEO and HESA Student) has not happened, as the timing of survey and data release does not allow this. I agree that the Graduate Voice questions are a good addition, and that the initial release is more wide-ranging (with more promised in the open data releases next week and early July), however given the various issues with the survey response rate, census point and other data quality concerns, I hesitate to see how the conclusion is reached that it is ‘more robust’ than DLHE. Again, sorry for this as I appreciate how swiftly, as always, you’ve pulled together this data and your insight to bring it to a wider audience, but just had to respond on this occasion.
It’s really valuable to see your take on it David, thanks. I am used to having the full dataset with me on release day, I wasn’t able to do some of the interesting cuts you have produced here.
Re: SOC, the new 2020 definitions will be coming into force in the near future and ONS developed them with an eye on the HE context (I was part of that as was the redoubtable Rachel Hewitt, now at HEPI, and HESA and GO’s own Neha Agarwal who is hopefully having a nice sit down and a cup of tea after yesterday), so they will align a little better with the idea of ‘graduate job’. I look forward to the exciting new set of heated arguments we can all have about them.
Re: the employment basis data – this was always in DLHE and was tremendously useful, I’m pleased to see it getting a bit of a better airing in GO and I’m hoping some of the less well-known data fields that were carried over from DLHE but which provide real insight can get a bit more use in the future.
The reflections questions already look interesting and I think we can do some useful work on them.
DLHE was an established dataset with 50 years of development and practise behind it, it’s going to take a while before GO gets to that point, and we must be mindful that this new dataset has a large sticker saying ‘experimental’ on it. It’s a new development, things have come up that we want to address and over the next couple of years we’ll refine it and it will be a better dataset for it. But as you rightly highlight there are some valuable things we can do now and the release marks a new period for good quality data on graduate outcomes.
Good analysis, good comments. Perhaps my favourite part of all of this is HESA explicitly telling everyone not to call it GO, and then everyone calling it GO.
I like HESA a lot (especially the very helpful Liaison team) but come on guys, you really think that higher education wouldn’t jump at the chance to use a new acronym?! Embrace it 🙂
Echo Chris’ comment – good analysis, good comments. I particularly liked the remark around gender pay gaps having basically nothing to do with career breaks.
For someone very new to this kind of data and these discussions (I hadn’t heard of SOC or SIC codes before starting my current role in October 2019 and I started using LMI tools), I found this a really accessible article and I’m looking forward to tinkering around with the tables when I have more time next week.
Hi Mark, I agree with your point about the “interim further study”. The timing of the survey in September for graduates of most UG programmes means that those who have gone on to a year-long further study course and are completing it at the end of that programme are more likely to report “unemployed”, and this is a result of their further study and the survey timing, and has very little to do with their undergraduate experience. I think we see this particularly in Law and Business, where a lot of students go directly into PG study. It’s only 1 percentage point difference in unemployment between “significant interim study” and “no signficant interim study” on a national level, but I think we may see a bigger impact by provider when we look at smaller populations. I have also seen some situations where a student continued their study at our institution, so I can look up their educational records compared to their survey response, and there were some students who reported that they were unemployed despite being currently in further study on the census date, which goes to your point about confusion between “current” and “previous” study. That said, I am glad that the filter has been provided, as I was concerned that there would be no distinction made in the data release.
It is inappropriate to draw conclusions about salaries and characteristic without conditioning the results by subject. We all know that there are disparities in the gender distribution across subjects which in turn are likely to be correlated with differences in graduate salaries. Similarly, there is a heavier concentration of BME students in some subjects with, in general, higher employability rates, Hence, lower BME employment rates overall suggests an even larger problem than this first cut of the data may suggest. So we need a bit more in-depth work here, and these caveats need to be acknowledged.
@Cillian – there’s more data out on Tuesday, which should hopefully include those tables.