

DfE data on prior attainment and completing a course of higher education
David Kernohan is Deputy Editor of Wonkhe
Tags
So the Department for Education has taken on an old Office for Students obsession by publishing data on undergraduate higher education entry and completion by prior attainment.
Why, though?
Whenever a new dataset turns up, we have to ask ourselves what the point is. Not existentially (that’s maybe another article) but why release this data at this point. The only reason I can think of to release this data right now is an attempt to reanimate the “number control via entry threshold” argument from Augar via an appeal to student rights (“it’s not fair that students who will not be able to succeed at university are tempted into getting into debt to do so”). Quite how that fits with this government’s plans (for the want of a better word), at this point, I’m not sure.
Now the first thing you would do if you wanted to make that argument would be ensure that you don’t have any confounding variables. We already know that people from disadvantaged backgrounds are less likely to complete their course, and are less likely to do well at level 2 or level 3. There is nothing in this release that allows us to distinguish between these two data points as a causal (or even correlational) factor.
The fastest way to improve completion metrics, in other words, is not to allow poor kids to go to university. A grade barrier would be the presentable way to bar some of the most disadvantaged students from entry. And that, for the avoidance of doubt, is not OK.
DfE is clear that all of this is not a “regulatory-quality measure”, suggesting that it would be foolhardy to make decisions regarding regulation using it (as opposed to merely misguided, which you would need to be to use the OfS measure, but I digress…)
What are they counting?
It’s not quite the same cut as OfS has been using – or even the same cut as the government itself as previously used. We’re looking at English-domiciled learners studying in any part of the UK (not just in England, as previously). Entry data covers 2016-17 to 2021-22, completion data covers just the 2016-17 and 2017-18 cohorts (giving five years to complete a degree). The other major change is that, unlike OfS datasets, and although DfE is relaxed about students changing their mode of study or qualification aim while studying, if you move outside your entry provider, you have failed in the eyes of this dataset.
The only provider split available is higher education provider and further education provider – the use of Education and Skills Funding Agency (ESFA) Individualised Learner Record (ILR) data is the marker between sectors here. If your data is submitted to ESFA you are in FE, if your data is submitted to HESA you are in FE.
If we are thinking of HE in FE we are most likely thinking about mature learners – and this is where the other end of this data causes problems. Level three data (derived via UCAS information submitted to HESA, or from ILR data) and level two data (derived from the Young Person’s Matched Administrative Data) is only reliably available for under 30s, and even given that the data is not of a particularly good quality – rather waspishly, the methodology document notes.
There are also several entrants to Russell Group and high tariff providers allocated to the ‘0 points’ UCAS tariff category in the dataset. The high standard of entry requirements from these providers suggests there may be some data errors.
This suggests DfE is unaware of the idea of entry via foundation year (something which many “high tariff providers” do well and make a lot of noise about). It also dismisses the possibility of admission by interview or portfolio (for example, to creative courses) or the very idea of mature students entering outside UCAS.
Is the actual data of any interest?
Well, this cut of the data gives us a 17-18 completion rate of 79.9 per cent overall for full time first degree students. OfS, in contrast, offers us 88.5 per cent overall for that year based on a different interpretation of similar data. This suggests to me that we are looking a quite a big margin of error here, and signals to me that any findings need to be subjected to the statistical process known as “bi-digital salination” before use (taken with a large pinch of salt).
Based on that, we can be reasonably confident about what we already knew – that prior attainment is a decent predictor of post-18 academic success. Level 3 has slightly more of an impact than Level 2, and people at universities tend to do better than people at FECs.
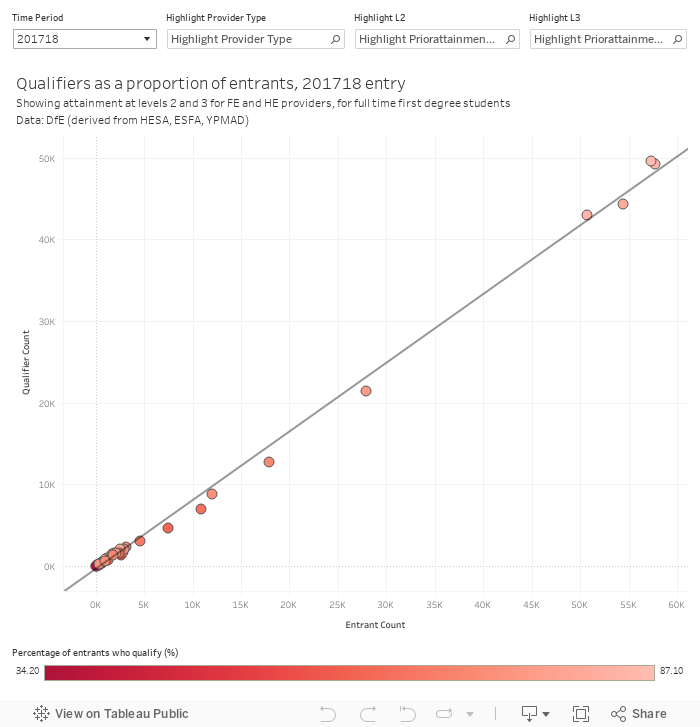
To see that visually (in possibly the dullest graph I have ever published on Wonkhe) the number of qualifiers and the number of entrants are closely linked (overall, r squared is 0.99 with p at <0.0001) and given the low quality of data any differences are as likely to be statistical noise as anything else. Factor in a similar level of correlation between L2 and L3 attainment and disadvantage and we have learned almost nothing other than the imposition of any kind of grade boundary for higher education entry would achieve almost nothing.
While not necessarily defending the precise approach that DfE have taken with this release I do feel this article is more than a little disingenuous. It is important that there are data that help universities and others understand how various factors correlate with propensity not to complete, could this be done better than it has been in this release, almost certainly.
If you take time to read the notes DfE do explain at least five percentage points of the eight that exist through the 3 percent that to use OfS’s incorrect language “transfer” and the 2% of students who complete after 5 years (I know adding this 3 and 2 together isn’t strictly right but it’s ballpark). I also think DfE have been stricter on what counts as success, OfS are quite generous.
Finally, while the chart may be the dullest ever produced it is also deeply flawed, any chart with outliers of this type will show a high correlation, it’s made worse by the fact variation in drop-out is low relative to the high proportion completing meaning the input and output have high correlation. However, I don’t think anyone would argue that the fact A*A*A* students have an 86% completion rate while “EEE to <DDD" have a 63% completion rate is non-stat, to be clear that means you are two and a half times more likely to drop out at the bottom end of the grade distribution than the top.