What’s going on with young people, students and the labour market?
Jim is an Associate Editor (SUs) at Wonkhe
Tags
Advance HE said that that was 16 percentage points higher than 2015 when 43 per cent of students had a paid job – although I covered why we ought to not necessarily trust those numbers in the write up on the site.
Given the number of vacancies in the economy, the idea that that is in part driven by more students who tend to be in the “economic inactivity” category, and the news that the Treasury is lobbying to lift the 20 hours work limit for international students to try to fill some of the vacancies, I thought I’d look up the latest figures from the Office for National Statistics (ONS) Labour Force Survey (LFS) to work out what’s going on.
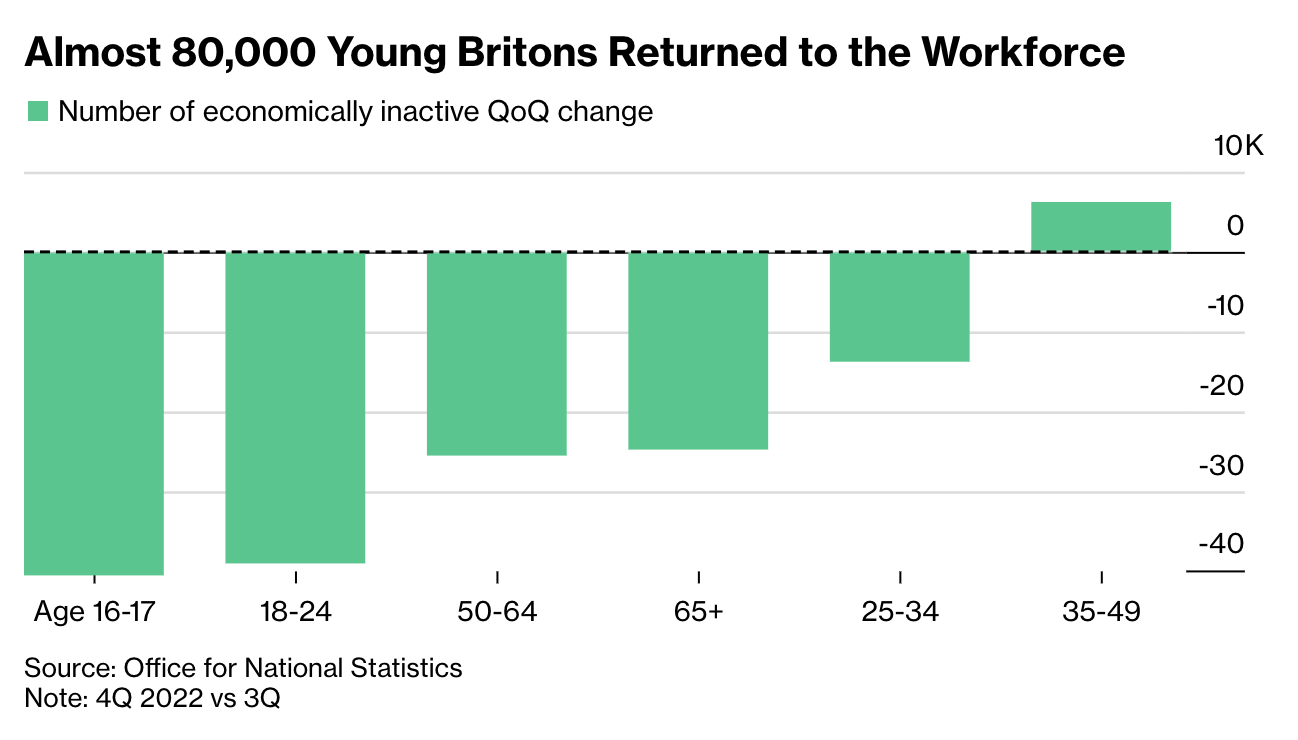
When the quarterly numbers appeared last week, Bloomberg reported that young people returning to the workforce underpinned a record net increase in the number of people coming back into the workforce, with “134,000 fewer students in the economic inactivity figures” compared to the previous three months.

That, says Bloomberg, helped to reduce the overall rate of workers either not in work or not seeking jobs by 0.3 percentage points to 21.4%.
But hold on. Does that mean fewer students overall (many of which aren’t working), or fewer students that are working alongside their studies?
If the former that ought to sound alarm bells about student numbers this year. If the latter it ought to be a worry for those of us hoping that the government (and specifically the Treasury) might do something about maintenance.
If international students and home students alike are all working more and the sky isn’t falling in, why would you go and spoil it all by doing something stupid like increasing maintenance by inflation, or keeping the cap on international students working?
Naturally, it’s not that simple. Before we get into this I should note that the way in which students in PBSA are counted in these figures is to ask their parents to declare for them, given the random postcode spinner that ONS uses doesn’t cover halls.
Not only ought we to question whether parents are going to offer up an accurate picture here, this also means that international students in halls are simply missing from the figures altogether – which feels like a problem.
It’s also worth noting that while we can see who is and isn’t in work amongst those in full-time education, we don’t know if that is in higher education or not – at least not from the tables on the ONS site.
Nevertheless the numbers are interesting. If we look at Q4 Oct-Dec, the number of 16-24s that were marked up as economically inactive (not in work and not looking for it) fell 44,000 from Q3 – although only by 3,000 year on year.
If we narrow in on 18-24s in full-time education (the closest we can get to HE participation), the number marked as economically inactive fell by 18,000 QonQ, although only 9,000 YOY. Because that figure excludes those looking for work, it obscures the number of FT students in PT work a bit – that’s up 12,000 QonQ but actually fell 52,000 YOY.
Okay, okay, you say – can we look at percentages? In the final quarter of last year, 36.1% of FT 18-24 Y/O students were employed, down from 36.5% the previous quarter and 37.4% YOY. Hardly high drama.
But here’s the thing. If we just look at the ONS figures and compare Oct-Dec with Sep-Nov, what we’ve seen for the past five years is a bump up in the numbers of those in full-time education as the academic year starts.
Last year there was a 41,000 jump, the year before 48,000, and in 2018 it was a bump of 43,000. But this year there wasn’t a bump. This year there was a fall as the academic year began of 48,000.
Now you might think “ah, but that’s a fall from an unprecedented increase last year” – but that was largely already priced in the usual fall in the figures since January.
So maybe it is the case that participation is starting to be impacted by the draw of employment – the counter cyclical to the counter cyclical, if you will. Perhaps we’ll know more once OfS gets around to publishing this year’s Higher Education Students Early Statistics (HESES) survey data.

