

What is the franchising boom doing to drop-out?
Jim is an Associate Editor (SUs) at Wonkhe
Tags
The first was the old cold spots argument – places where there is not a university, but where people want to study for a university qualification locally.
Can we test the claim? Not really. There isn’t a published dataset that gives us location of study by subcontracted status.
We sort of got close a while ago. HEPI published a report on the “explosive” growth (up x 8 in a decade) in foundation years – their role in access (three in ten hold no qualifications, two thirds are mature), what they’re studying (there’s a lot of business studies) and the less than stellar completion rates of those on them.
But famously, the problem with that report and the Department for Education (DfE) dataset that signalled similar things in 2023, was all about the word “at”.
When that ad-hoc the DfE dataset – produced to justify the decision to “defund” (or at least reduce the tuition fees for) foundation years – it asserted that there were 105 English providers of foundation years in 2021/22, that 23 of these providers were based in London, and that 42 of the 105 providers had a low or unknown tariff in 2021/22 – similar findings to those in HEPI’s report.
I naturally asked DfE to clarify what the word “at” meant – and it came back and confirmed that “at” meant the provider a student was registered at rather than taught at.
Anyone that’s been following the TikToks advertising the for-profit private providers that offer business degrees out of barely converted office blocks will know that they’re hardly in cold spots – they’re pretty much all based around the edges of London and other big cities.
The hypothesis was that subcontracted out provision is where much of the growth has been, and the other hypothesis was that outcomes, characteristics, etc will also all differ depending on whether students are “taught and registered” or “registered and contracted out”.
When I asked DfE why it hadn’t broken out subcontracted from taught, DfE asserted to me that “providers who subcontract their provision do so to local colleges”, and so “the region of the student wouldn’t differ”.
With my jaw on the floor, I pointed out that a significant number of students registered with Canterbury Christ Church, Bucks New, Bath Spa, Suffolk, Leeds Trinity, Bedfordshire and so on were almost certainly being taught at providers outside of the region, to pretty much no response.
DfE also said to me that the “only” outcomes metric which could be influenced by subcontracted provision is completion rate – suggesting that other outcomes measures “wouldn’t be that influenced” if their foundation year was subcontracted “since in most cases they would still undertake year 1 and the rest of their undergraduate studies with the registered provider”.
My jaw now nailed to the floor, I pointed out that that was likely nonsense – the growth I’d seen in the franchised-to for profits was in the whole degree, with a foundation year attached, being offered. DfE stopped responding at that point – but that gives us a sense of how prepared the department has been for what’s happening now.
HEPI’s report made the same mistake – asserting (for example) that the East of England had 20 per cent of FY students without wondering whether Anglia Ruskin or Suffolk’s numbers might be franchising.
You’d think we’d be able to interrogate OfS’ size and shape dashboard – nope. The outcomes dashboard doesn’t help either. There could, I suppose, be a way of finagling something out of UniStats/DiscoverUni, but ripping student numbers from there would also involve rationalising whichever level of subject hierarchy is in use too – and life’s too short, even for me.
Basically, we don’t know.
The other argument was the old access and participation one – and there we do have much better data. The standout in this chart is the woeful performance on much more expensive to support disabled students:
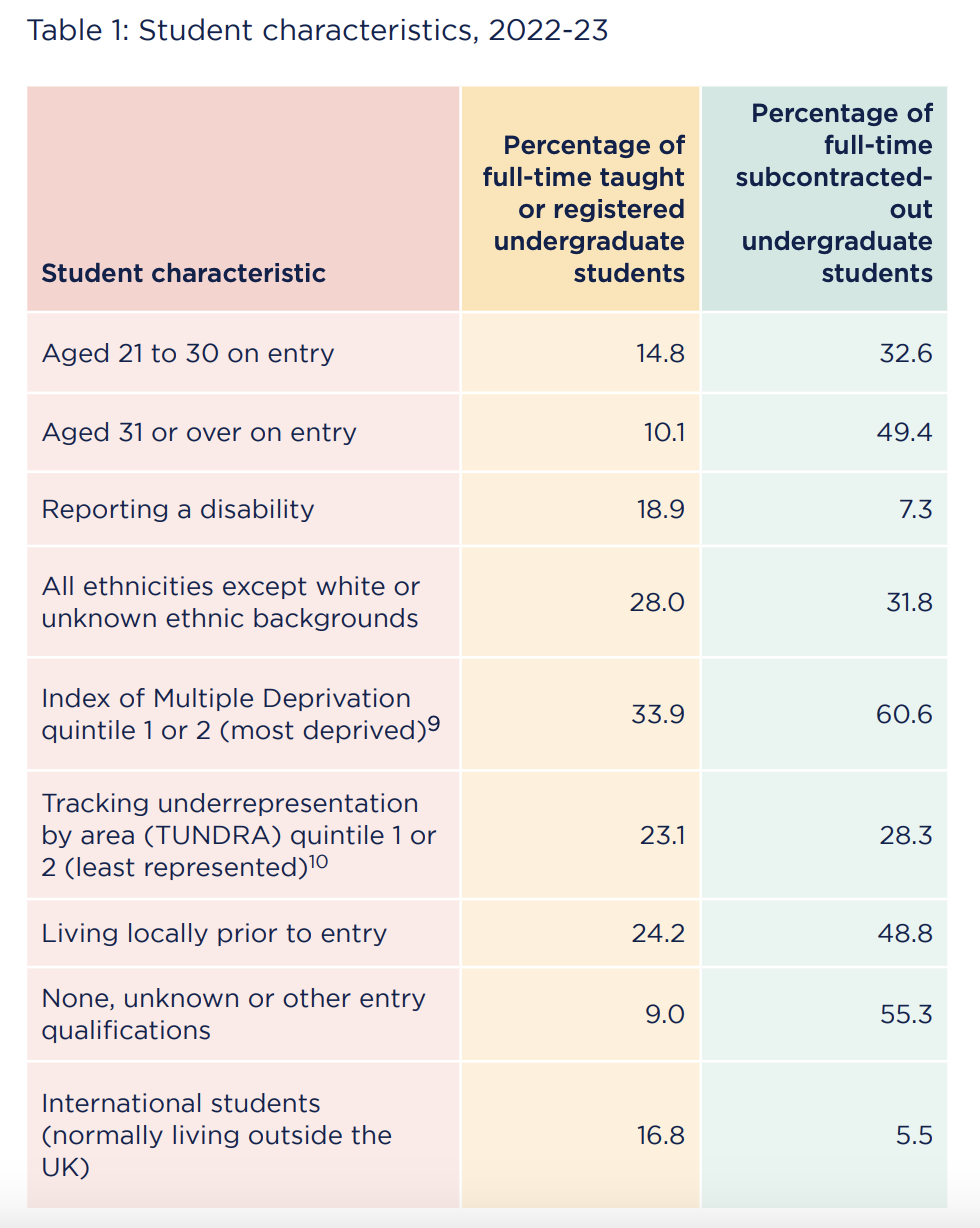
Also included was this natty little chart – which is impossible to recreate unless you work inside OfS:
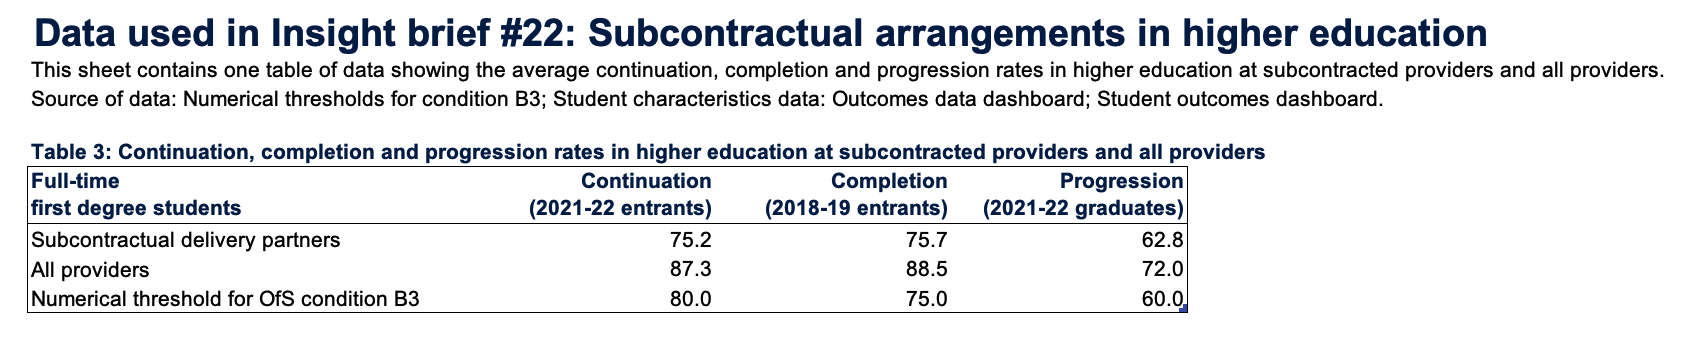
Who knows what those numbers are going to look like in coming years as the volume ticks up and the lag starts to show up in the completion and progression.
You’ll notice that what that chart doesn’t show us is how those numbers have been changing, and we also don’t get to see “taught and registered”, ie not franchised outcomes – OfS hides that in the supplied data.
We can get fairly close. If we ignore the data suppression rows, accept the rounding and then tot up the totals for each provider, first we can see the “all providers, all students” result for the past four years – continuation for 21/22 entrants 86.9%, 20/21 = 88.6%, 19/20 = 91.0% and 18/19 is 90.8%.
The published sector-wide figures are 87.3%, 88.9%, 91.1% and 90.9% – all within 0.4pp is close enough.
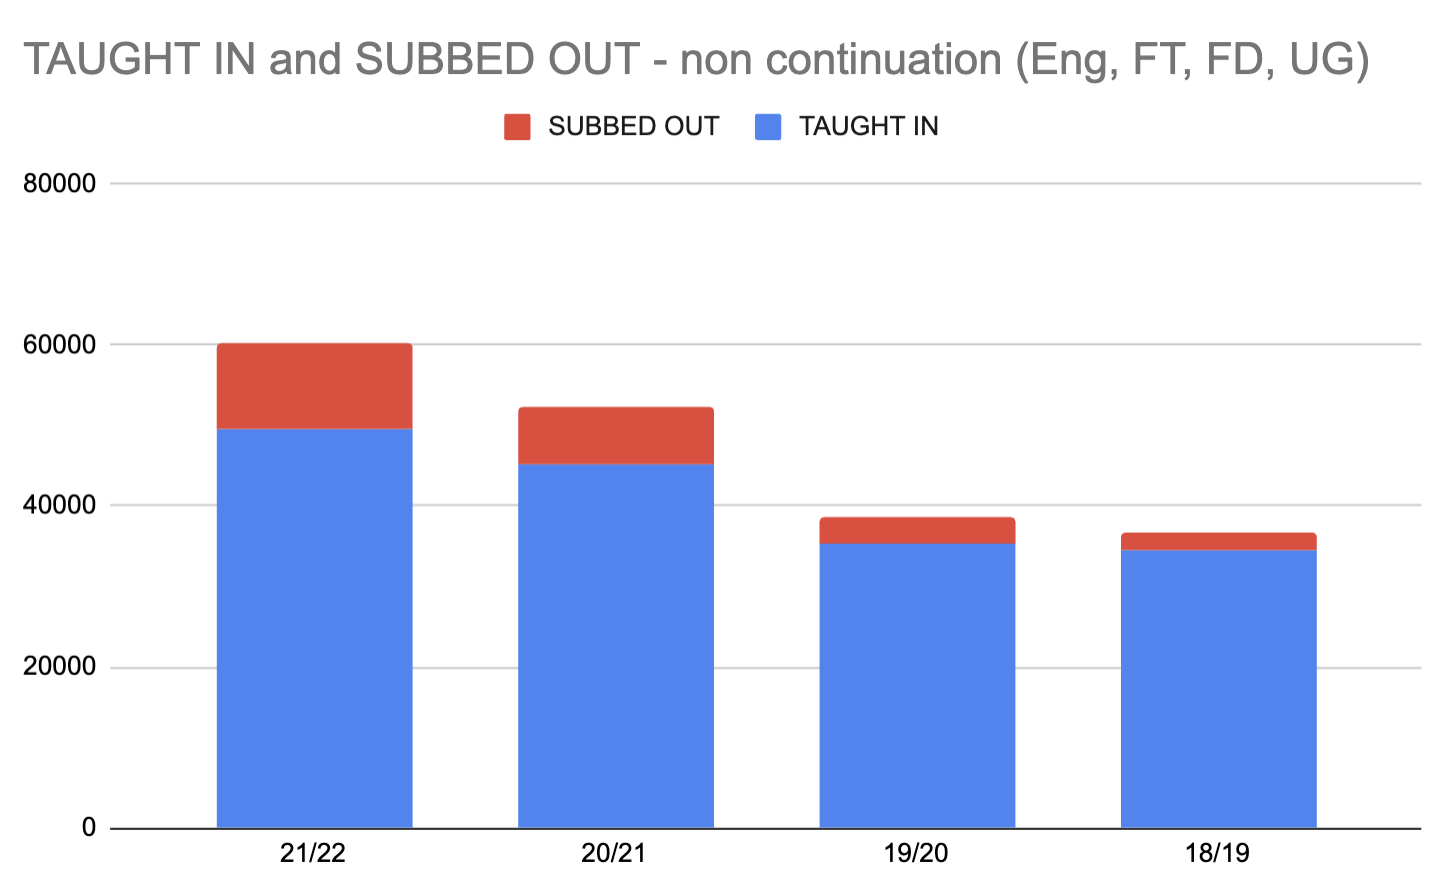
If we then pull out “taught and registered” using the same method, we can see the “source” of non-continuation:
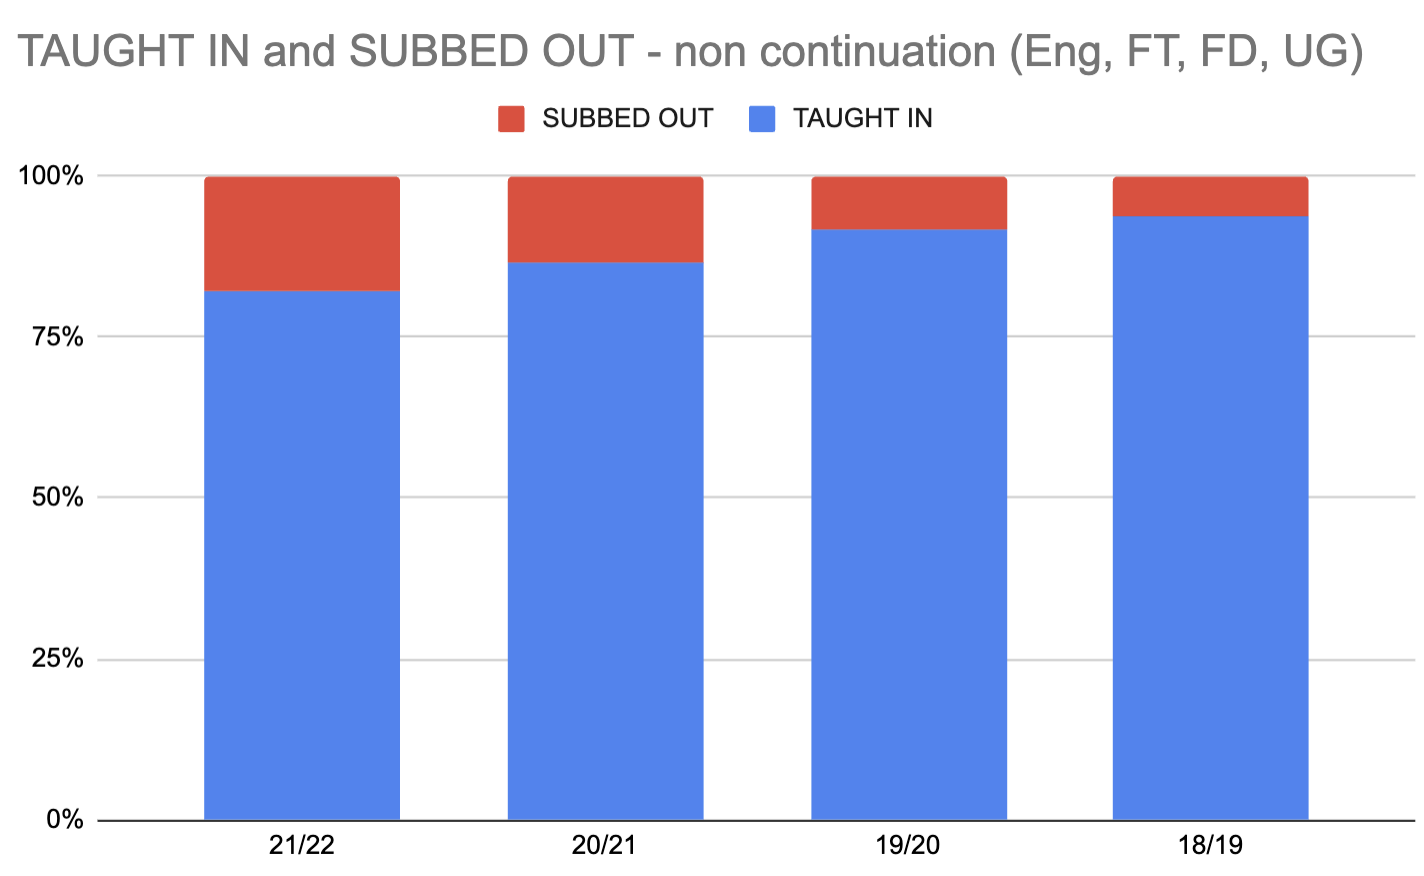
Which, expressed another way, looks like this:
I’m not optimistic about what that chart will look like when we get the next dump of data for 2022-23 entrants – and given the very rapid expansion we’ve been seeing in HESES into 2023-24 and 2024-25, what I can actually foresee is doom – both on the headline figure and the “where the dropouts are coming from” view.
We could even stretch credibility a bit and have a punt at projecting what next year’s result will look like. And you’ll see that on current trends, the projection is that the continuation rate will dip below OfS’ “minimum” threshold of 80 per cent – thanks to the franchising boom:
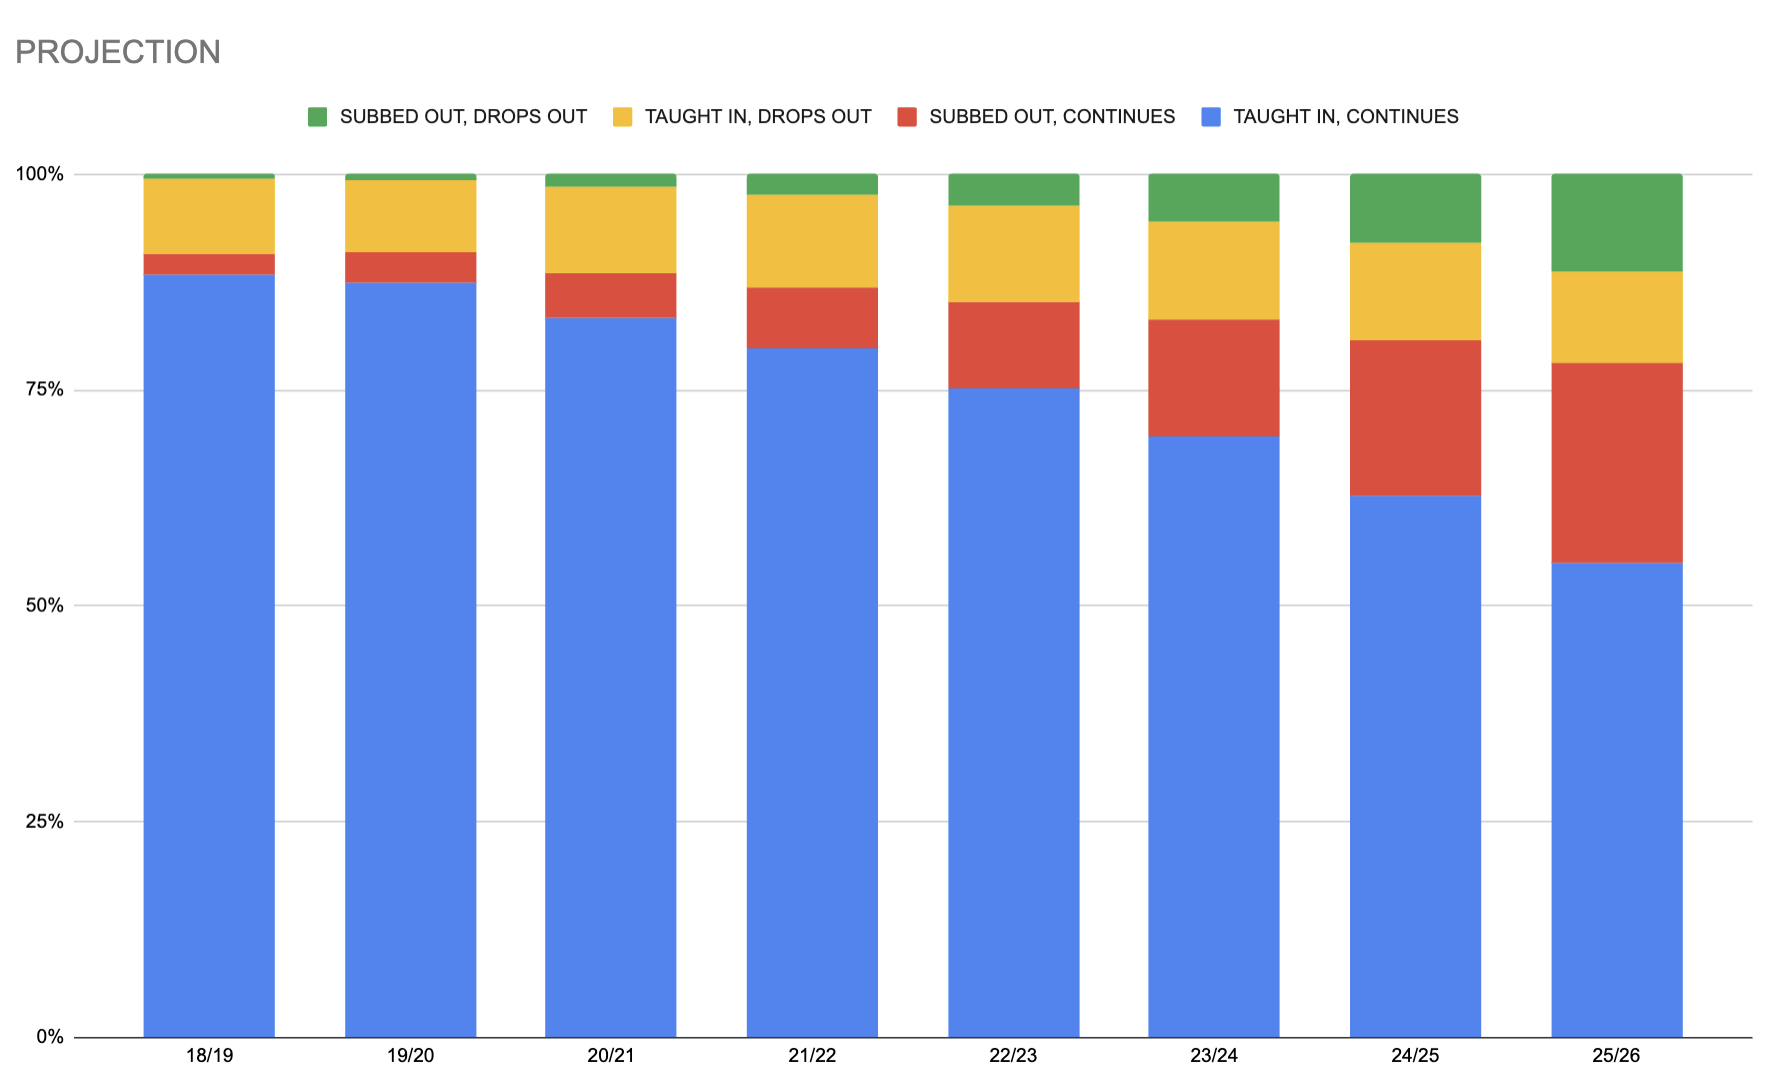
If that projection turns out to be true, one way of looking at the chart is that having circa 120k more UGs dropping out than in 18/19 is the price you pay when, largely via franchising, you have circa 190k more students getting to the second year of a UG degree.
The open question – particularly re those doing business degrees in large urban areas – is whether that non-continuation rate will have ended up lower if they’d not been franchised out.
If the answer’s no, then it will show you can deliver a degree with at least comparable outcomes on a much lower unit of resource than the mainstream sector does now. If the answer is yes, it demonstrates that you can’t. Problem is, we may never know.
The regulatory regime created by OfS is fundamentally flawed because it is is constructed around threshold baseline minimum levels of performance. This has enabled these very dubious franchise arrangements with appalling completion rates to hide within the statistics produced for the franchisor. This was, and no doubt is still being repeatedly pointed out to DfE and OfS officials who bury their head in the sand and pretend there is not a problem. They divert responsibility for this by claiming that the franchisor is responsible for the quality of provision at its franchised providers. It was a mess when Willetts allowed… Read more »
It’s clear that Alternative Providers are being used as a convenient scapegoat for a broken system — and for the failings of traditional universities. This Wonkhe article, like others in the press, paints an alarmist picture of higher education franchising — one that conveniently overlooks the widespread shortcomings of the traditional university system across multiple metrics, while casting Alternative Providers (APs) as the villains of a crisis they didn’t create. Let’s be clear: where there is fraud, it must be addressed decisively and transparently. Bad actors exist in every sector. But to conflate all APs with a handful of poorly… Read more »