

Student inflation v the others, October 2025
Jim is an Associate Editor (SUs) at Wonkhe
Tags
Pretty much every time, it includes a line on why the maximum gets index-linked – increasing the maximum level of student support available across the different streams of funding in line with forecast inflation aims to ensure that students do not suffer a real reduction in their income.
It never mentions that failing to increase the (household residual) income threshold for the parental contribution since 2007 (still at £25,000) as wages grow has been dragging down the amount that students can draw down.
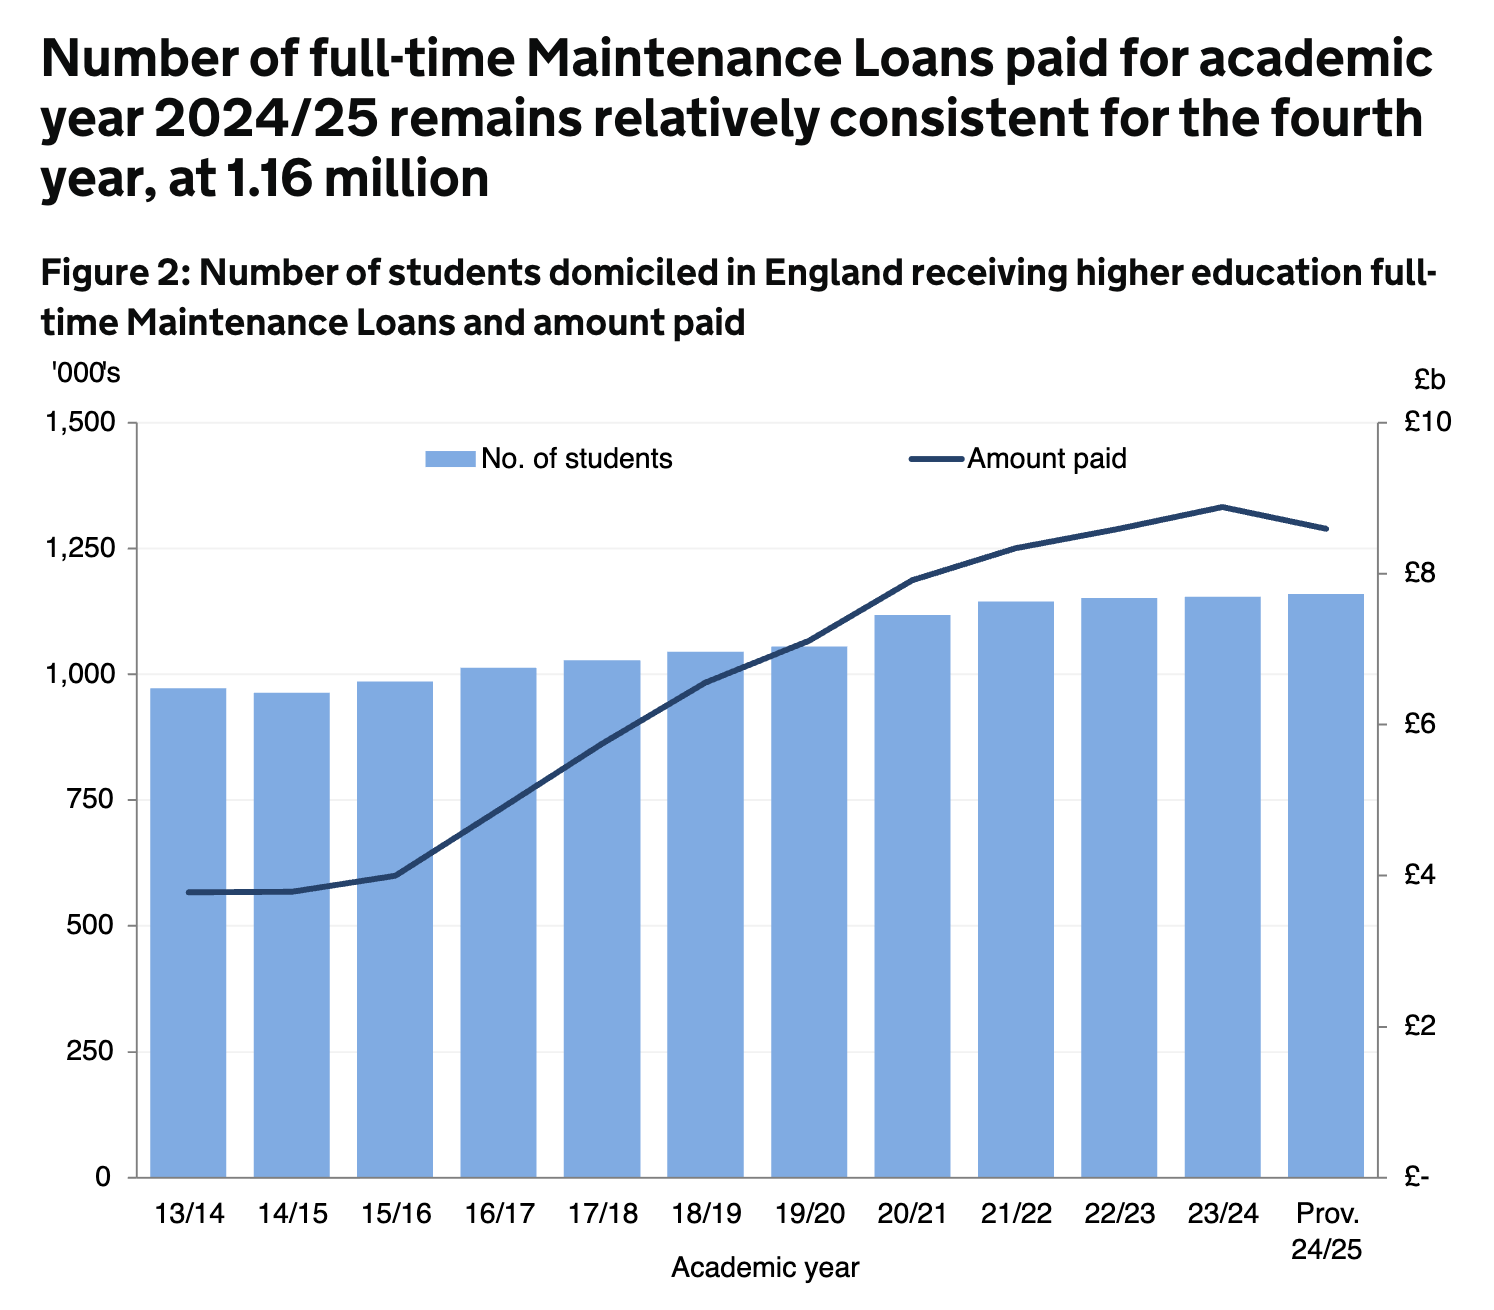
This year’s early in-year stats from the SLC show the problem. Maximum loans are up 3.1 per cent year on year – the average amount being paid out is down.
Nevertheless, at least some sort of index is used. Over the years, there’s been some disquiet around the think tanks about the use of RPI-X because it is discredited, being phased out, and has generally tended to run higher than CPI.
The implication has been that using it for maintenance loans may have resulted in students being loaned more than they needed to be – notwithstanding that threshold problem and the fact that the measure used is always an OBR projection – and the OBR has more often than not underestimated rather than overestimated the figure.
Of course inflation is based on a basket of goods and services, and while there’s no such thing as an average student, to the extent to which there is, said student is unlikely to have the same set of goods and services in their basket as the average consumer.
To correct for that, and to ensure that they are comfortable while in the UK, the Foreign, Commonwealth and Development Office (FCDO) uprates its stipends for its Chevening Scholarship Programme (which funds high-achieving professionals to pursue postgraduate studies, usually a one-year master’s degree, at UK universities) by an amended set of rates.
It was designed to better reflect the basket of goods and services that a full time student might spend out on, and results in a different “student inflation” rate to the headline. I explained the actual weightings used here.
It’s neither perfect nor as hopeless as using CPI or RPI-X, and the FCDO doesn’t seem to be re-weighting as proportions change over time, but I thought I’d take a look at the three annual rates for the 12 months prior for every month for the last decade, along with the actual amount (ie that pesky OBR projection) that max loans have gone up by.
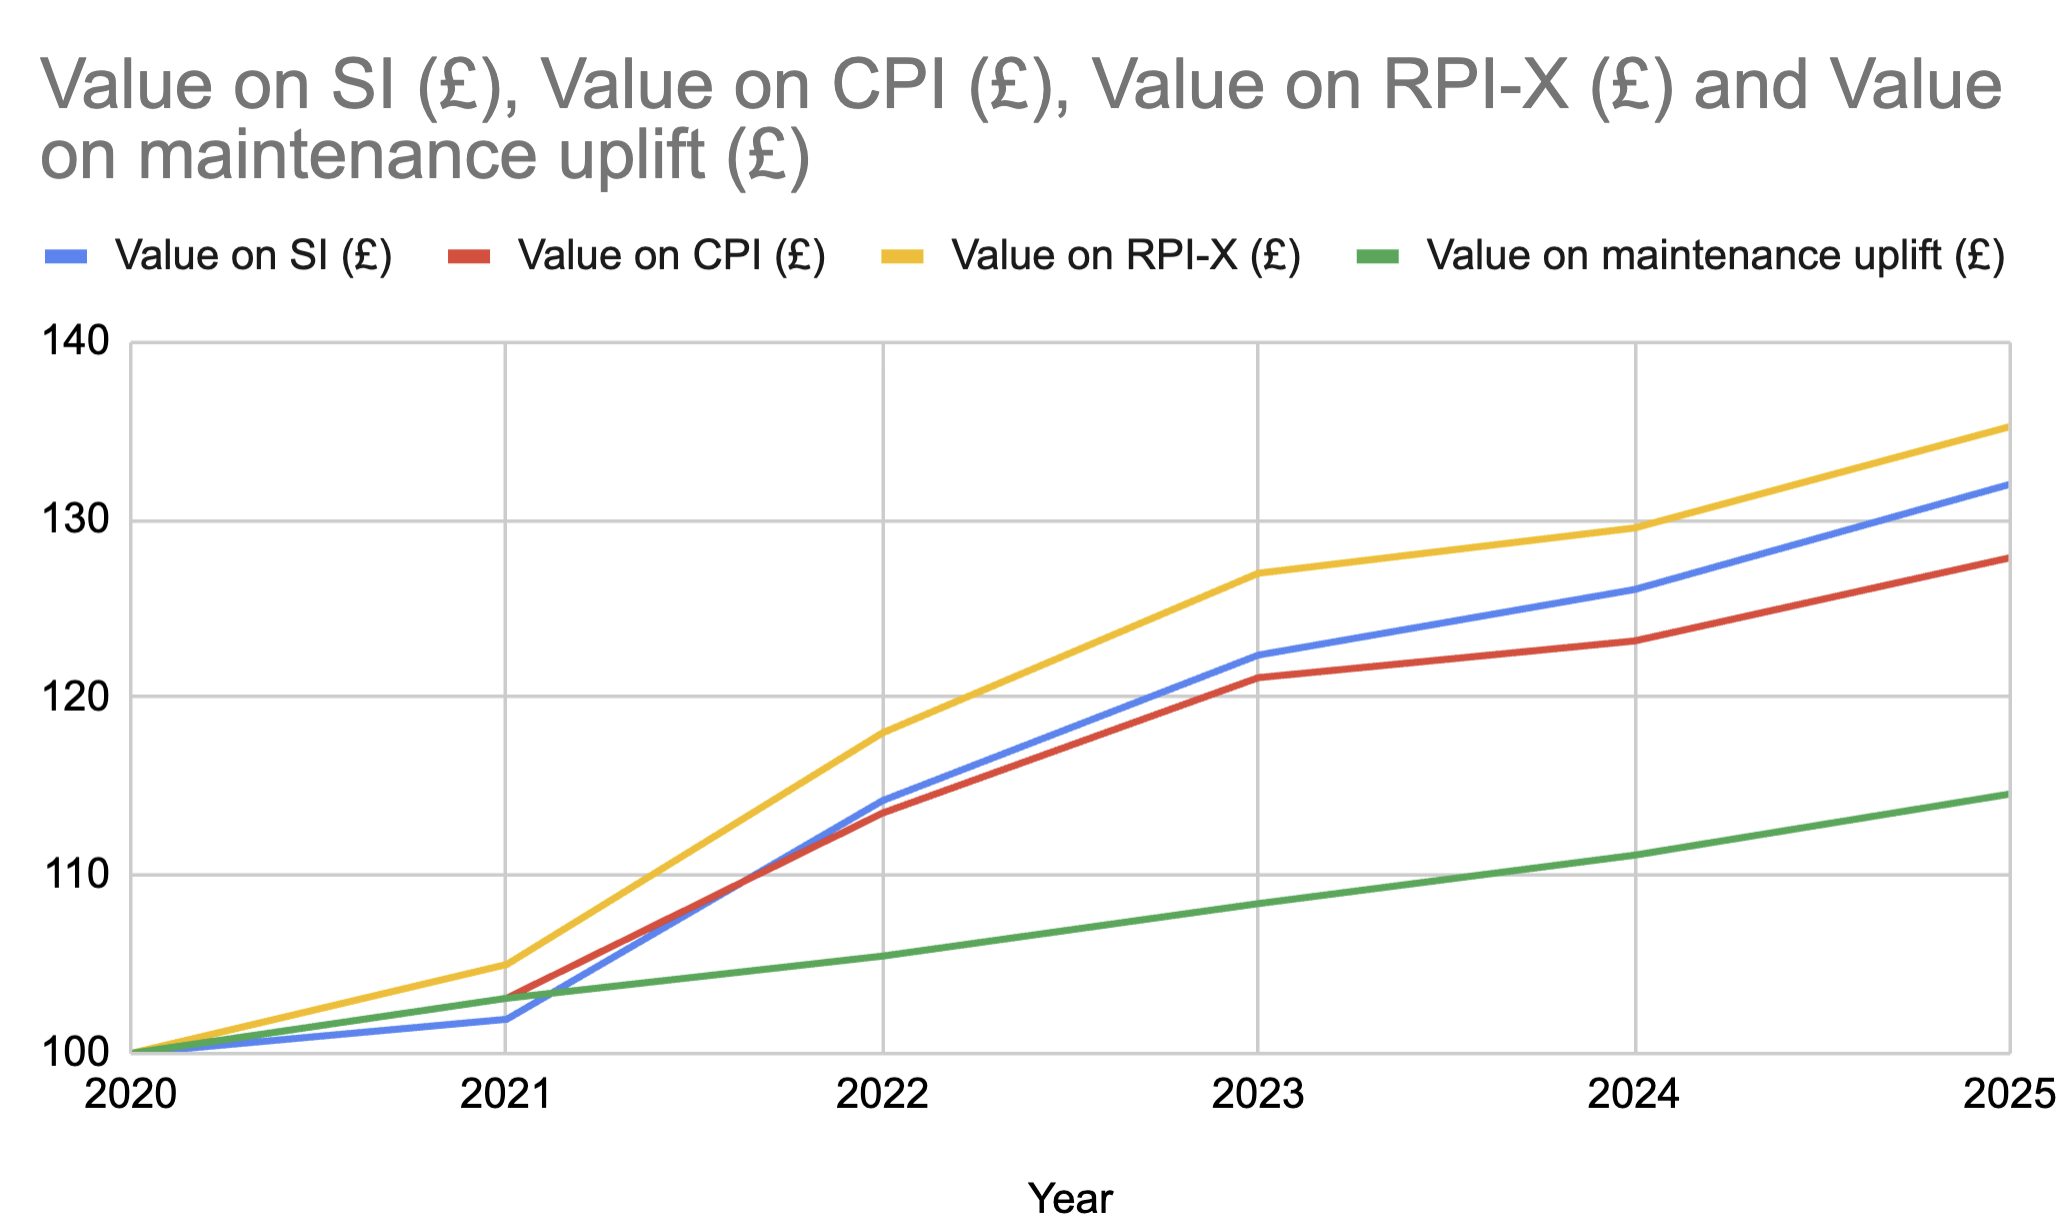
If you started in September 2020 with £100, you’ll see that it is indeed correct that RPI is higher than CPI, and higher than SI (student inflation). You’ll also see that the OBR’s projections mean that students haven’t been getting RPI, and that SI is consistently higher than CPI.
If nothing else that graph reminds us what a raw deal the Covid generation got – a group that is now having to experience the second of two stealth repayment threshold freezes, which almost certainly results in that cohort dipping into negative subsidy – ie in the long run not only were they mugged off at the time, over time they’ll end up paying more for it than they borrowed in real terms.
The most expensive years to be a student, and the worst, all at once!
Back on inflation, the scores on the doors for October were as follows:
12 months inflation to end October 2025
- Student inflation: 4.05%
- CPI: 3.60%
- RPI-X: 4.20%
- Sep 2025 Real max maintenance uplift: 3.1%
- July 2025 Average DfE projected maintenance uplift: 2.6%
- In year average actual FT maintenance loan uplift (SLC): -3.4%
Yes. That last figure is a minus.
In the official story, October’s inflation looks like it’s calming down – the headline CPI rate edged down to 3.6 per cent as last year’s huge energy price spikes dropped out of the comparison, and the ONS was keen to stress that gas and electricity are now rising much more slowly than a year ago.
But if you build a basket that looks more like a student’s life – heavy on rent, food, and a bit of transport – you end up somewhere very different. On the Chevening-style measure, “student inflation” in October is still running at about 4.05 per cent, because the big-ticket items that dominate a student budget haven’t really cooled.
Actual rents continue to climb (and even these figures don’t slice out the student rental market), food prices are still high, and transport costs remain sticky.
In other words, the parts of the economy that are delivering the headline good news are not the ones students are spending their money on – so while ministers can point to easing inflation and uprating student support by it, students are still living in a world where the prices that matter most are rising faster than the averages, and their support is miles away from keeping up.