


After much delay, and extensive leaks, the Augar Review has been published. In terms of size, it’s a 216 page beast with more than 50 recommendations. In terms of the sector response, there will be many views on the recommendations made and what they mean for higher education (if ever implemented). However, there is a fair amount of detail in the actual report (so far!) which will not be reflected in much of the press coverage, so it’s important to consider the report fully – whatever your views.
There were also a lot of recommendations about both further education and apprenticeships. Although we don’t consider their economic impact here, it is important to consider the report and its recommendations – in their entirety – across all of the post-18 sector.
There will be winners and losers of course – and this is what we focus on. However, many of the core recommendations will have impacts that are not obvious. So, as the media coverage focuses on the headlines (the fee cut, the interest rate reduction, the repayment period extension etc), the economic impact – and who is impacted – is considerably more subtle.
Remember (again!) that the report is a post-18 exercise – and that our analysis focuses only on the impact on higher education. There are likely to be big changes in the world of vocational and technical education. There are also proposals for a range of incentives affecting learners (the lifelong learning accounts) that could have a huge impact on the dynamics of higher education – so how learners and higher education institutions respond to these will only become apparent in the longer term.
What do we focus on?
Our analysis focuses the 481,945 students in the 2018/19 cohort of first-year undergraduate (full-time and part-time) English-domiciled students studying anywhere in the UK, and EU-domiciled students studying in England.
We estimate the financial impact of the key Augur recommendations on the Exchequer, students/graduates and Higher Education Institutions – analysing the effect for the 2018-19 cohort if the recommendations had already been applied to the current academic year. It is important to note that some of these recommendations are not entirely precise, or there is some ambiguity on how to model them (e.g. in terms of real terms repayment caps, maintenance loan eligibility and the reallocation of Teaching Grant funding). In these instances, we have been forced to make some assumptions (all of which will be detailed) in order to be able to model the potential effects.
Where are we now?
Looking at the current student support system for the 2018-19 cohort:
- The total cost to the Exchequer per cohort of the current student support system stands at £8.43 billion per cohort. Of this total, the write off associated with maintenance loans stands at £2.81 billion, with a further £4.39 billion associated with tuition fee loan write-offs. The Exchequer incurs a further £1.24 billion in costs associated with teaching grant funding (for Band A, Band B and Band C1 subjects).
- Higher education institutions receive approximately £10.04 billion in gross tuition fee income per cohort (of which £9.64 billion is accrued by English providers, with £0.41 billion accrued by Scottish, Welsh and Northern Irish providers). After the costs of compulsory bursary provision is accounted for (£0.19 billion), net tuition fee income per cohort across the UK stands at £9.86 billion. Combining net tuition fee income and teaching grant funding, total HEI income is estimated to be £11.09 billion per cohort – corresponding to £9,000 per student per annum.
| Resource flows | Amount (£/%) |
|---|---|
| Exchequer | |
| Cost of maintenance grant | £0m |
| Cost of maintenance loan | (£2,808m) |
| Cost of tuition fee loan | (£4,387m) |
| Cost of Teaching Grants | (£1,236m) |
| Total Exchequer Cost | (£8,431m) |
| RAB Charge | 43.50% |
| Higher education institutions | |
| Gross fee income | £10,044m |
| Teaching Grant income | £1,236m |
| Cost of bursary provision | (£188m) |
| Total | £11,093m |
| Net HEI resource per student p.a. | £9,000 |
| Students/Graduates (FT undergraduate degrees) | |
| Average debt on graduation | £46,800 |
| Average Lifetime repayments (M) | £38,700 |
| Average Lifetime repayments (F) | £16,600 |
From the perspective of students and graduates:
- The current system offers up to £11,354 in student maintenance support per student per annum (p.s.p.a.) – entirely provided through loans. The average maintenance loan stands at approximately £6,750 p.s.p.a. Average debt on graduation stands at £46,800 (for full-time undergraduate degrees).
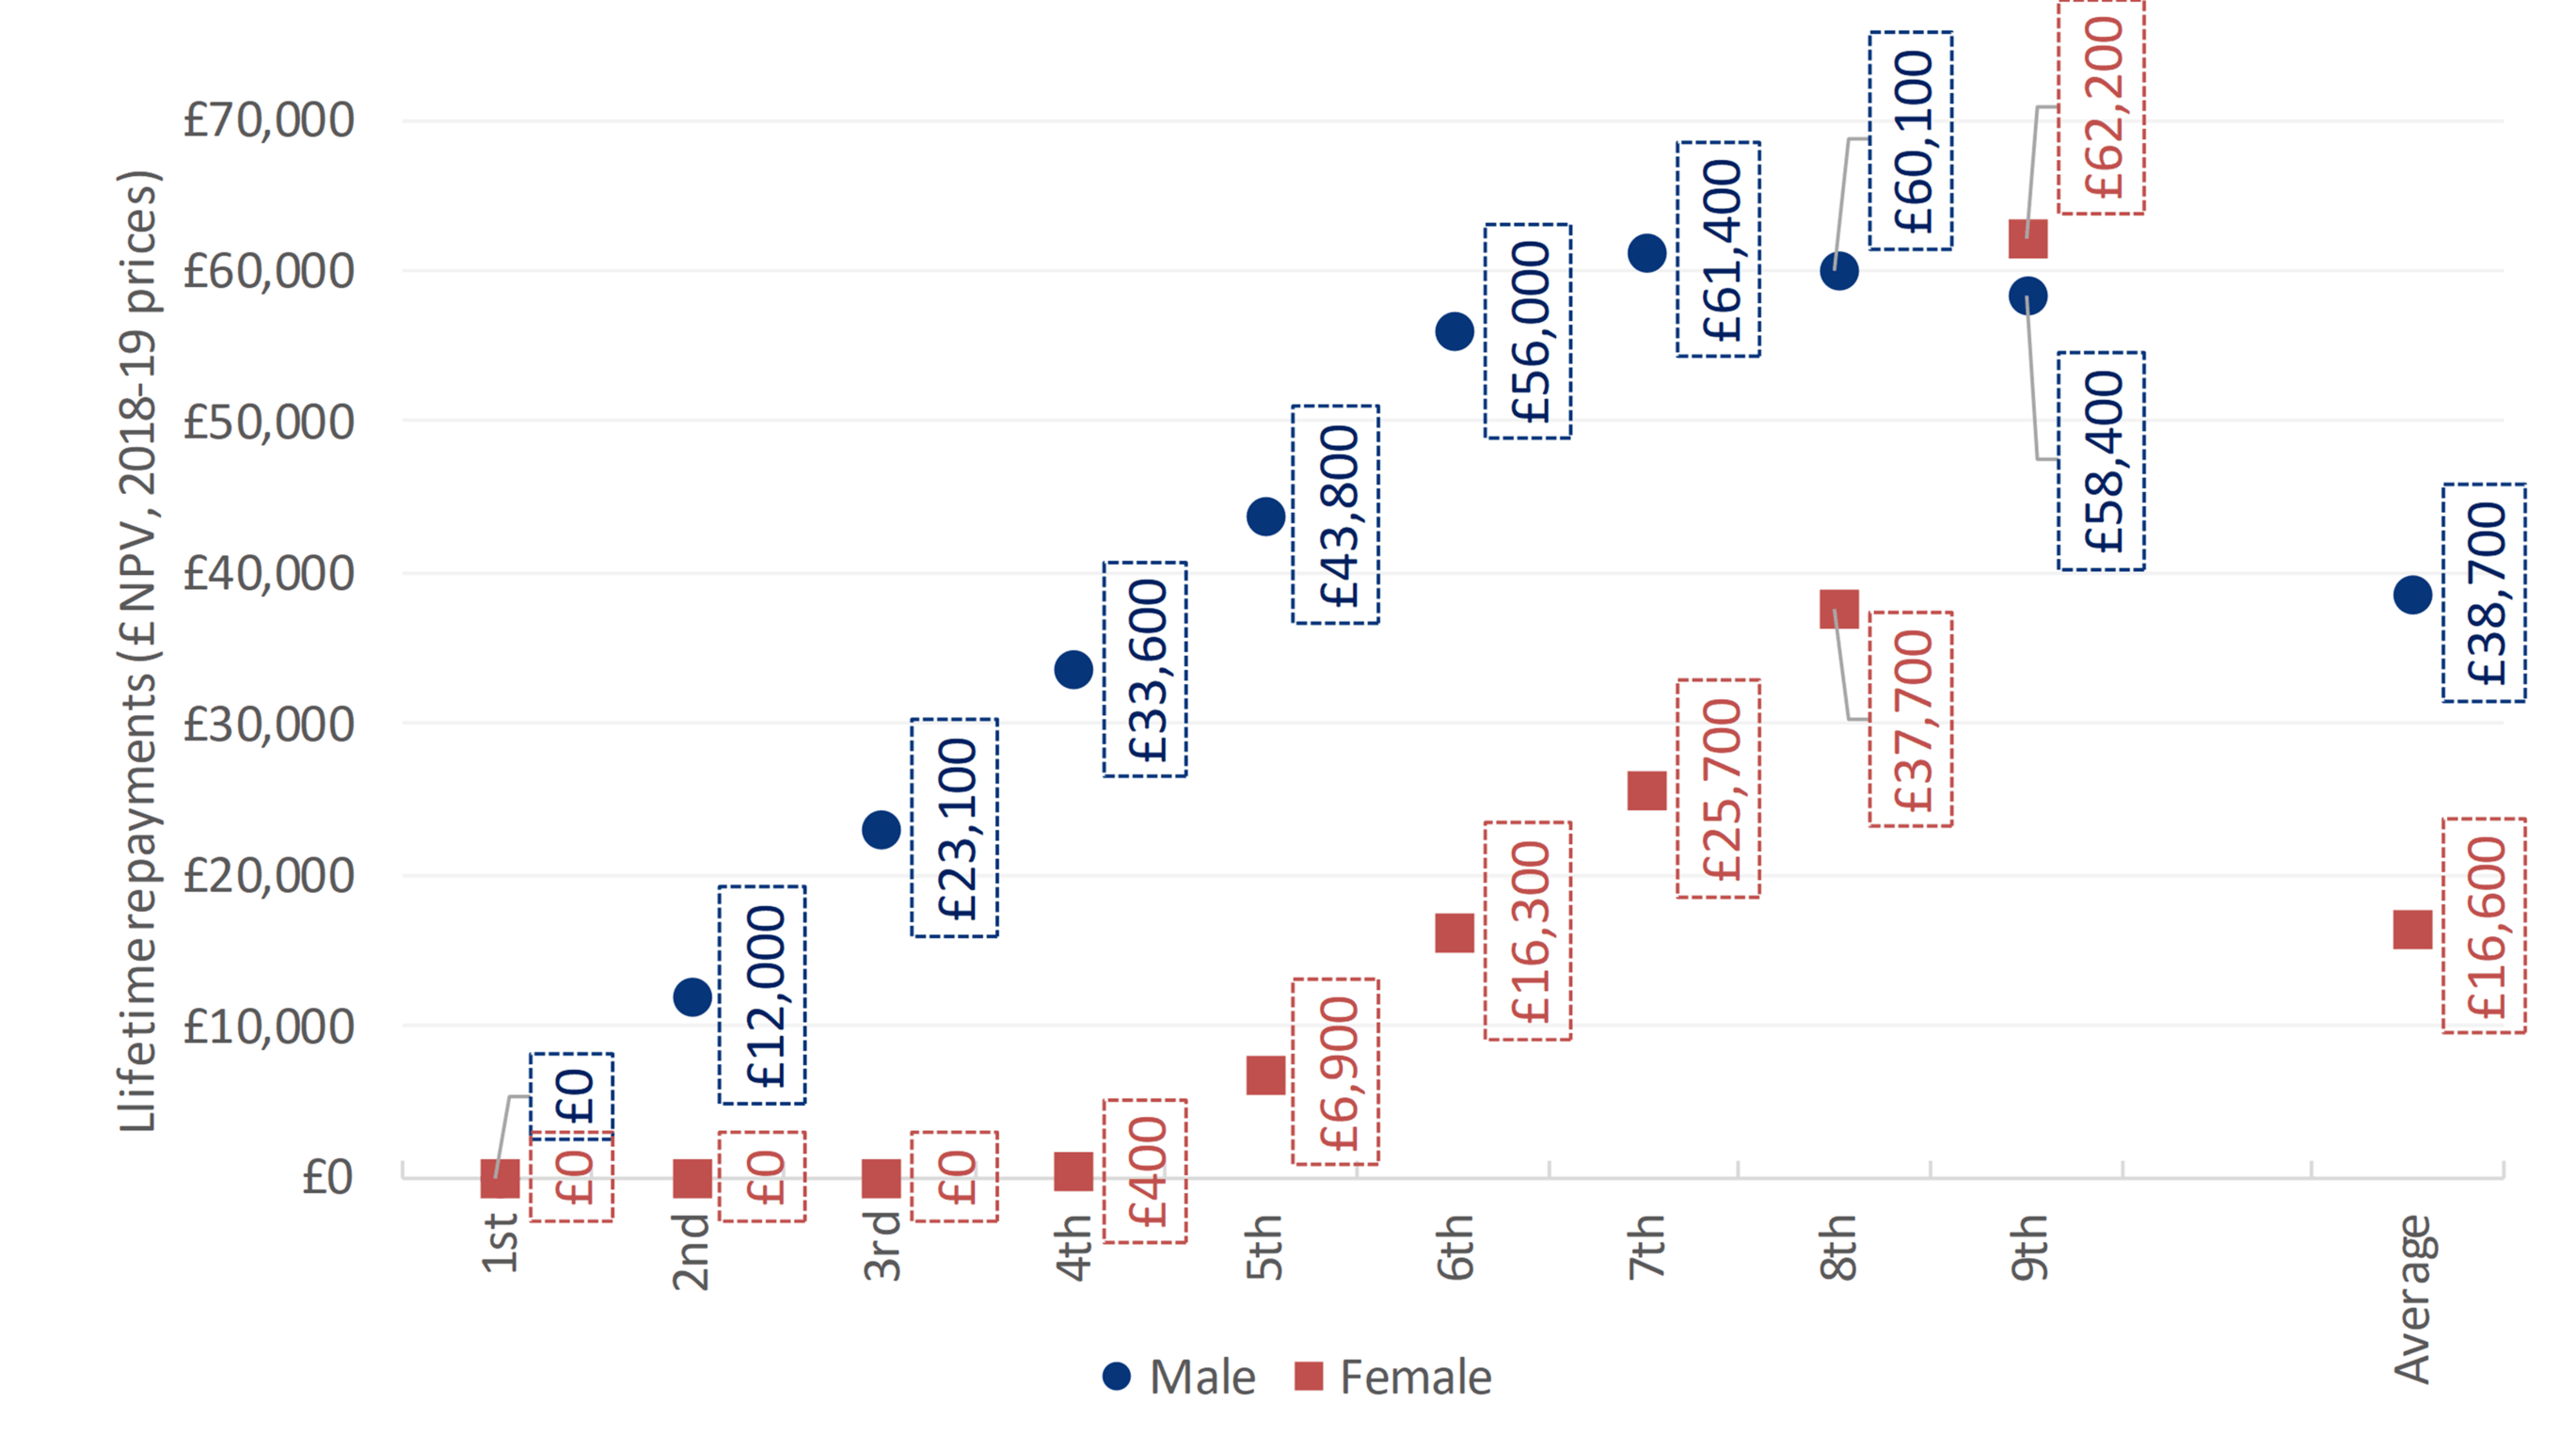
- Average lifetime loan repayments (NPV in constant 2018-19 prices) for students undertaking full-time undergraduate degrees are £38,700 for men and £16,600 for women.
- The RAB Charge (proportion of the loan written off) stands at 43.5%.
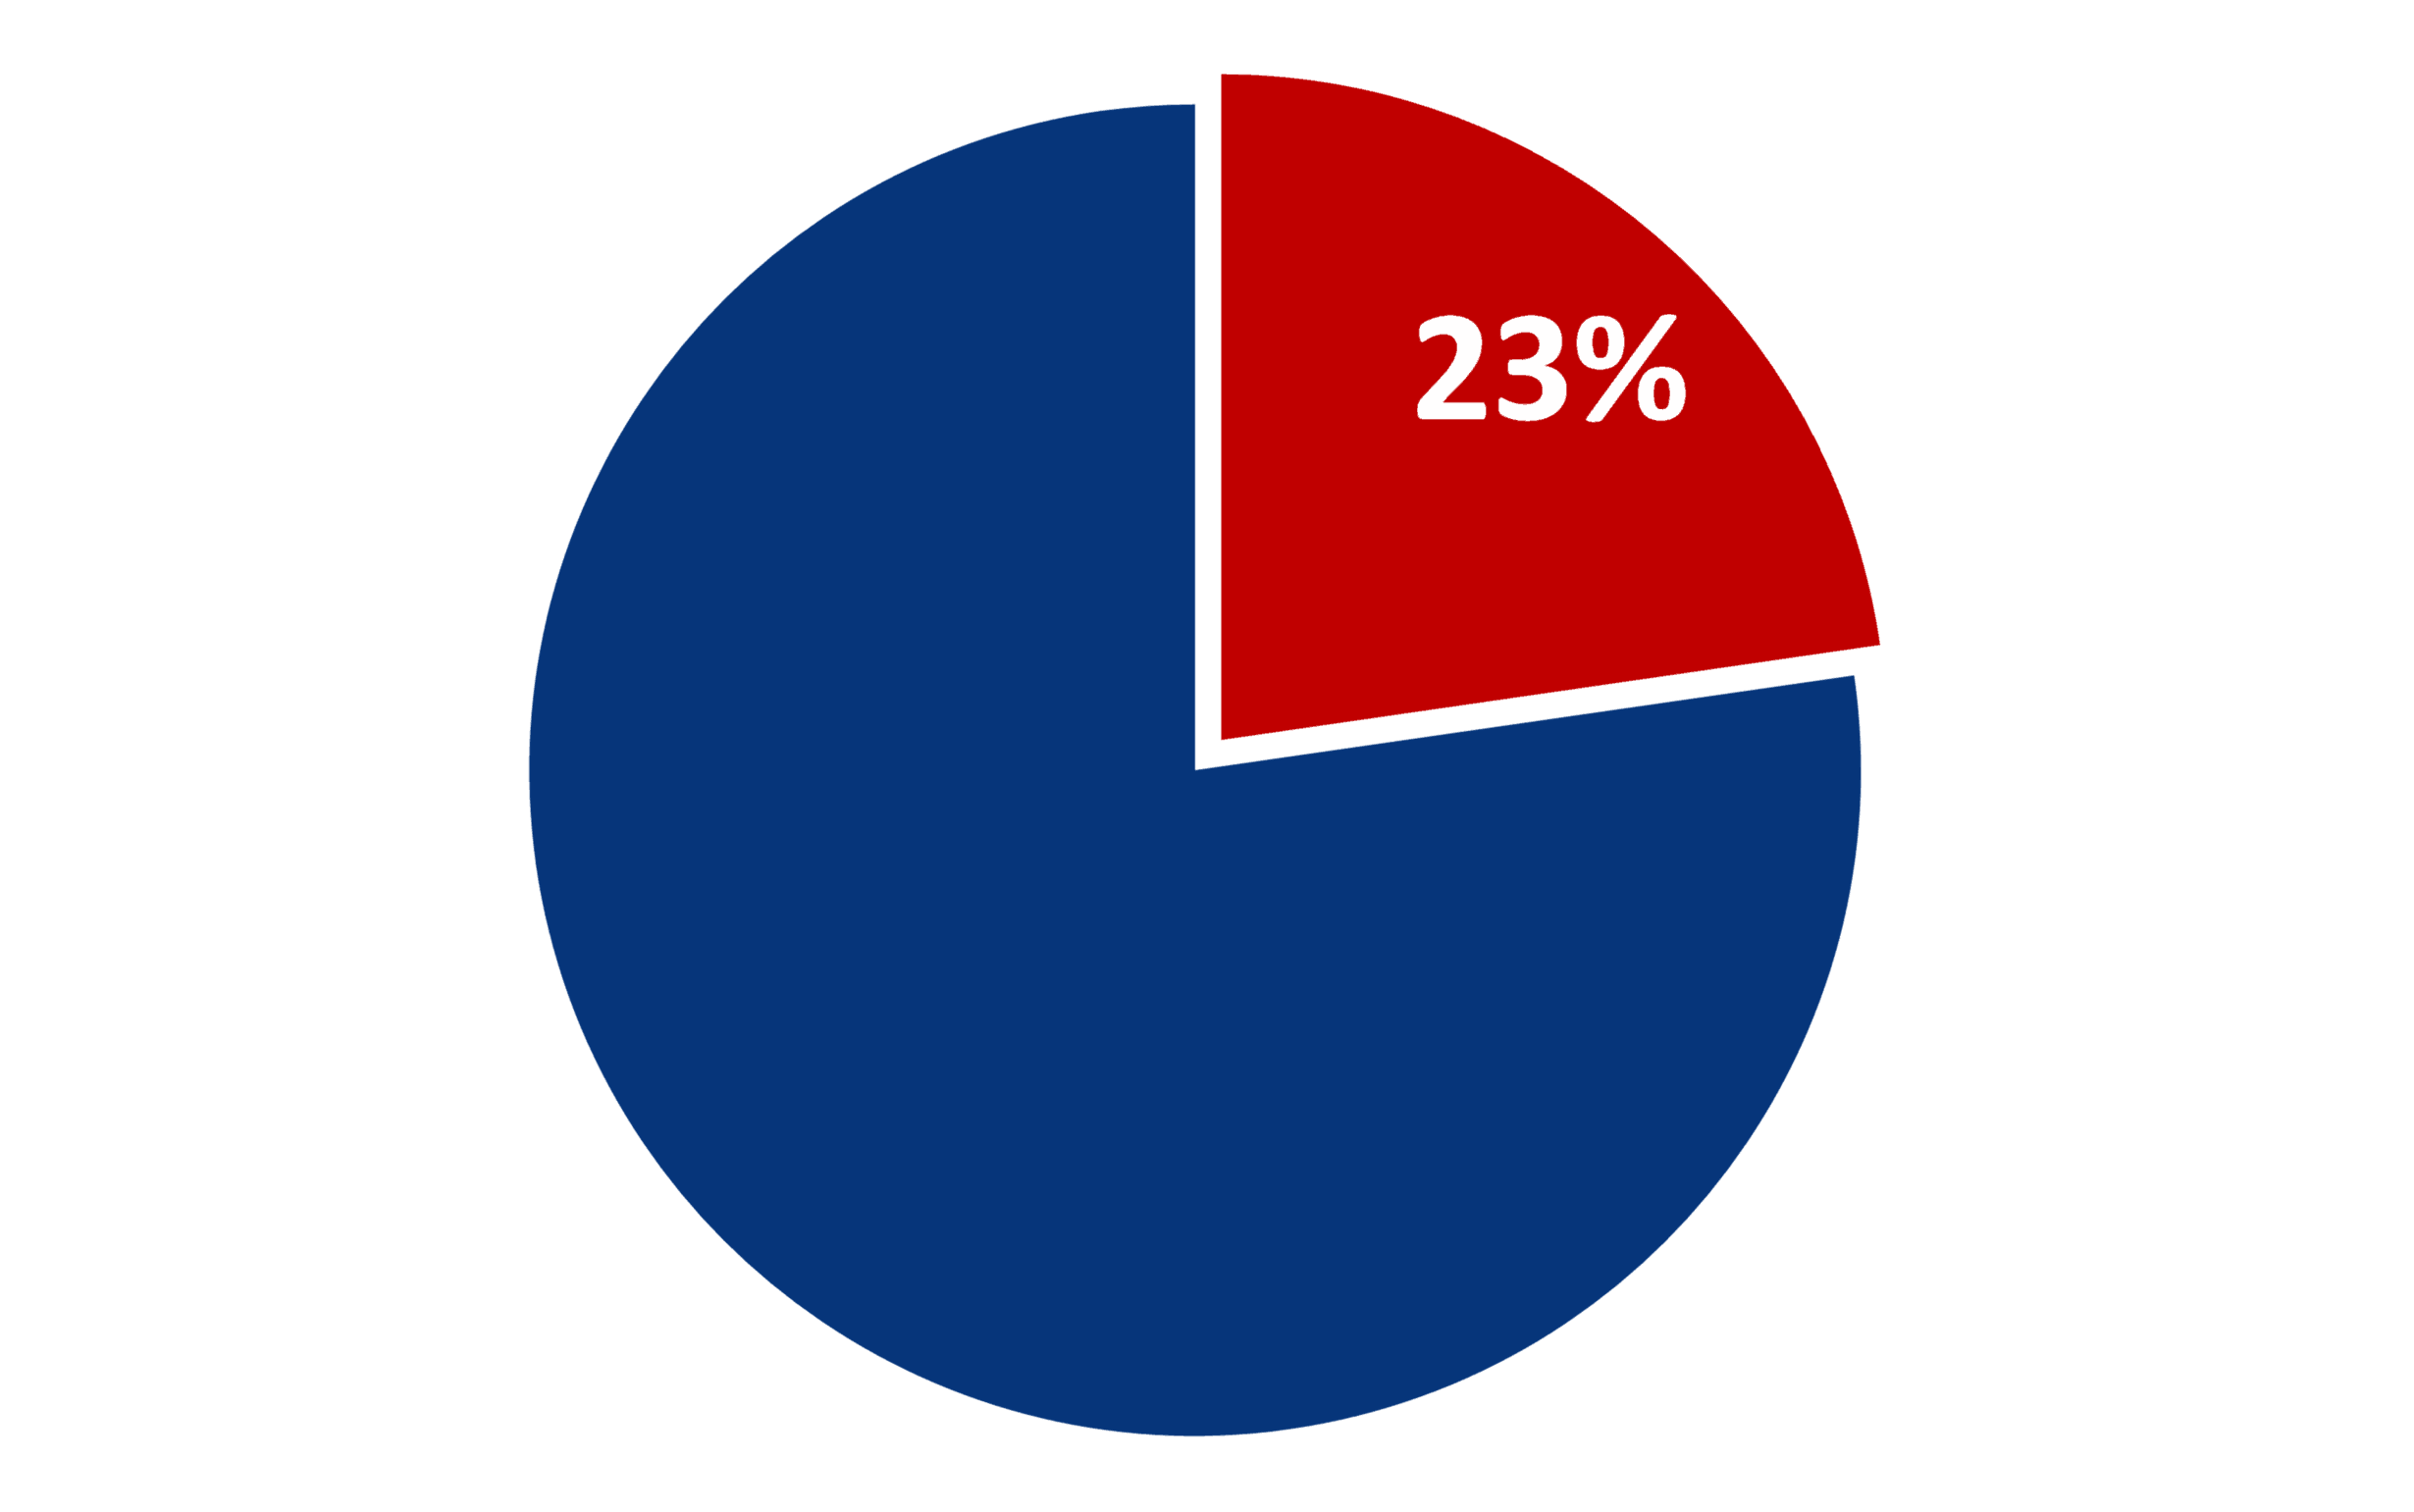
- Approximately 80% of all graduates (across FT and PT) are not expected to repay the full loan balance within 30 years. Approximately 23% of graduates are not expected to make any repayment of their student loan (i.e. never reach the repayment threshold).
- The outstanding loan balance (in cash terms) at the end of the 30 year repayment period was estimated to be £58,700 for men and £106,900 for women.
Baseline higher education fees and funding in 2018-19 in charts
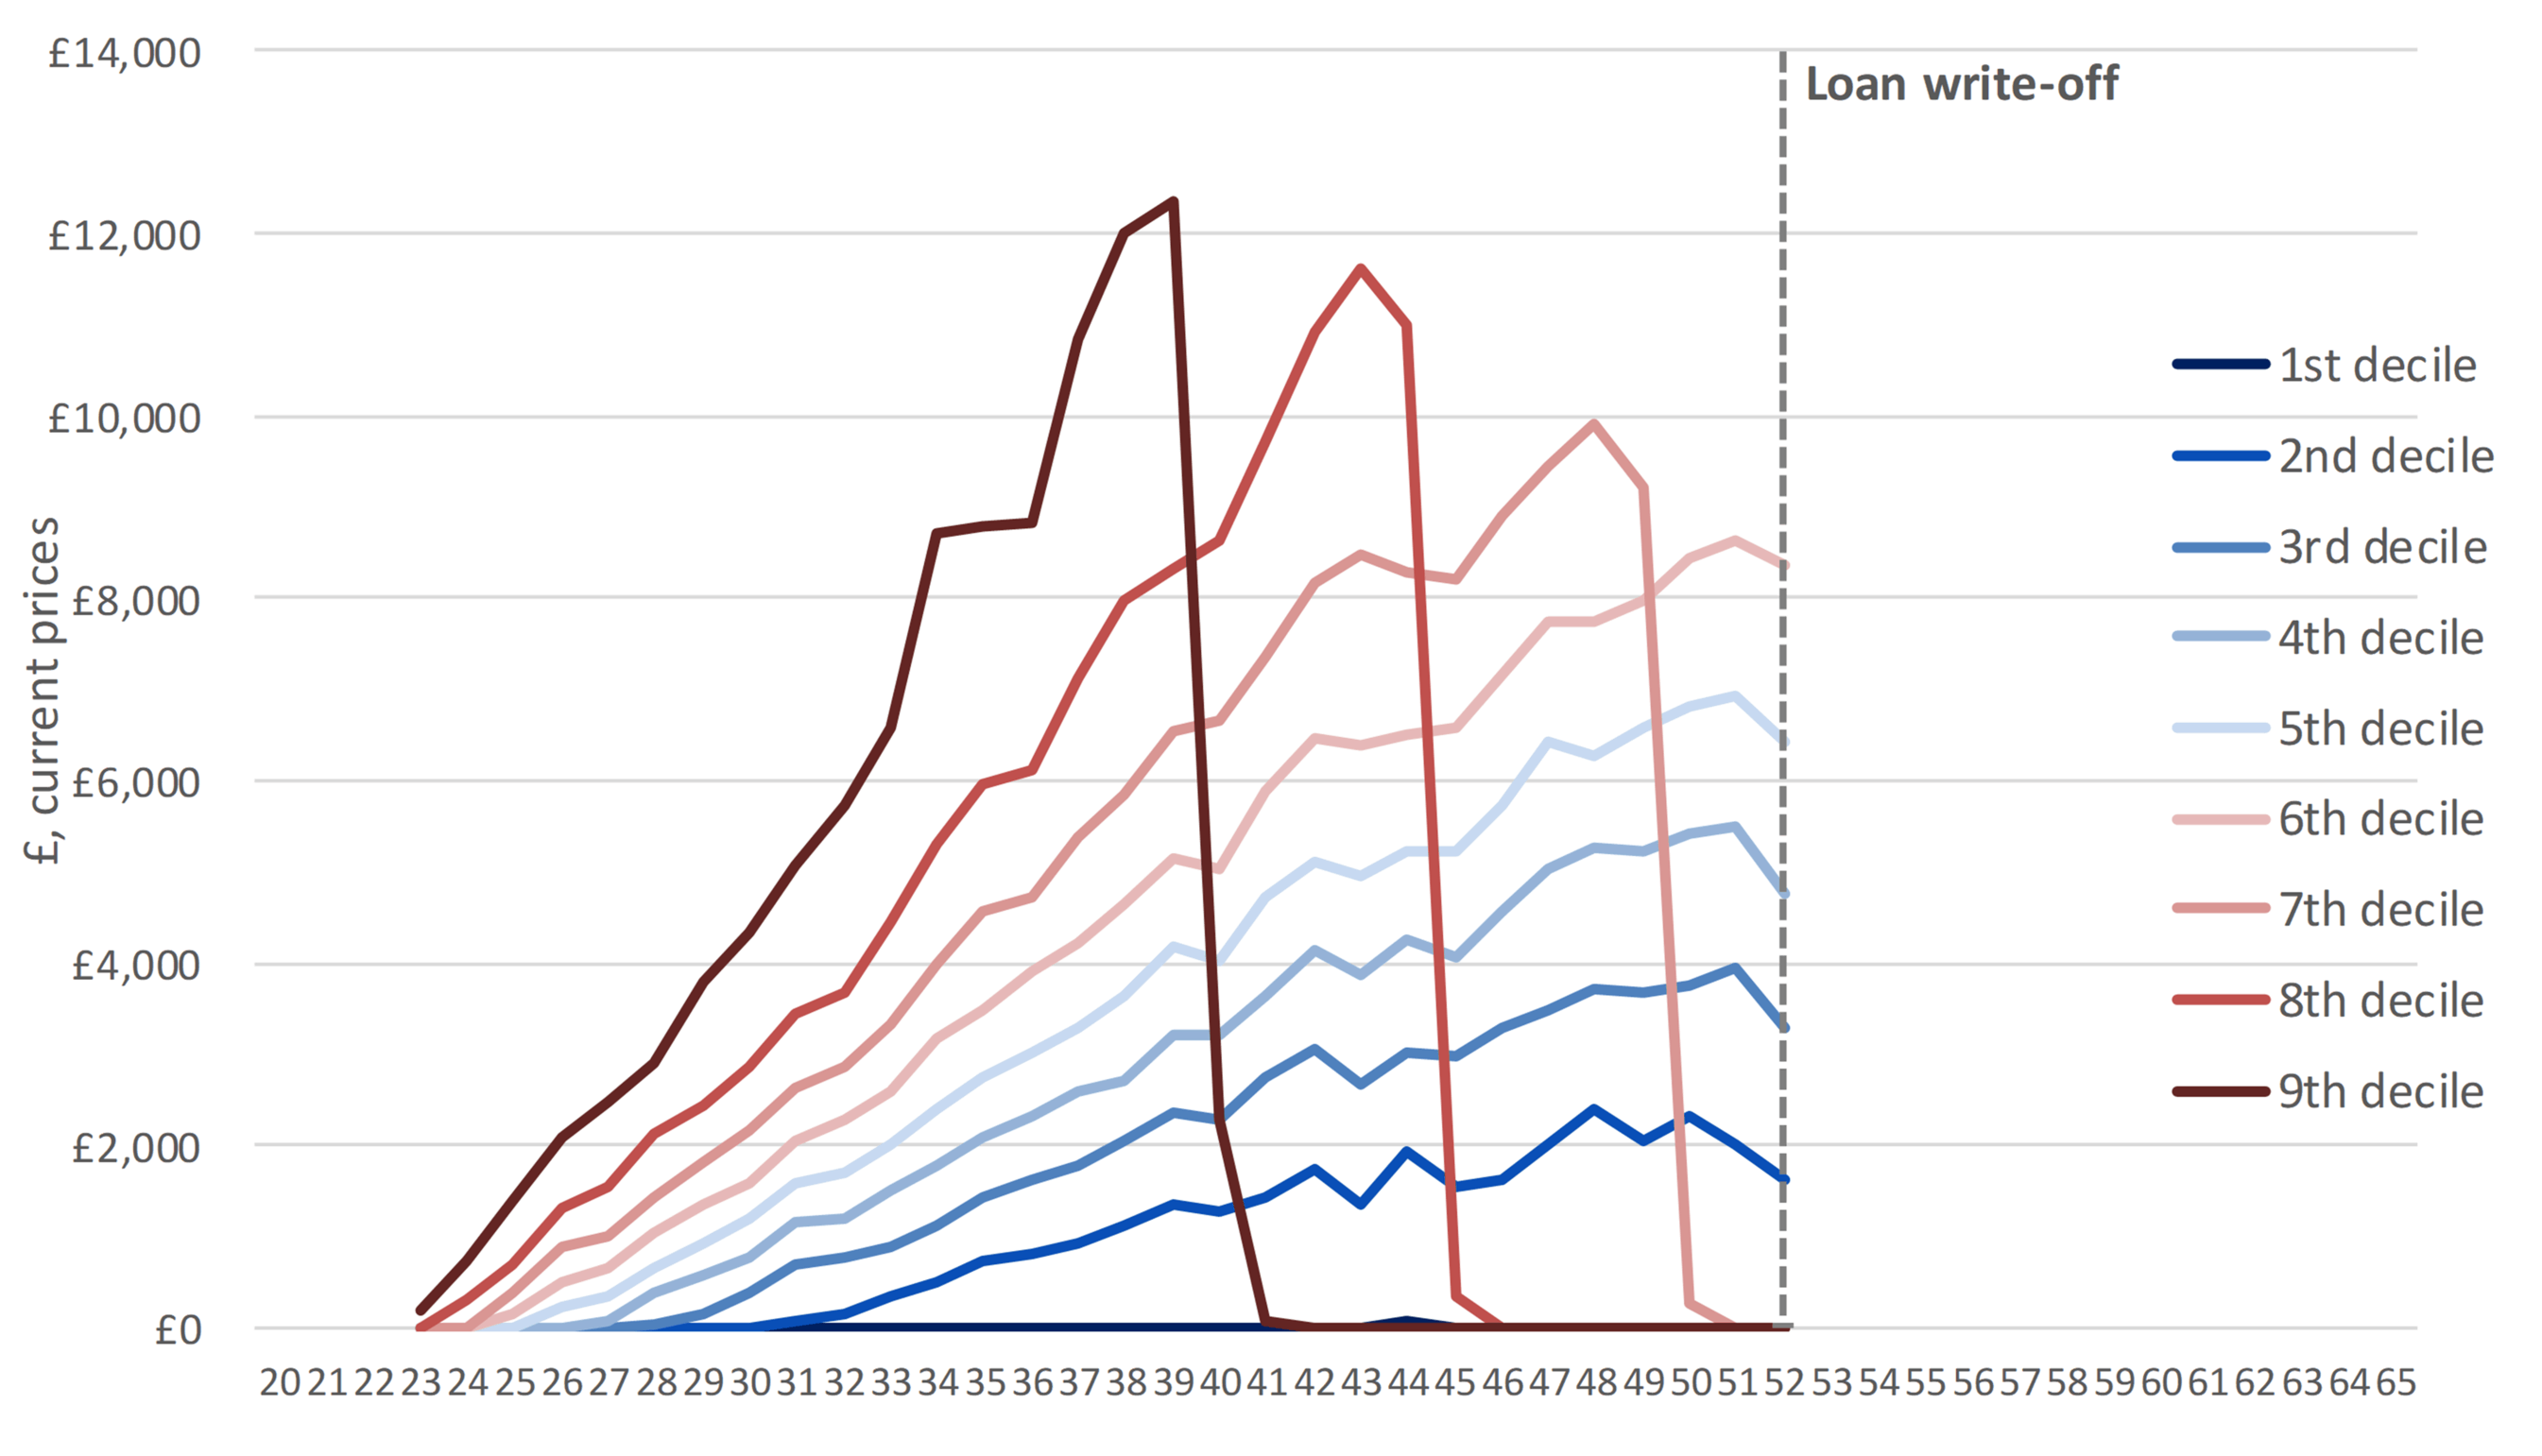
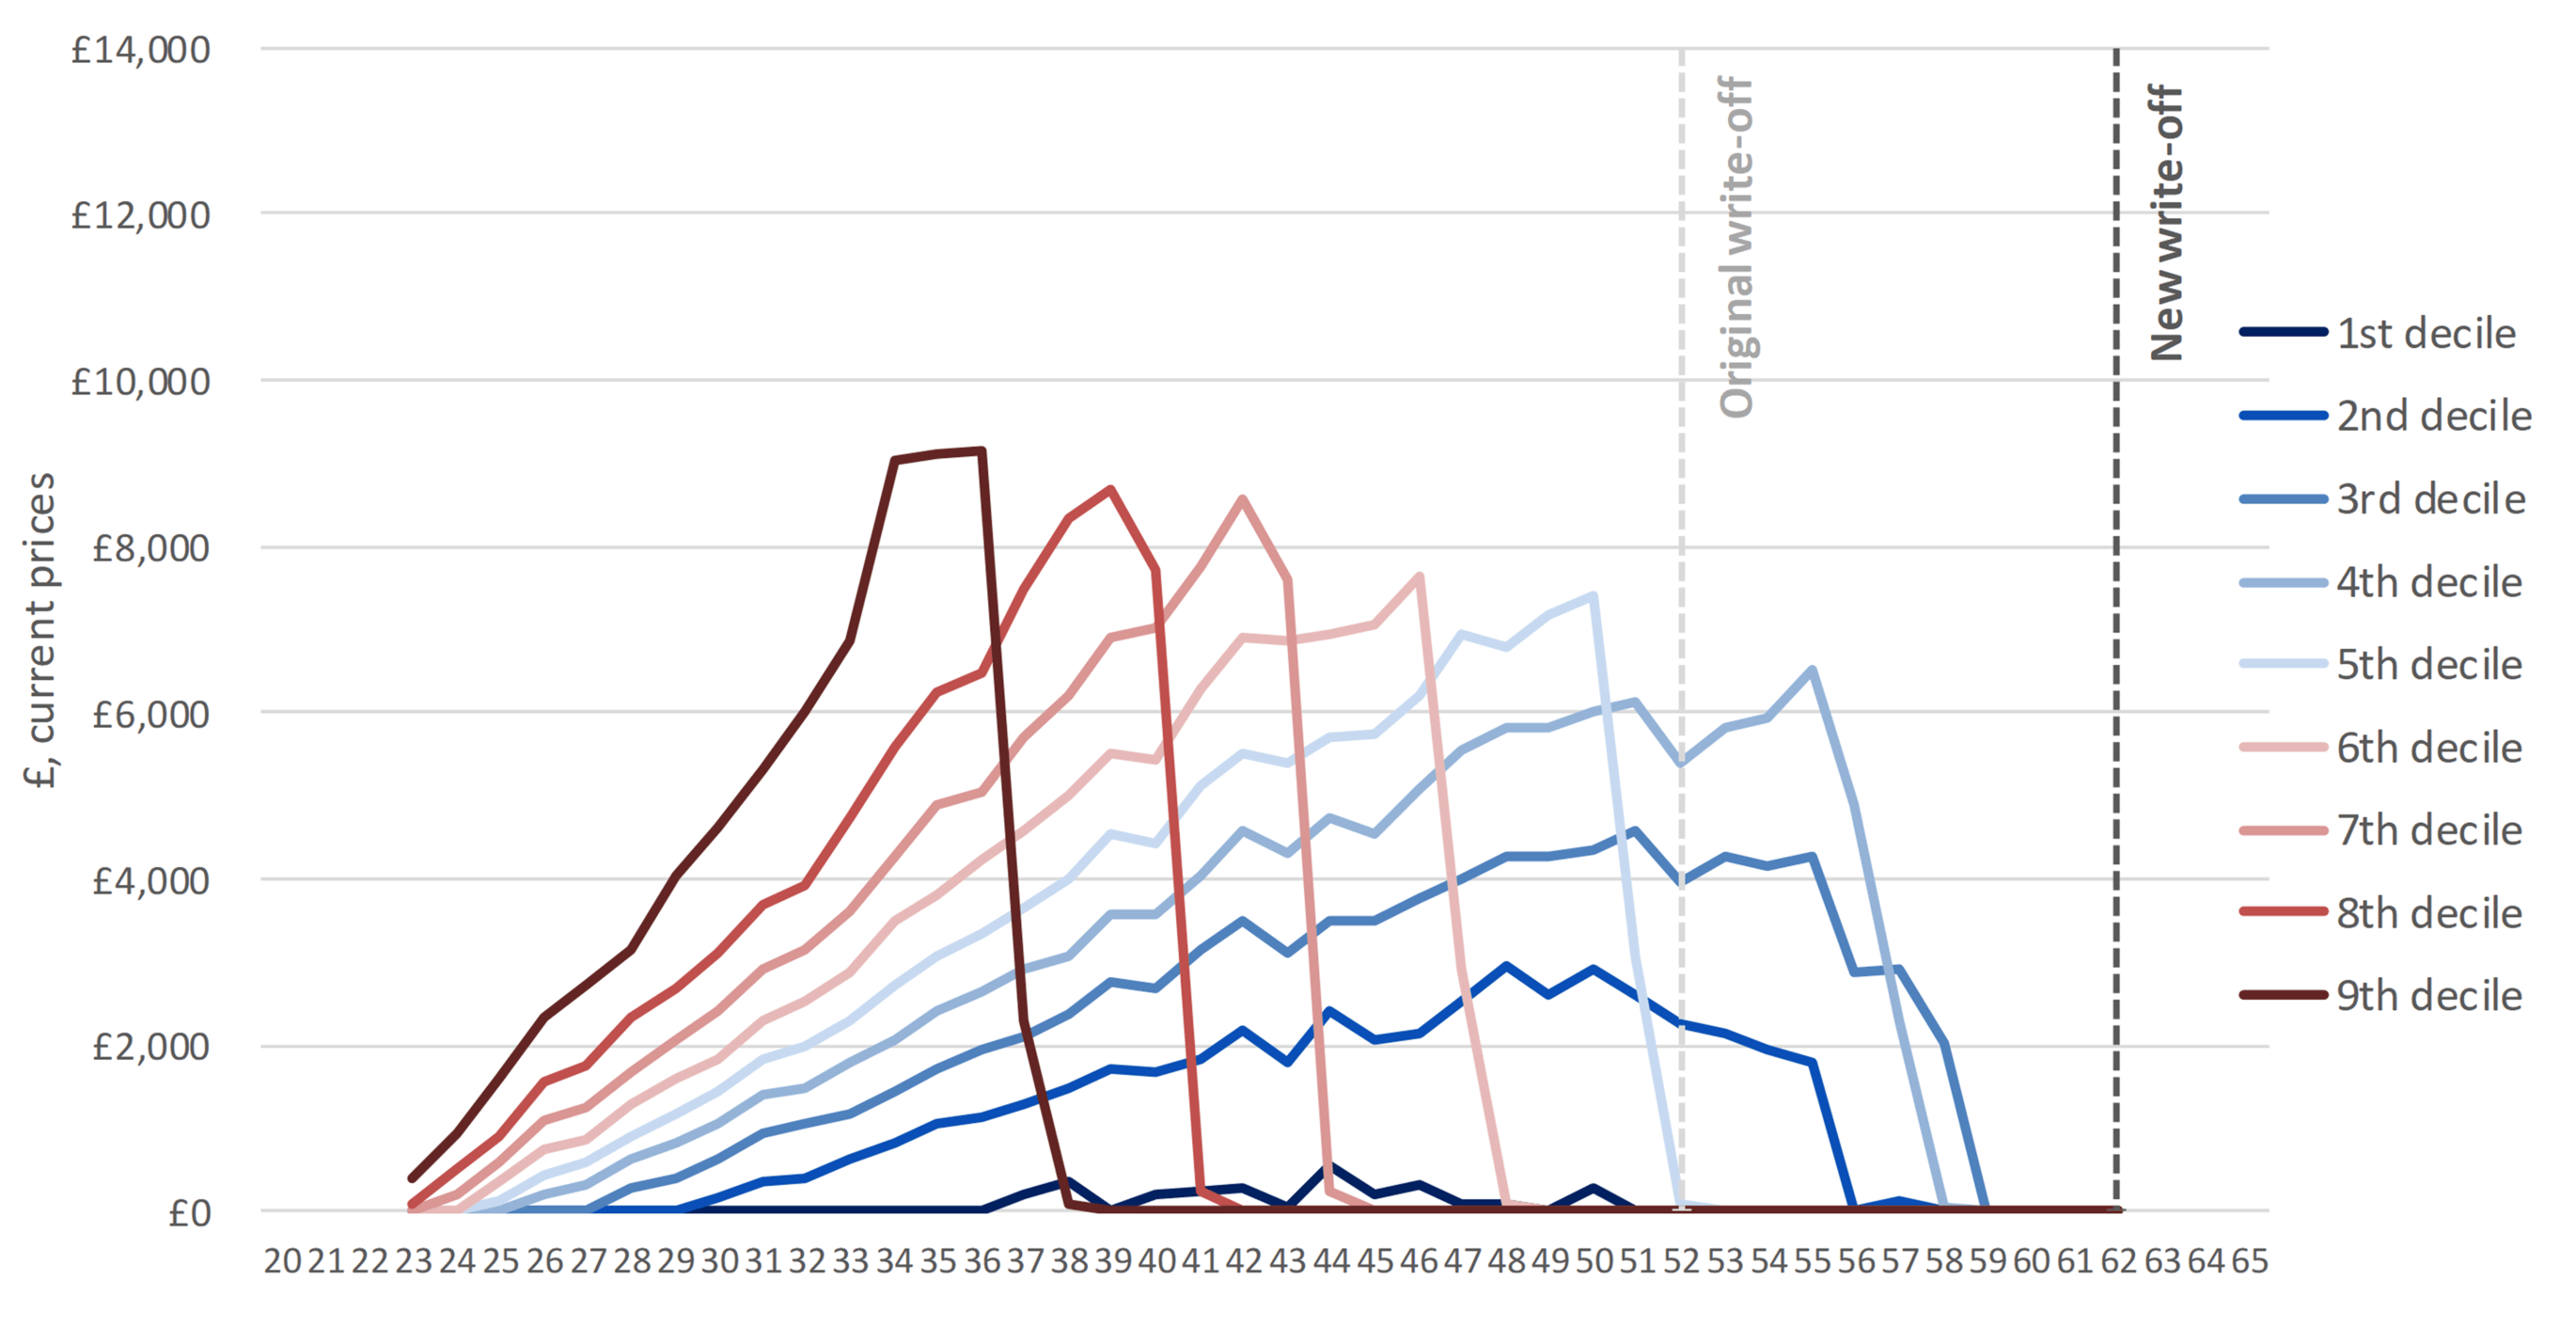
Annual loan repayments by full-time undergraduate degree graduates (£ in current prices, cash terms), by age and decile – men
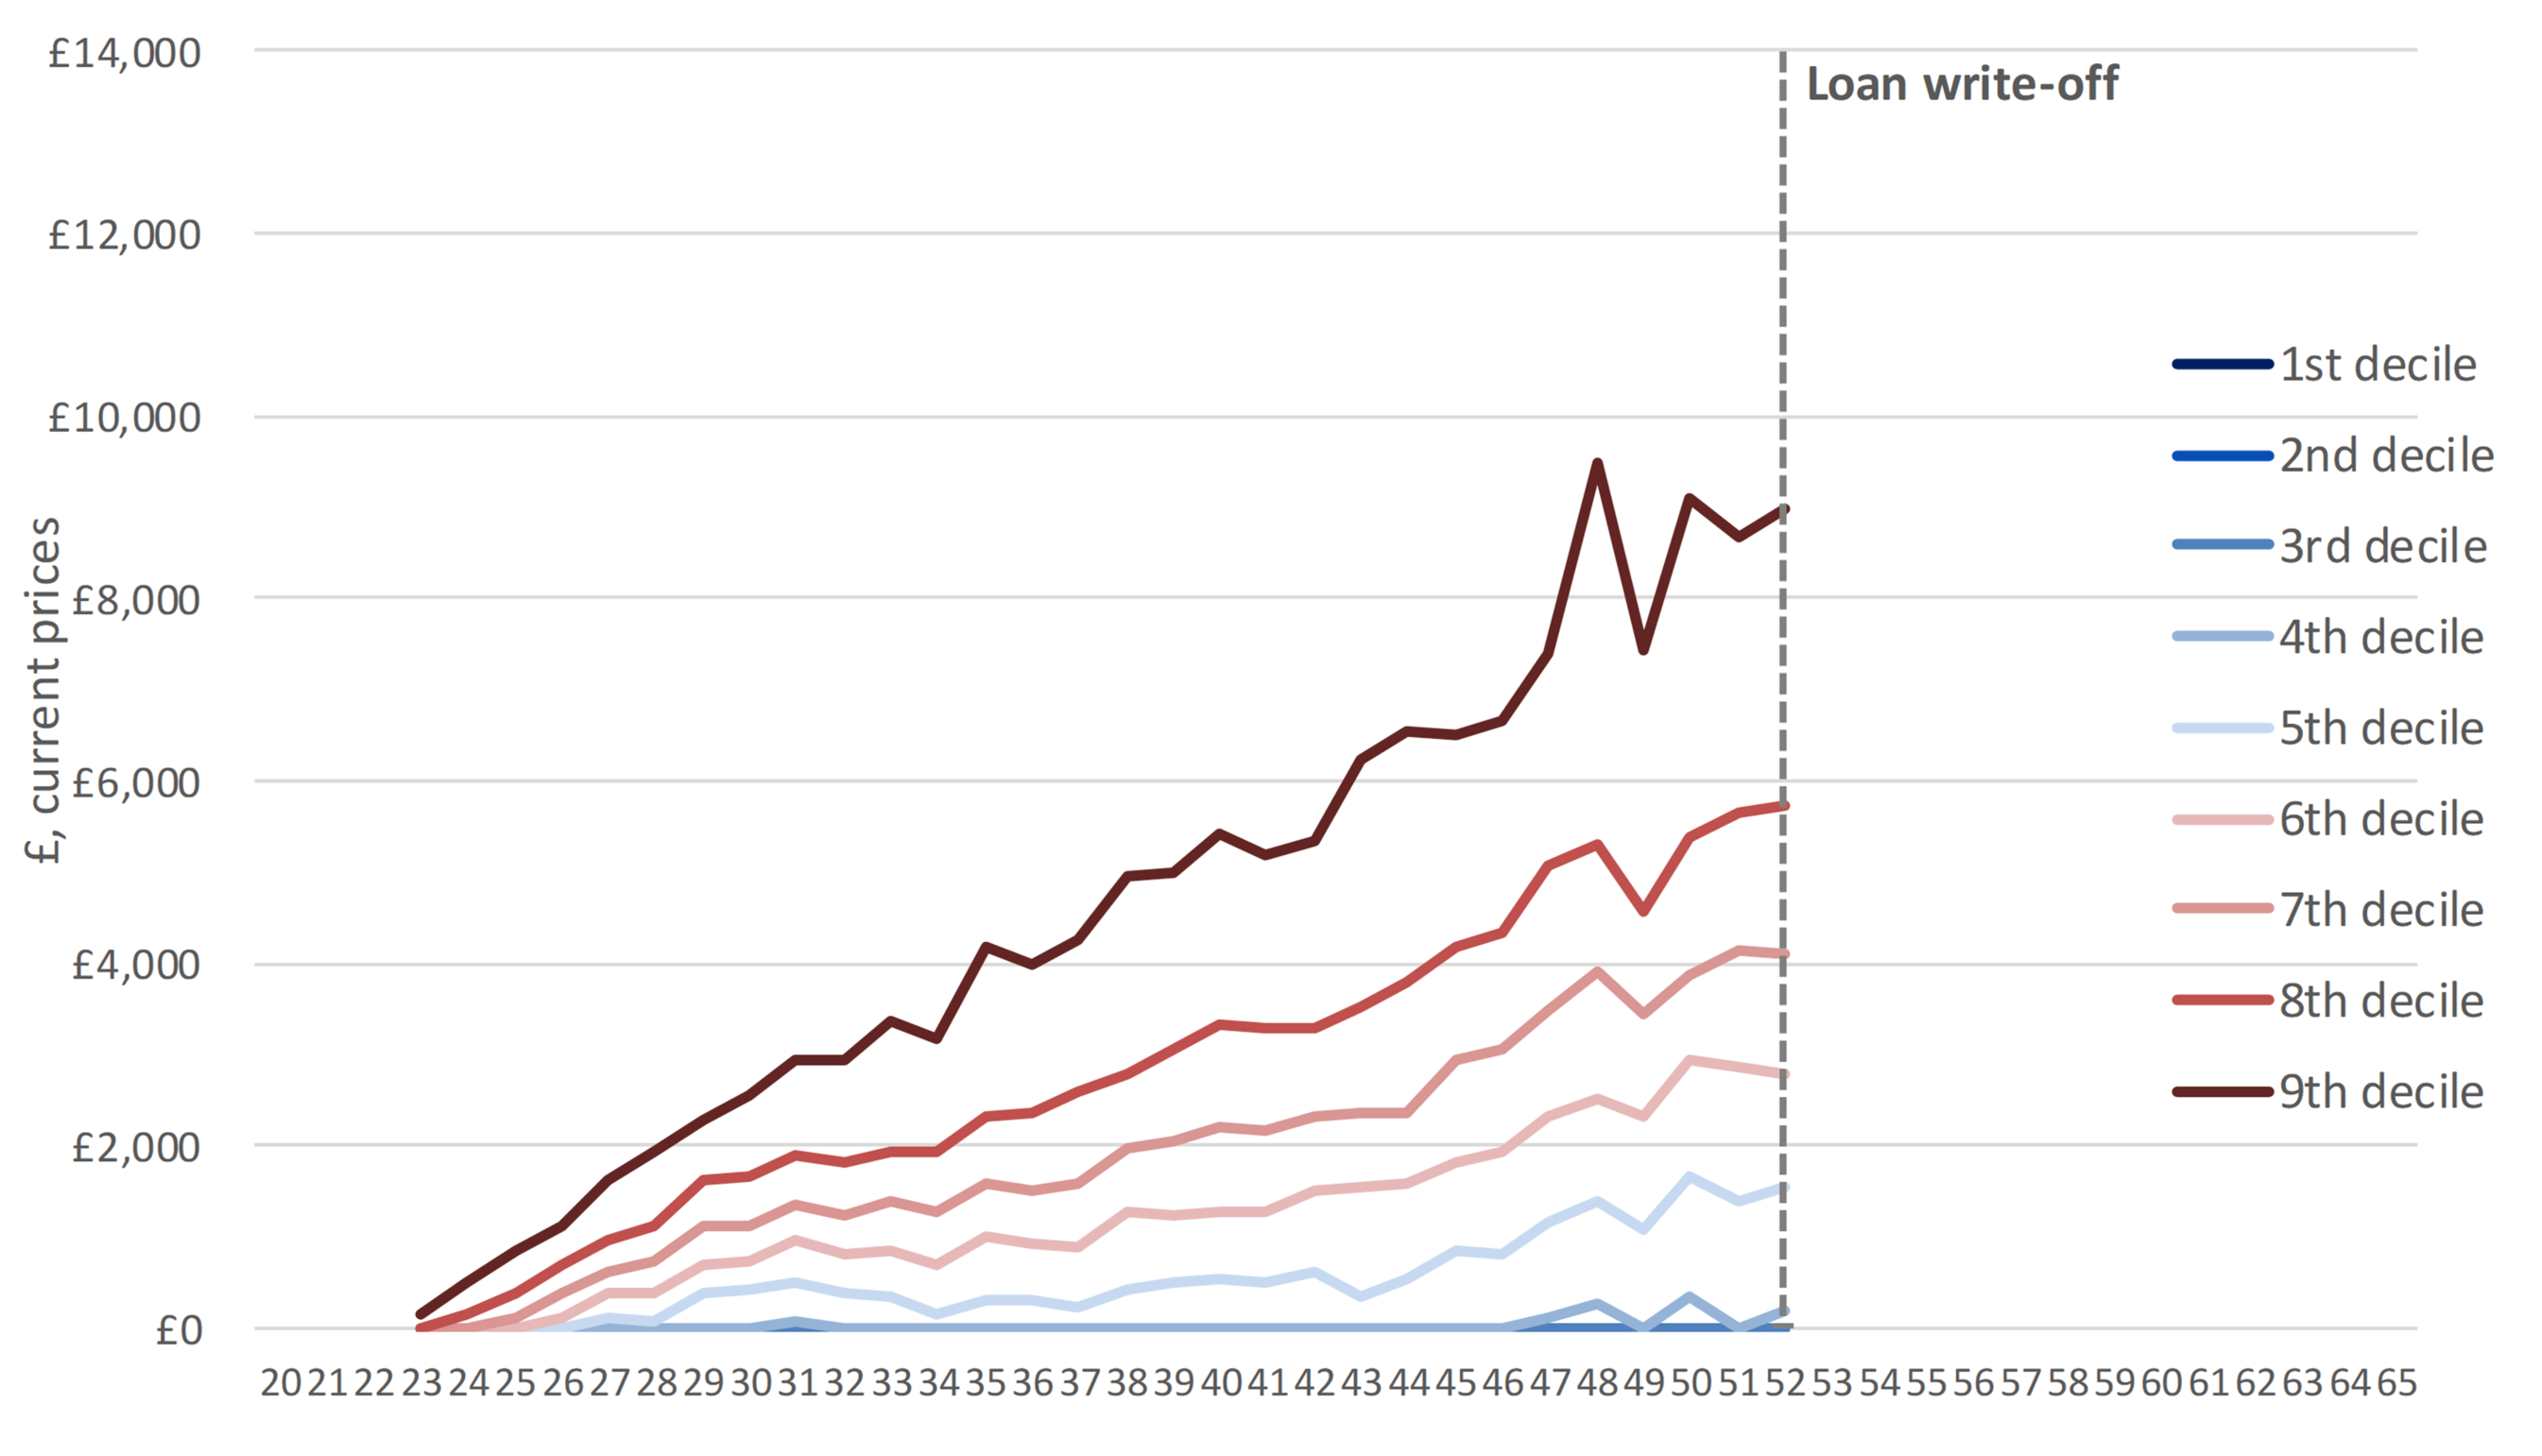
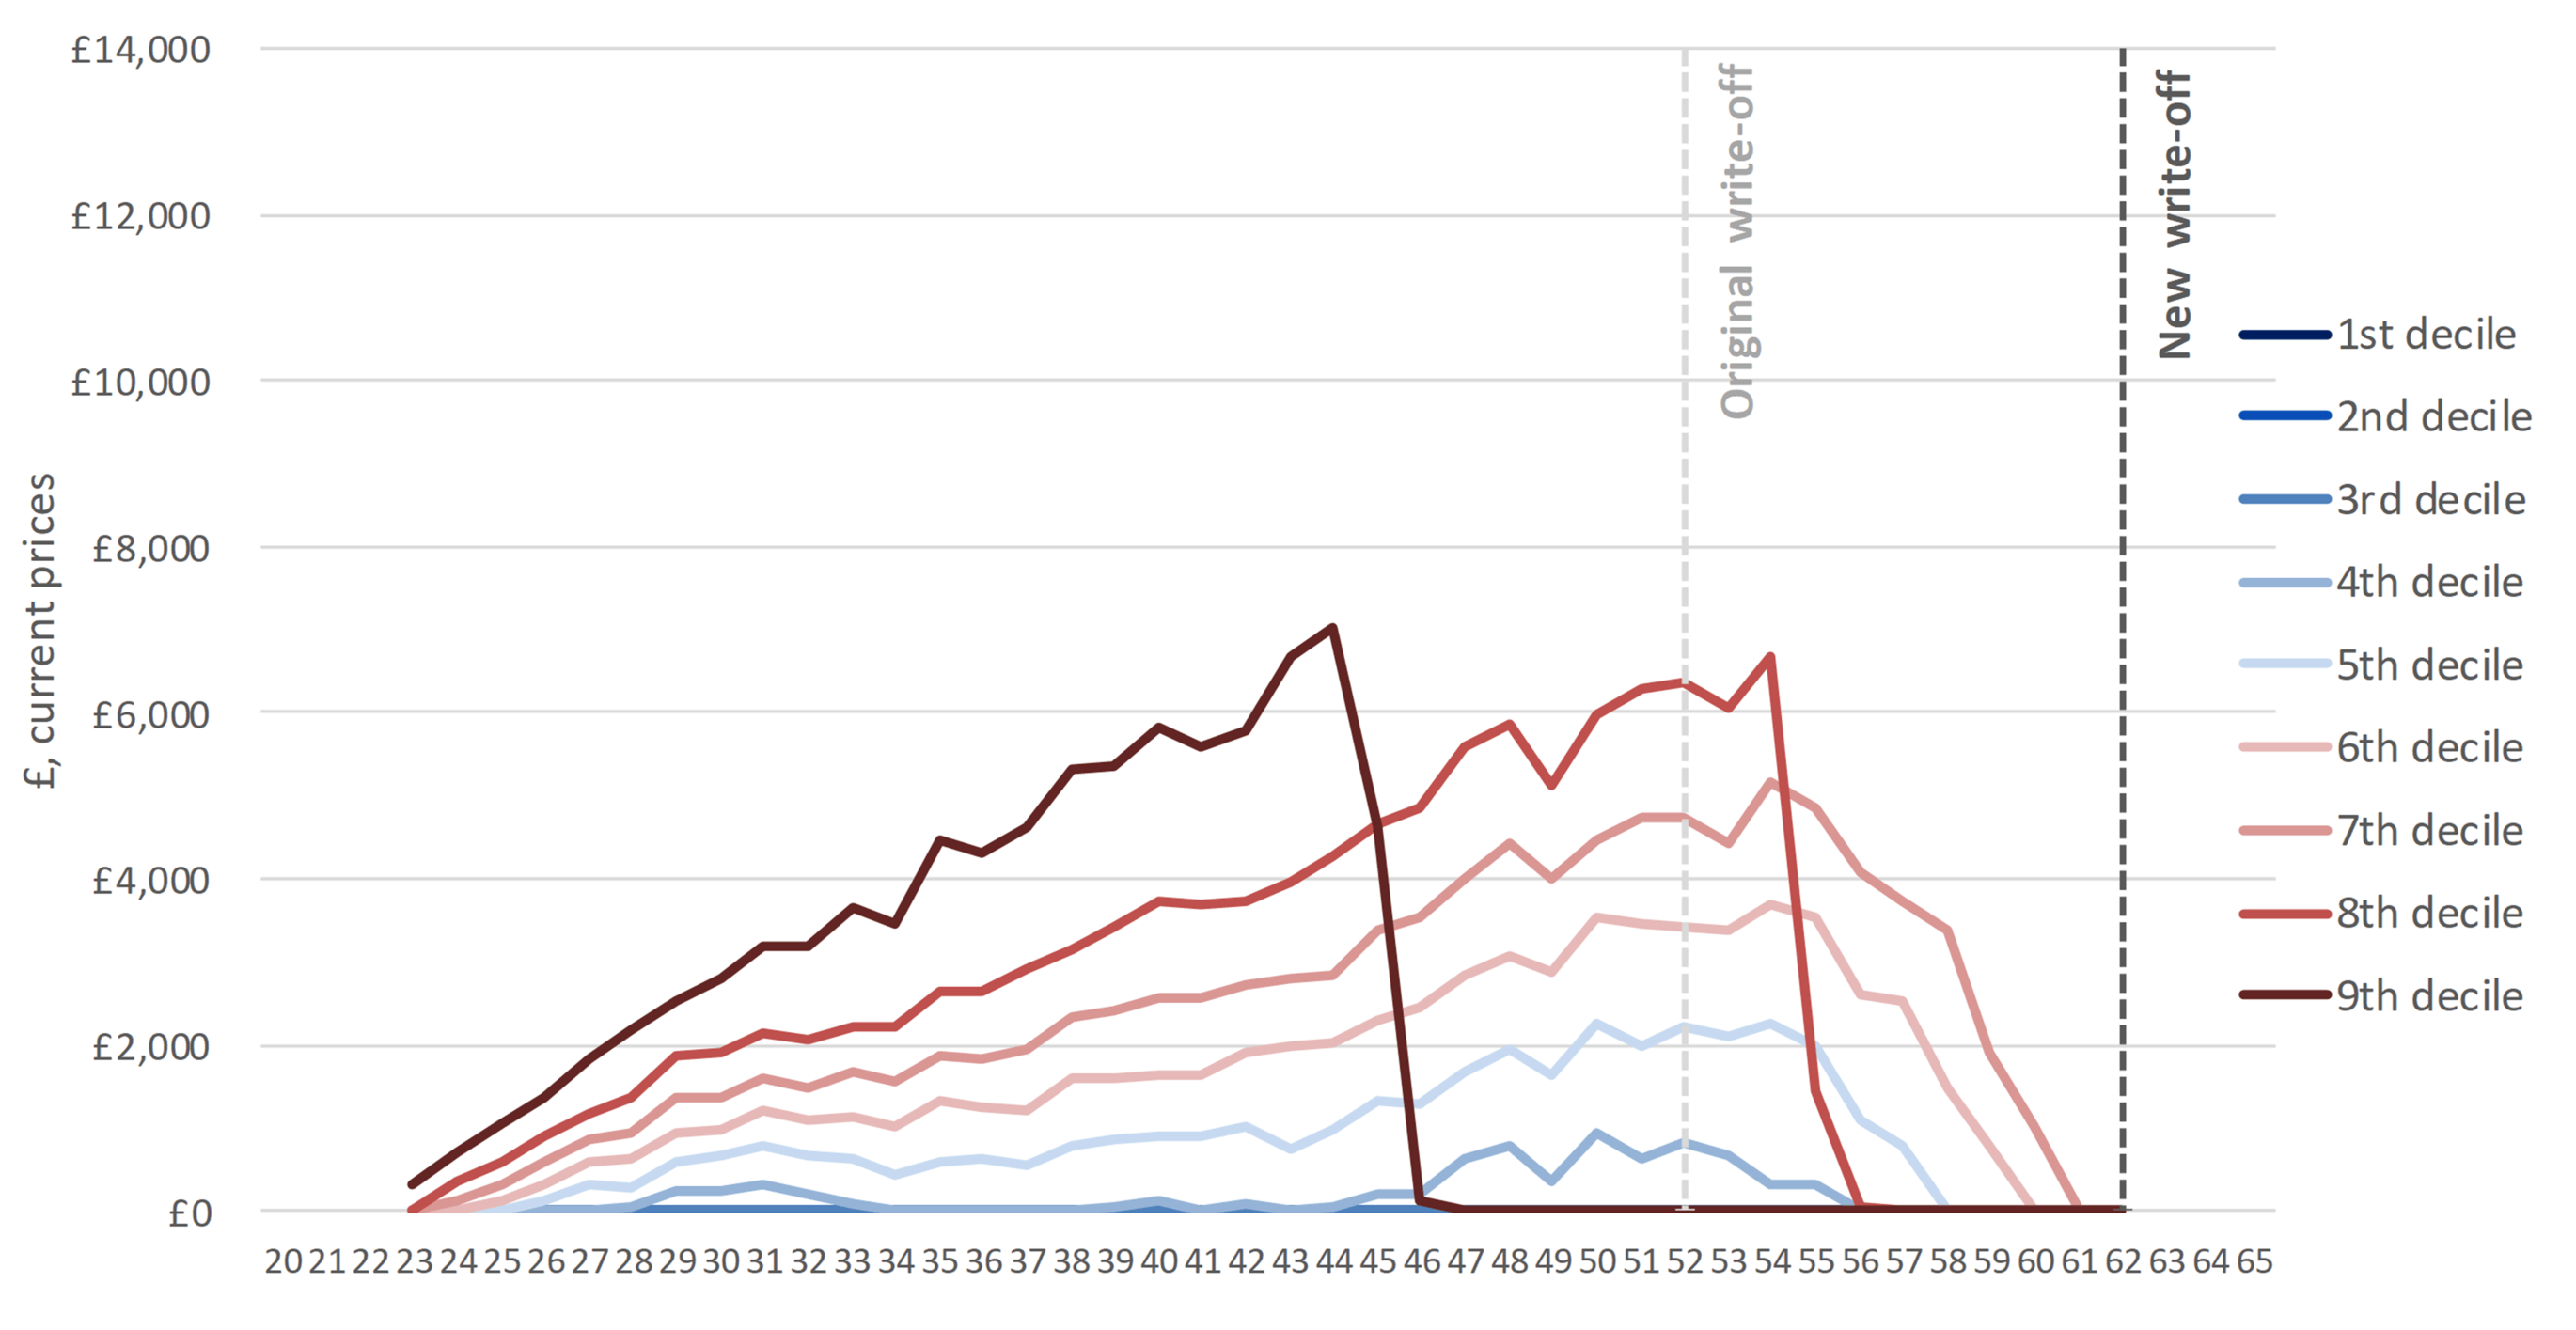
Annual loan repayments by full-time undergraduate degree graduates (£ in current prices, cash terms), by age and decile – women
Proportion of graduates never repaying the full loan

Proportion of graduates never making any loan repayment
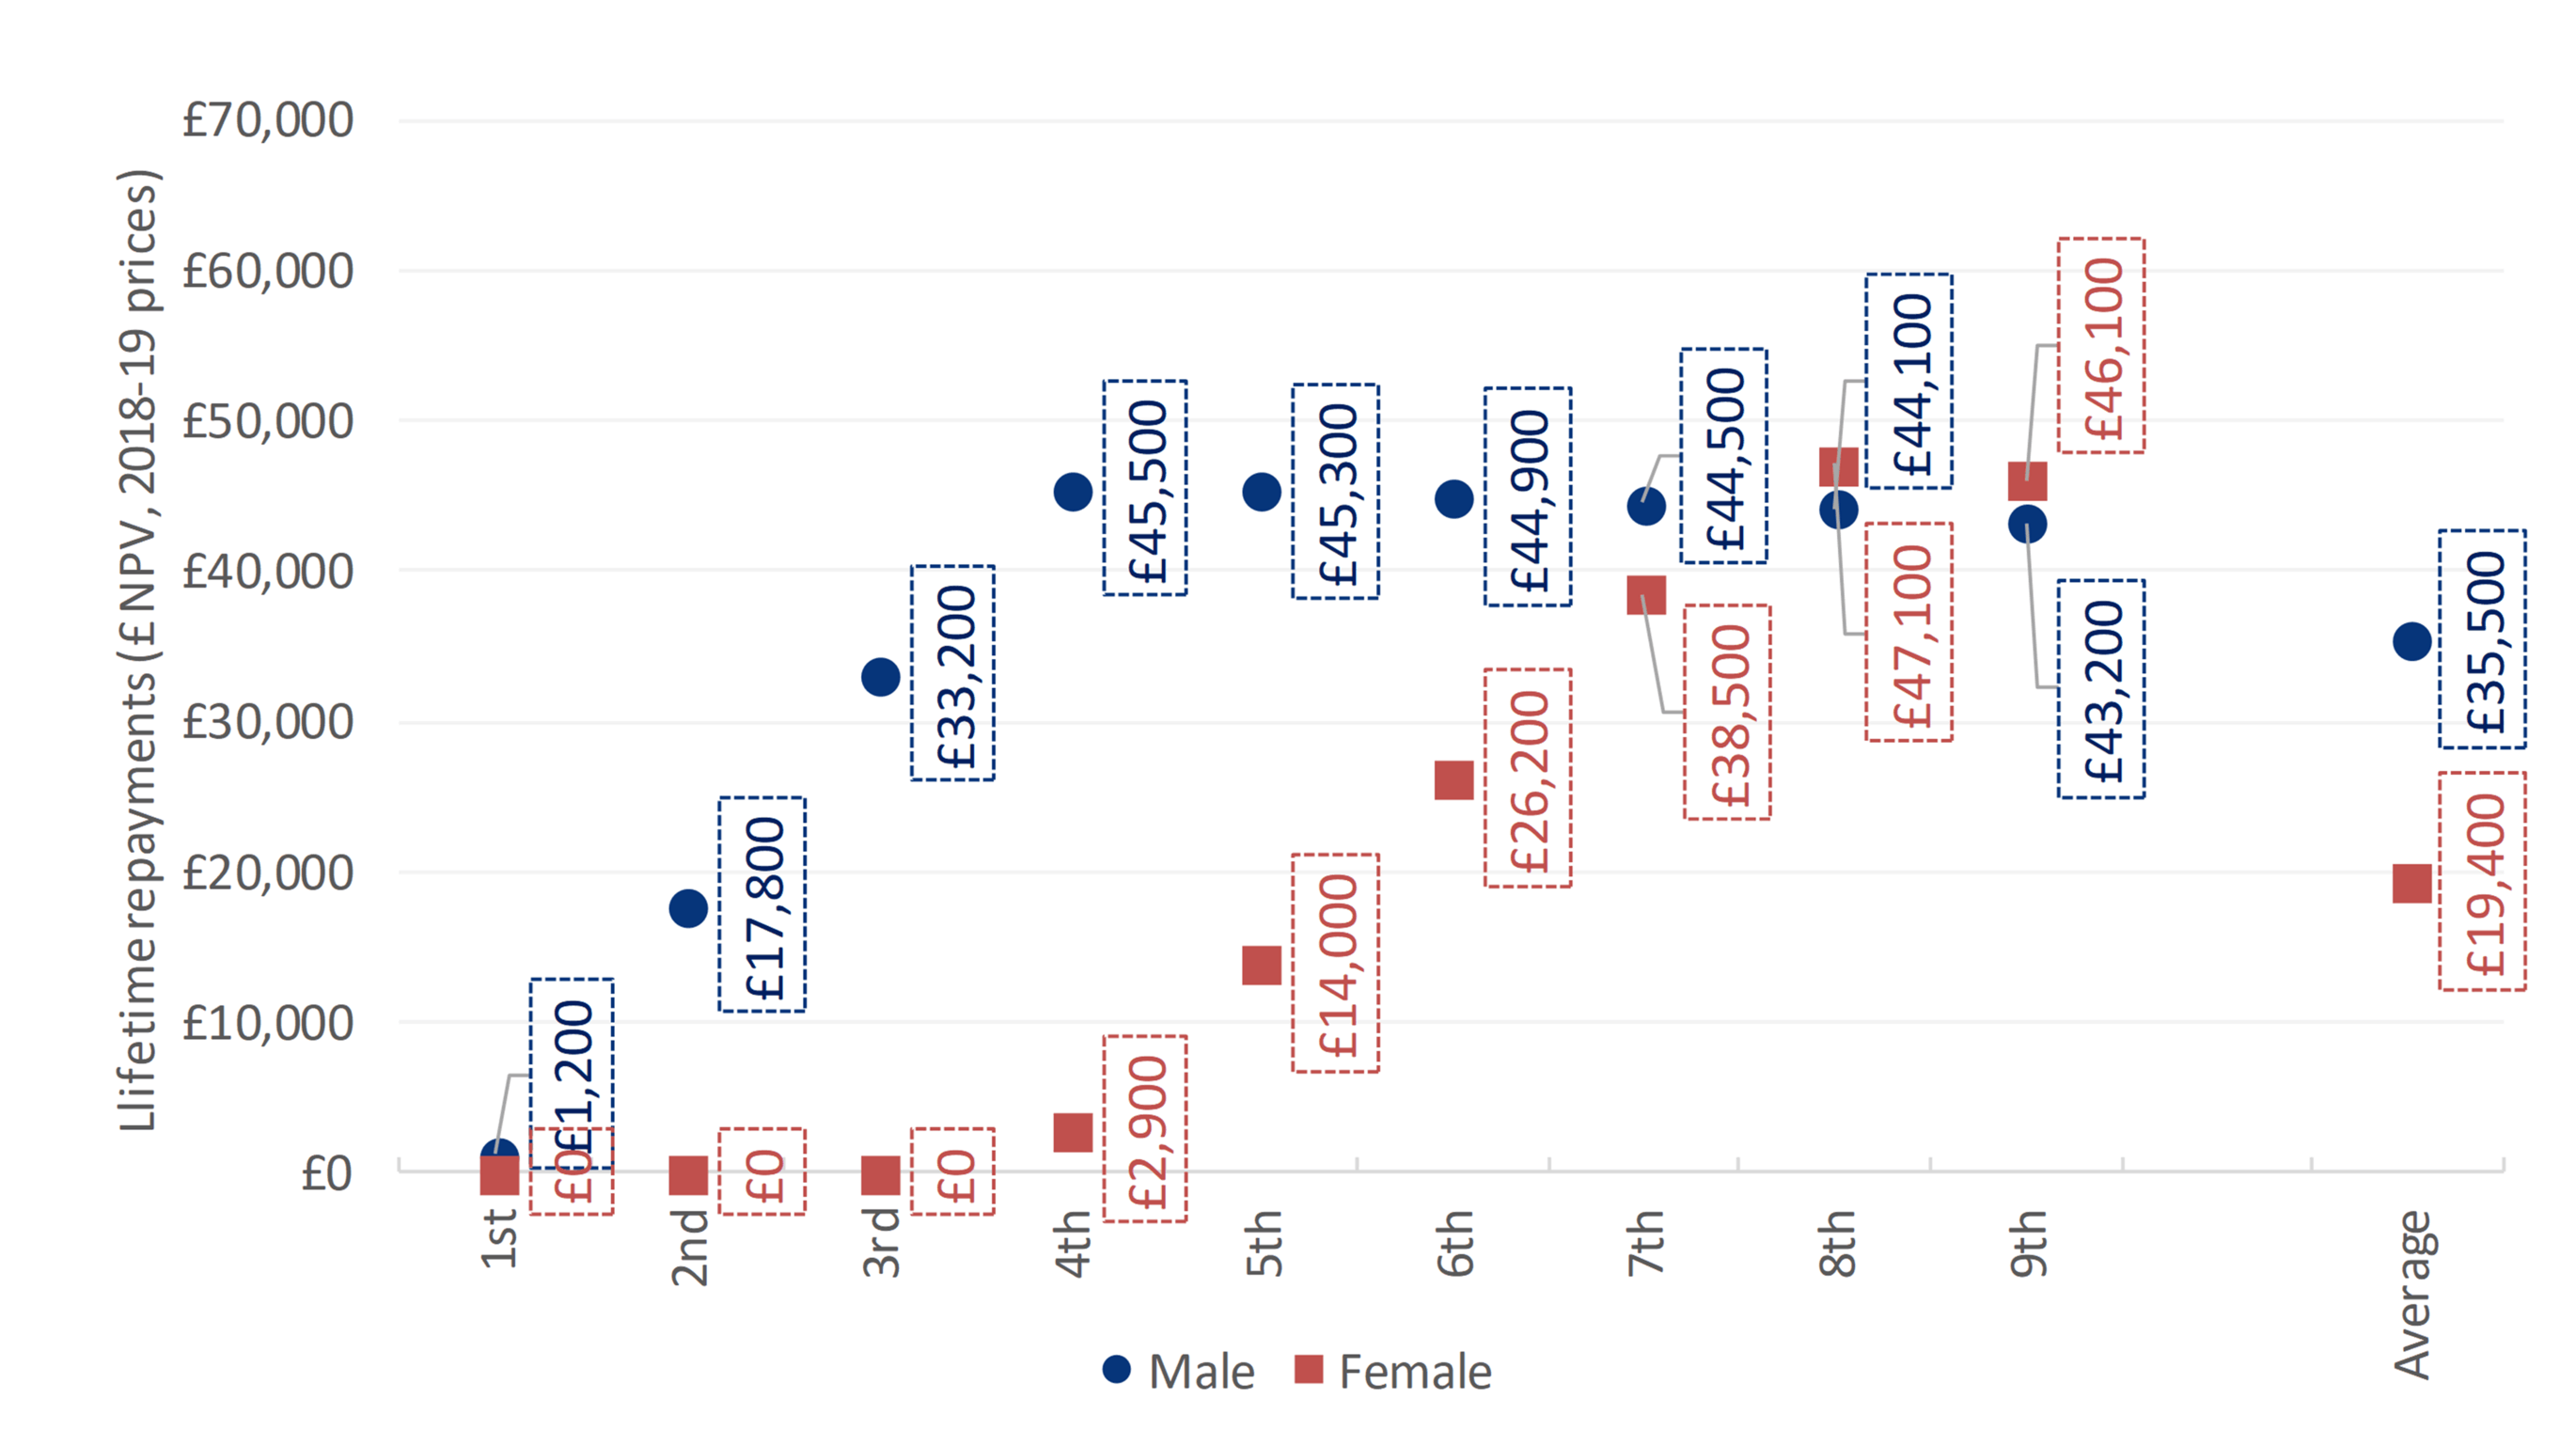
Lifetime loan repayments by FT undergraduate degree graduates (NPV in 2018-19 prices), by earnings decile and gender
Which Augar recommendations have we modelled?
We modelled the combined impact of the following recommendations:
- A reduction in the headline fee to £7,500 per annum alongside a corresponding top-up in teaching grant (notionally allocated equally in its entirety to Band A, Band B and Band C1 subjects) (recommendations 3.1 and 3.3). There is some uncertainty about this – both in terms of whether the resource flows back to HEIs or provides more general resource for wider industrial strategy – but, as a first pass, we have taken the “fiscal neutrality” approach.
- The re-introduction of means-tested maintenance grants – but replacing maintenance loans for the least well-off students (rather than being in addition to) (recommendation 7.1 and 7.3).
- The reduction in the repayment threshold to £23,000 with corresponding reductions in interest rate thresholds (recommendation 6.2);
- An extension of the loan repayment period to 40 years (recommendation 6.3); and
- The removal of real interest rates during study (recommendation 6.4).
The only recommendation that requires significantly more thought (and we don’t fancy being in the Student Loan Company’s shoes!) relates to the lifetime repayment cap whereby no graduate should repay more than 1.2 times the initial amount borrowed (in real terms – recommendation 6.6) – and we have not modelled this here (yet). [Update 2/6/19: model including repayment cap can now be found here].
What is the combined impact of these recommendations?
The Exchequer
The total cost to the Exchequer per cohort if all of these Augar recommendations were implemented was estimated to be £8.50 billion per cohort (an increase of only £0.07 billion per cohort, less than 1%). In other words, the recommendations are effectively cost-neutral:
- The write off associated with maintenance loans stands at £1.51 billion, with a further £2.47 billion associated with tuition fee loan write-offs. This represents public savings of £3.22 billion compared to the current (2018-19) system – resulting from the proposed reduction in the repayment threshold, the reduction in the volume of fee and maintenance loans, and the extension of the repayment period.
- The reintroduction of maintenance grants would cost the Exchequer £1.46 billion.
- The increase in compensating teaching grant (assumed to be shared equally across Band A, Band B and Band C1 subjects – though by no means certain) would result in a further £1.82 billion in Exchequer costs.
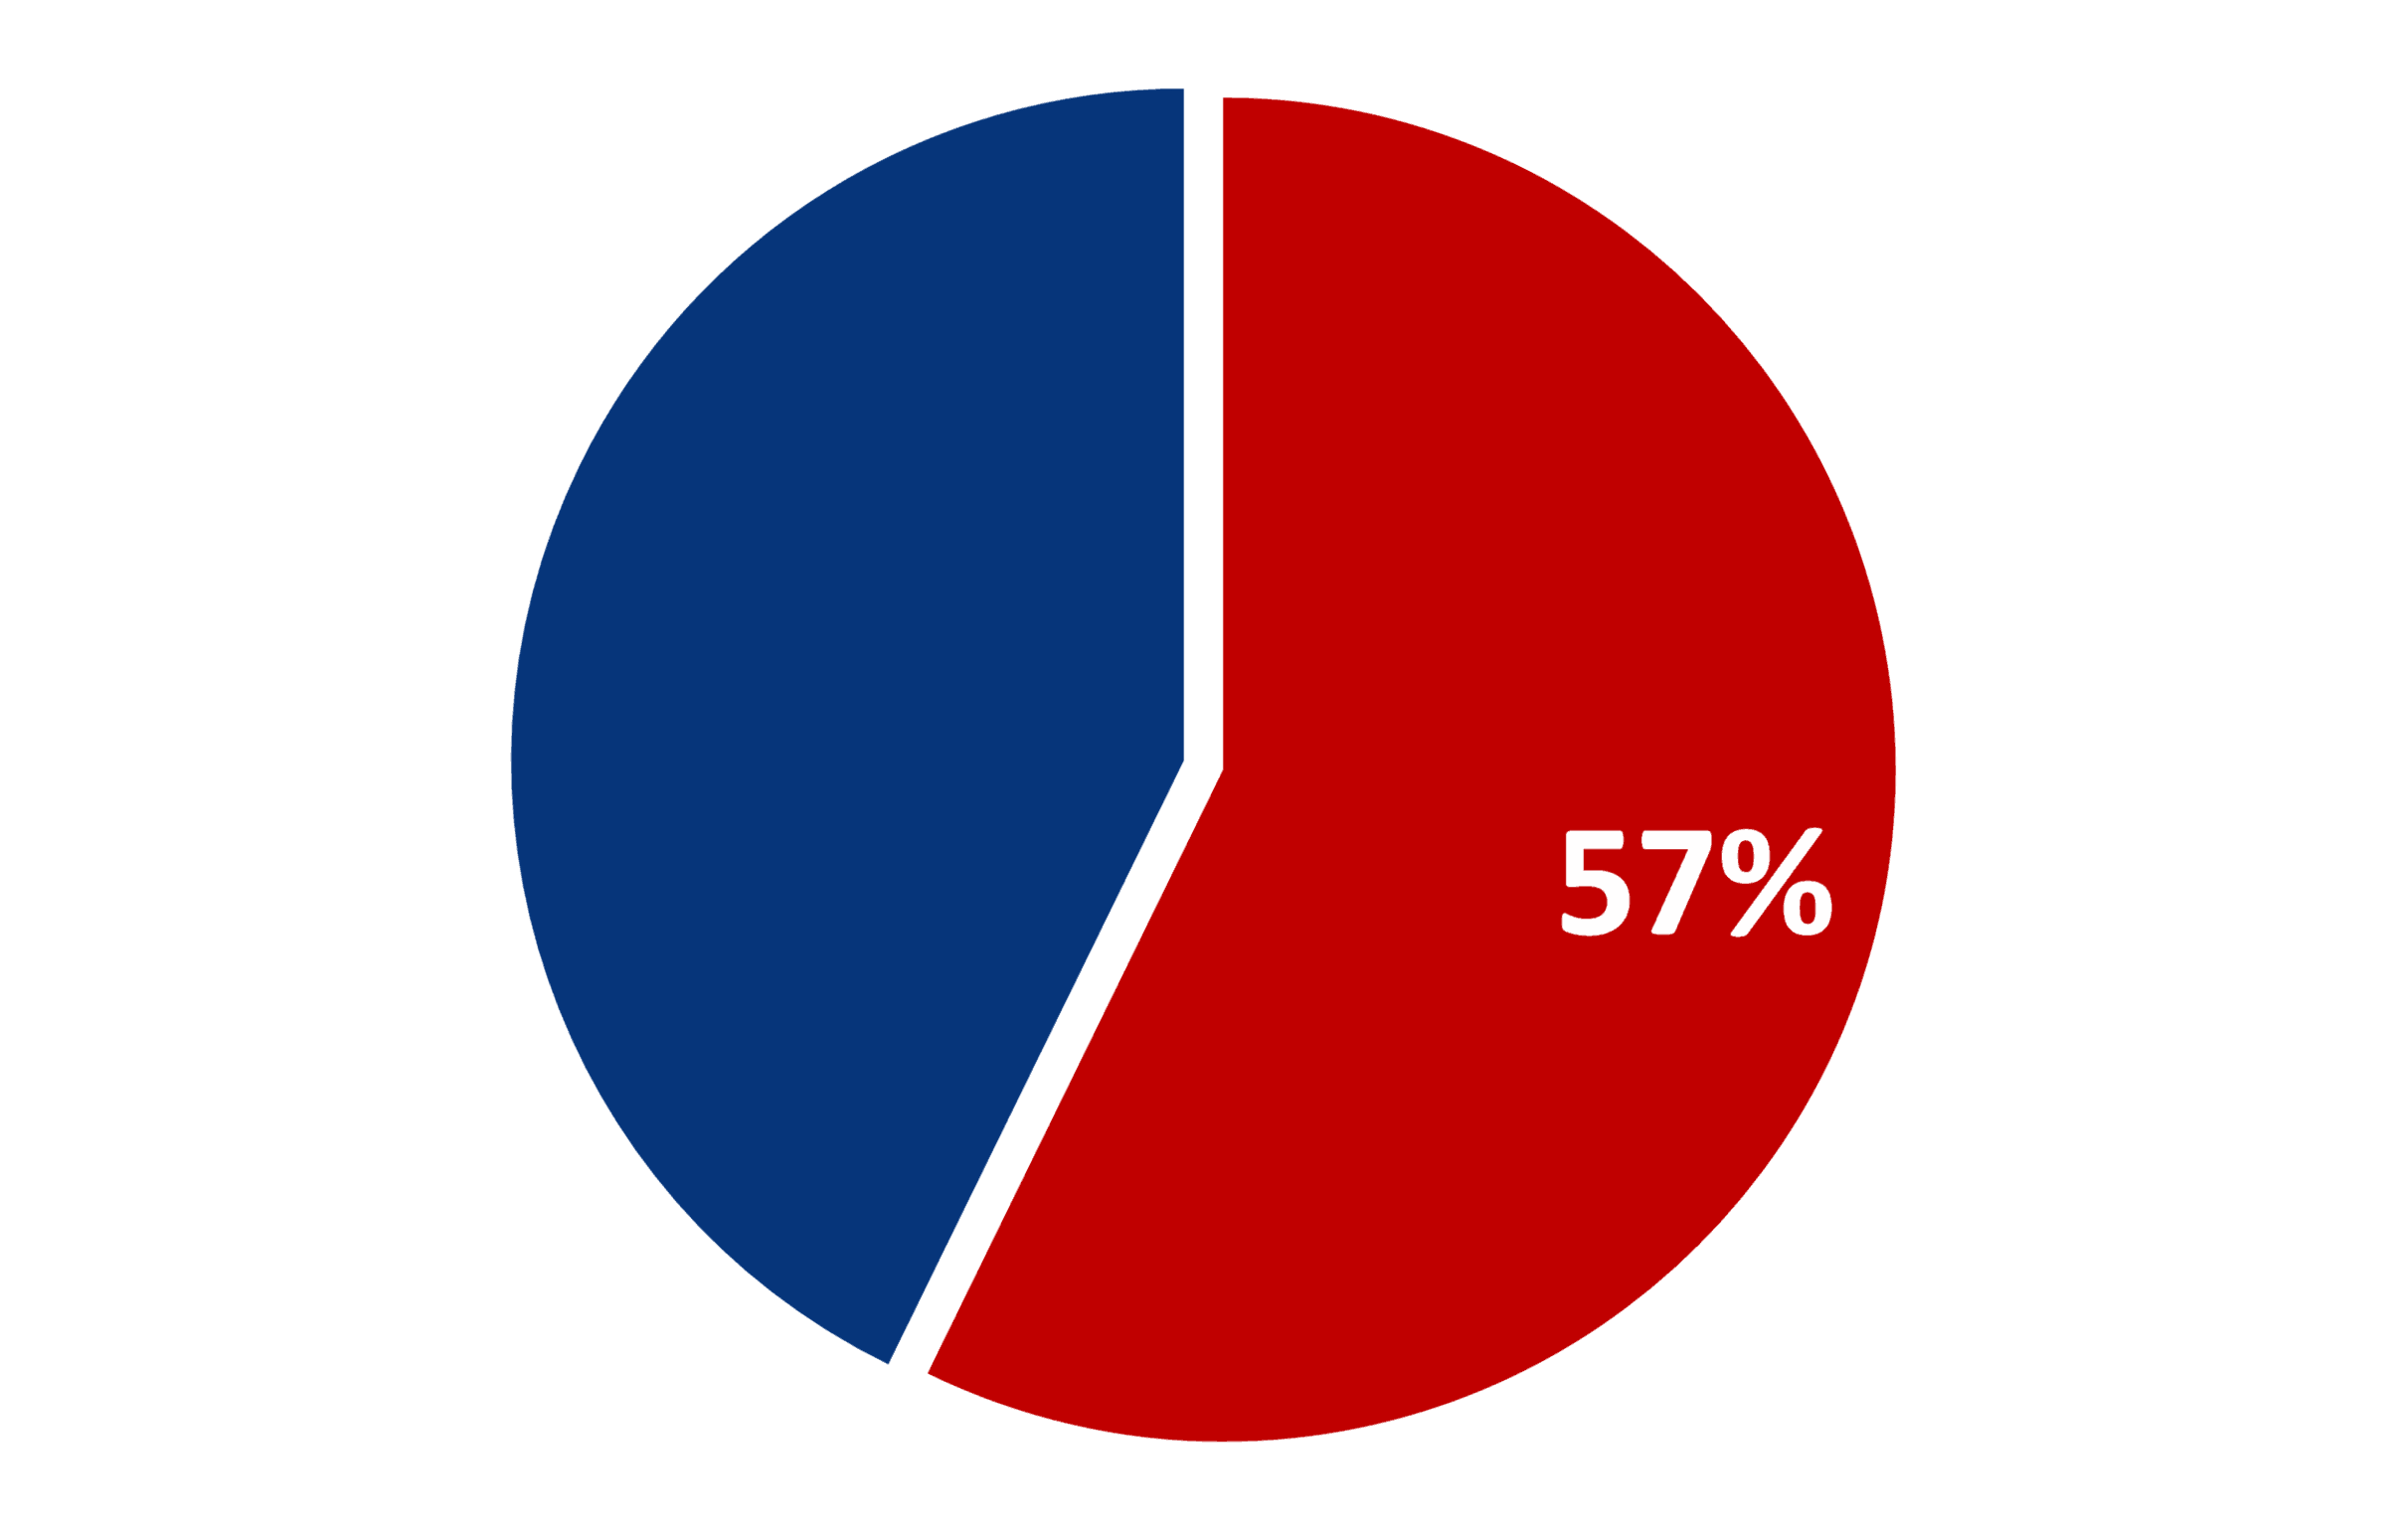
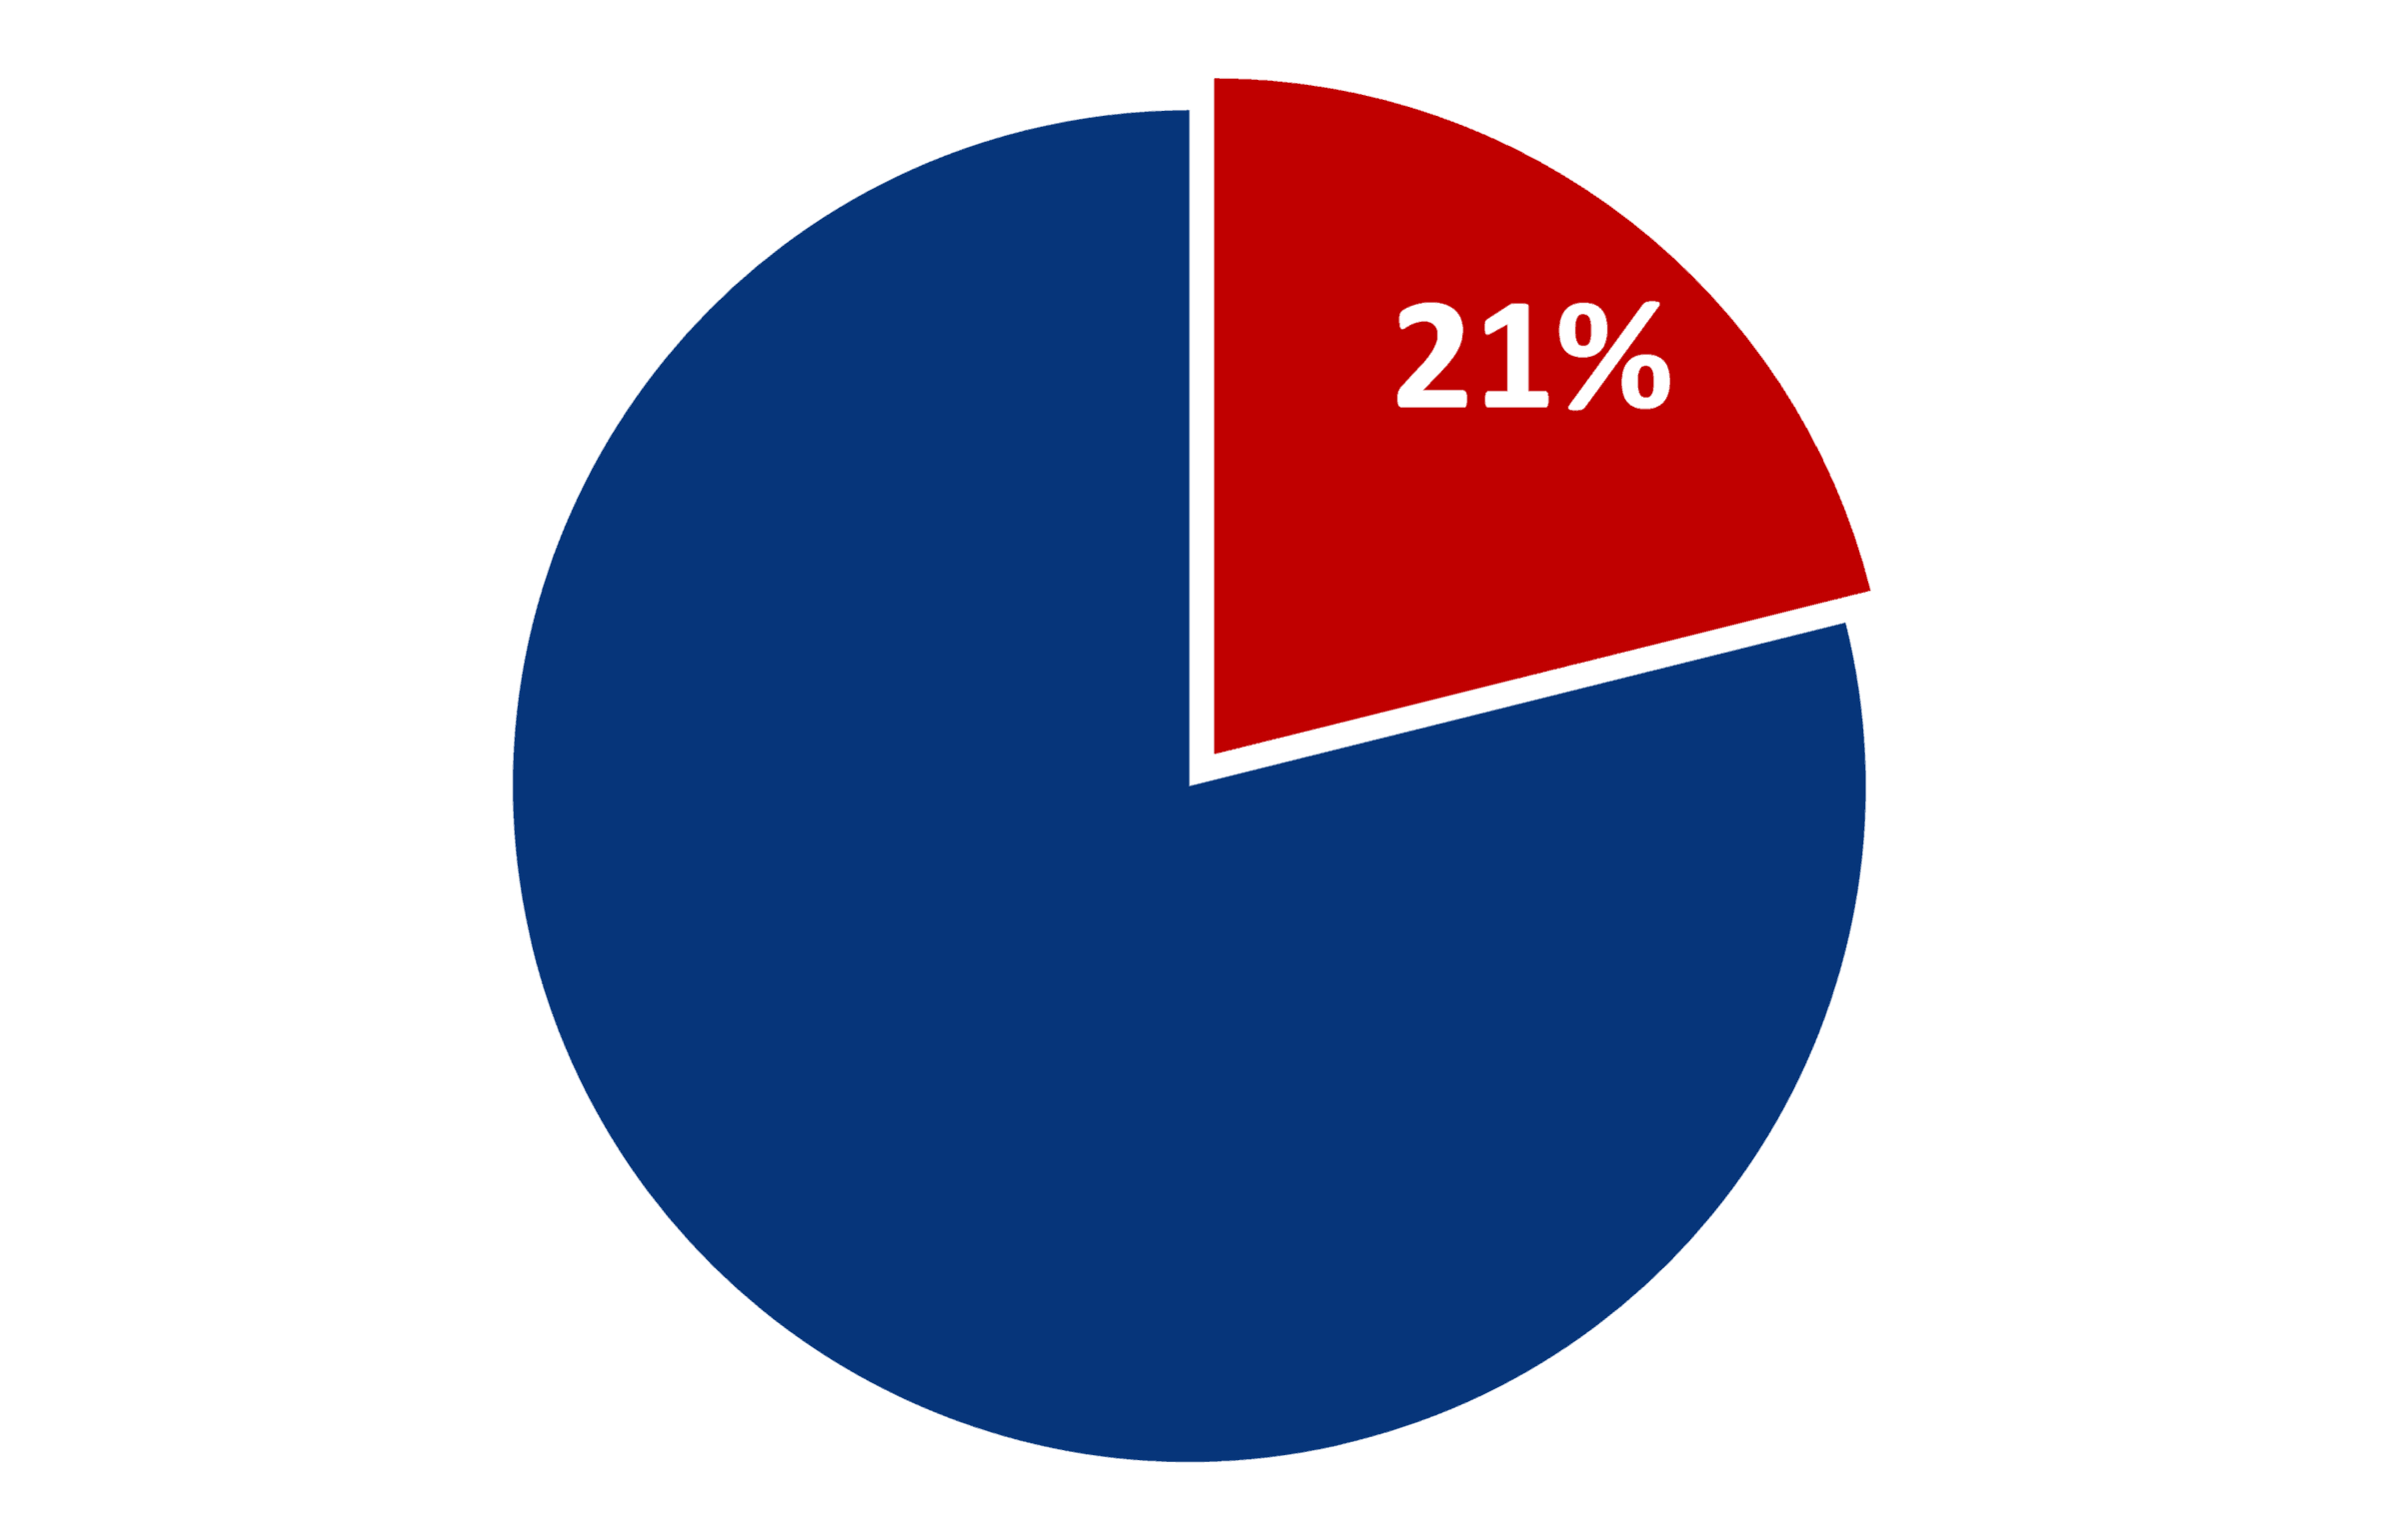
- The RAB charge would decline by 12.5 percentage points – to 31%. Approximately 57% of all graduates are not expected to repay the full loan balance (within the new 40 year repayment period). Approximately 21% of graduates are not expected to make any repayment of their student loan (i.e. never reach the lower repayment threshold of £23,000).
Higher education institutions
- Reflecting the reduction in tuition fees, higher education institutions would receive £1.90 billion less in gross tuition fee income per cohort. English providers would see a £1.82 billion decline, while Scottish, Welsh and Northern Irish institutions would see a decline of approximately £0.08 billion.
- Assuming that the top-up of the teaching grant in Band A, Band B and Band C1 subjects manifests, the reduction in tuition fee income would be entirely offset by an additional £1.82 billion in teaching grant funding.
- Combining net tuition fee income (after bursaries) and teaching grant funding, total HEI income is estimated to be £11.13 billion (compared to £11.09 billion in 2018-19).
- The unit of resource per student per annum would remain unchanged on average – though the reallocation of teaching grant towards high cost, high priority or high value subjects would have significant distributional effects across HEIs.
Students and graduates:
- For a representative student, the Augar recommendations would offer up to £8,430 in student maintenance support per student per annum (p.s.p.a.) – through a mix of maintenance grants and loans. Across all students, the average loan is estimated to be £5,360 p.s.p.a. while the average maintenance grant is estimated to be £1,540 p.s.p.a.
- Average debt on graduation would decline to £35,900 – a decline of £10,900.
- Average lifetime loan repayments (NPV in constant 2018-19 prices) for students undertaking full-time undergraduate degrees are estimated at £35,500 for men (a decline of £3,200) and £19,400 for women (an increase of £2,800).
- The outstanding loan balance (in cash terms) at the end of the repayment period was estimated to be £30,400 for men (a decline of £28,300) and £82,700 for women (a decline of £24,200).
| Resource flows | Baseline | Augur recommendations | Difference |
|---|---|---|---|
| (£/pp) | |||
| Exchequer | |||
| Cost of maintenance grant | £0m | (£1,461m) | (£1,461m) |
| Cost of maintenance loan | (£2,808m) | (£1,511m) | £1,297m |
| Cost of tuition fee loan | (£4,387m) | (£2,467m) | £1,921m |
| Cost of Teaching Grants | (£1,236m) | (£3,060m) | (£1,823m) |
| Total Exchequer Cost | (£8,431m) | (£8,499m) | (£67m) |
| RAB Charge | 43.50% | 31.00% | -12.5 pp |
| Higher education institutions | |||
| Gross fee income | £10,044m | £8,144m | (£1,900m) |
| Teaching Grant income | £1,236m | £3,060m | £1,823m |
| Cost of bursary provision | (£188m) | (£78m) | £110m |
| Total | £11,093m | £11,126m | £33m |
| Net HEI resource per student p.a. | £9,000 | £9,000 | £0 |
| Students/Graduates (FT undergraduate degrees) | |||
| Average debt on graduation | £46,800 | £35,900 | -£10,900 |
| Average Lifetime repayments (M) | £38,700 | £35,500 | -£3,200 |
| Average Lifetime repayments (F) | £16,600 | £19,400 | £2,800 |
Augur Review recommendations – in charts
Annual loan repayments by full-time undergraduate degree graduates (£ in current prices, cash terms), by age and decile – men
Annual loan repayments by full-time undergraduate degree graduates (£ in current prices, cash terms), by age and decile – women
Proportion of graduates never repaying the full loan
Proportion of graduates never making any loan repayment
Lifetime loan repayments by FT undergraduate degree graduates (NPV in 2018-19 prices), by earnings decile and gender
So, who are the winners and losers?
In reality, it’s relatively hard to predict who the winners and losers are in respect to higher education – predominantly because we don’t know how or whether many of the recommendations will be implemented. However – if all of the above recommendations were to be implemented – the main winners are:
- High earning (predominantly male) graduates, who would repay less, and pay off the lower loans more quickly;
- Students from less well-off backgrounds receiving maintenance grants;
- Higher education institutions offering a substantial component of high-cost Medicine, Dentistry and STEM subjects; and
- Philip Augar and his Review Team. It is no mean feat that the total change in the resource cost to the Exchequer – as well as the impact on the deficit – is essentially zero. This was a well-considered report – and although not everyone will agree with the recommendations – there was some serious thought about the complex interplay of the different components of the fees and funding system. Credit where credit is due!
On the flip side, the main losers under Augar are:
- Graduates (predominantly female) with moderate earnings, who are likely to end up repaying more over the extended repayment period than is currently the case – though we have not modelled the impact of the proposed cap on loan repayments;
- Higher education institutions offering a substantial component of Arts, Humanities and Social Sciences degrees (especially those that are not perceived as “high value” or “high priority”);
- Higher education institutions outside of England – and especially Wales (who face the unenviable position of English-domiciled students paying lower fees than their Welsh contemporaries), and
- The Student Loans Company – who may have to implement this.
Part II of this analysis includes modelling of the repayment cap, which changes the overall picture.


[…] https://wonkhe.com/blogs/who-are-the-winners-and-losers-from-the-augar-review/ […]