


One of the central questions in post-compulsory education is the role of the state.
There’s a (contested) conceptualisation in which state funding for tertiary study is a way of purchasing a skilled workforce – which immediately prompts us to ask the really salient questions – which skills? Where? How much for?
In the UK, we seem to be leaving an era where we are content to leave these questions to the market and entering a period where active choices are made, backed up by data. Indeed – one of the primary roles of Skills England is to collate and present this data for the benefit of local and national skills plans (skills fans will note that this is the work of the former Unit for Future Skills).
I did go over some of the findings of this unit (cunningly rebadged as Skills England outputs) in terms of overall skills demand at a national level. The released data goes deep into which occupations are currently experiencing demand.
So if we can (apparently) answer the question as to which skills are needed – the next question would be where.
Skills in areas
The Skills and Post-16 Education Act created the concept of a “Local Skills Improvement Plan” (LSIP) – now in place for every area in England. LSIPs don’t map clearly to local government boundaries (or even to more established skills focused ones like a travel to work areas or local education partnerships), instead were designed to emerge organically, and actually came together primarily around consortia of local chambers of commerce.
Employer representative bodies came together to identify skills needs, which were then to be delivered by local post-16 providers. The big flaw is that there was a lot of demand for higher level skills, and the problem with LSIPs is that universities were not explicitly included as educational providers. This is slowly beginning to change, not least because many universities have taken the initiative.
The documents themselves are an expression of current skills priorities for the area in question. Current skills needs are fascinating, but may or may not be useful when we are thinking of spinning up and delivering courses – which is very much a multi-year project.
Enter skills needs forecasting. There’s been a few attempts at this, but the key attempt that gets into local areas is the Skills Imperative 2035 programme led by the National Foundation for Educational Research with the support of the Department for Education and the Nuffield Foundation.
Here we get a look at anticipated trends in local employer demand by occupation, sector, and qualification, for LSIP areas in England.
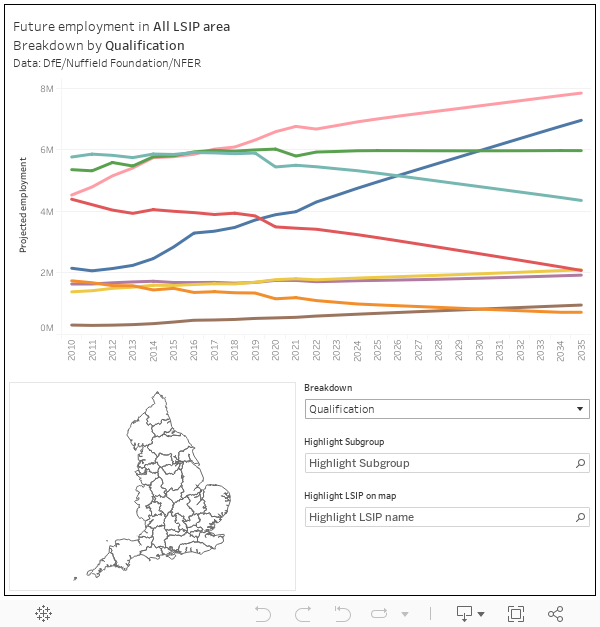
Choose your LSIP area by clicking on the map at the bottom right (you can find areas using the highlighter at the bottom, and then use the “breakdown” drop down to choose your measure of interest. You can highlight a subgroup within these measures using the “subgroup” highlighter. If you click off the map (in the sea, in fact) you can see totals for England.
The chart at the top shows your chosen measure for each year between 2010 and 2035 – points from 2022 onwards are projections, before then we see actual figures.
Crystal ball
The NFER projections are based on some fairly sophisticated economic models applied to Office for National Statistics models of “regional accounts” of local areas. As the team themselves put it:
The forecast should be seen as providing a reasonably consistent, comprehensive and sustainable view of the development of the economy which is built up from projections of individual industries. Part of the plausibility comes from the fact that strong trends over history, such as the extraordinary growth in household expenditure in the run-up to the 2008 recession, have not been thought to be sustainable because of their implications for the balance of payments and for inflation. Assumptions are made in the projections about changes in policy or behaviour, which produce changes in such trends and credible outcomes for both the macro economy and the individual industries.
When you plot projections as a time series, it is initially off-putting to compare the peaks and troughs of the real data to the straight-line projections. For me, I think work like this is more useful in terms of a general direction of travel than the precise numbers in question, and the straight lines actually make this easier to see.
One of the clearest trends we can see is a steady rise in demand for first degree (L6) and masters degree (L7) skills. For the whole of England the forecast calls for two million more potential employees with L7 skills than we have currently, plus around a million more L6 workers (of course, those new MSc graduates will probably need to have done a L6 qualification first!).
This comes down to a high and rising demand in professional occupations – business and public service roles, science and technology, health and education professionals. We also need more managers and directors, and more care workers. However, this direction of travel is similar in most LSIP areas, though the persistence of residual demand is interesting – especially when you view this through and industrial sector lens (look at food and accommodation in Cornwall or professional services in London, for instance).
Actual jobs (in Stevenage)
The most recent Unit for Future Skills dashboards include a summary of online job advertisements in December 2023 – and this time, we get down to lower tier local authority level.
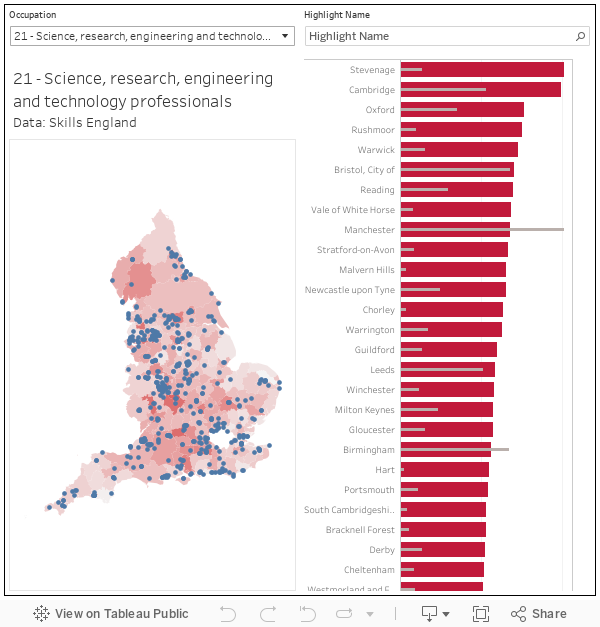
What I’ve plotted here is the proportion of job adverts in each local authority for each occupation (the thick red bars) and the number of adverts for each occupation (the thin grey bars). The map shows a darker red for an area with a higher proportional demand – the blue dots are higher education provider campuses (and you can show only those linked to a particular provider using the “name” highlighter). London is omitted – as I felt Greater London was too large an area to compare to other places, while boroughs were too small.
I’m going to imagine you are still reeling from the knowledge that more than a tenth of all December 2023 online job adverts in the Stevenage area were for science, research, engineering, and technology professionals (numerically, there were more of these jobs in Manchester). It’s the kind of information that feels useful until you realise that December 2023 is unlikely to happen again, and that (I suspect) a single employer setting up a facility in Stevenage is not a predictable event.
Stevenage is, of course, in the Hertfordshire LSIP area, and we can see on the chart at the top that a rising demand for those kinds of roles is predicted in that area through to 2035. The area also sits in the proportional top three places looking for professional occupations more generally – just behind Oxford and Cambridge.
So who is serving that need? There’s not actually a university or higher education campus in Stevenage itself, but the University of Hertfordshire is just up the road in Hatfield (and there is a subsidised bus). The more time you spend with these maps, the more you realise that they make an eloquent case for university expansion.
Other data points
In terms of what people do in local areas like Stevenage, we can turn to the 2021 Census. We find that just 24 people worked in research and development in Stevenage on census day in 2021, and there were a credible but not earth-shattering 797 engineering professionals.
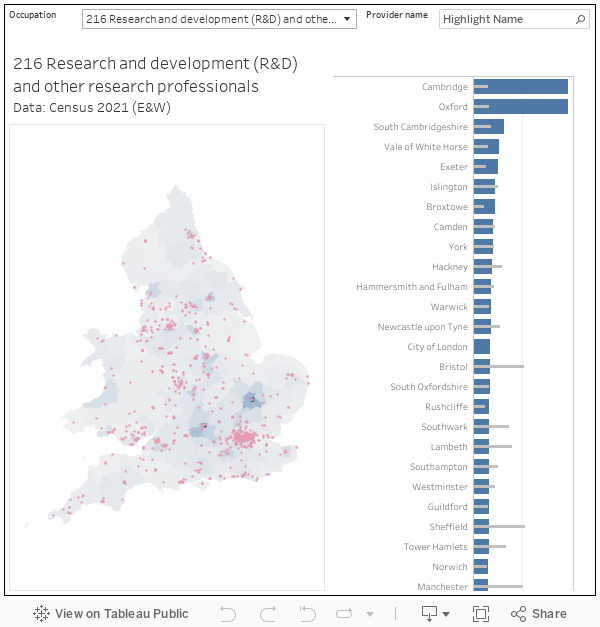
What it looks like we have here is a developing need for research and scientific skills in Hertfordshire, over the last few years. But with no provider delivering those kinds of L6 and L7 skills in the immediate area, staff will clearly be coming into the district from further afield. Because that is what tends to happen with professional skills – area specialisms are surprisingly rare and often stem from geology and geography (mining skills, incidentally, tend to be at a premium in Cornwall – toolmaking and fabrication in areas where heavy industry persists. For the majority of professional skills, stuff just aggregates into London or other large cities by default.
You can also see this if you look at the industries that people work in. The biggest industry in Stevenage, for instance, is construction and civil engineering. For the science and research industries there are huge concentrations in (yup) Oxford and Cambridge. The East Midlands makes most of the clothes that are made in England, creative arts employers cluster around London and Brighton.

Writing a local skills policy
Every area, of course, needs teachers, nurses, carers, and medical professionals. Beyond that, history and happenstance rather than planning dictates regional specialisms. Teesside may well want to become an environmental technology hub – but just 0.13 per cent of the working population had that kind of job in 2021. It may well want to upskill the local workforce in those areas, but to do so it needs to attract employer – and to do that it needs to be open to importing the required skills from other areas.
Deciding that an area will develop a new industrial specialism is not as simple as saying so. There’s a lot to be said for just assuming that we’ll need a lot more high level transferable skills (what we could equally call graduate skills) and investing accordingly. If you want, or intend, a local area to develop a new specialism this takes at least a decade of sustained focus.


Hi David – happy to catch up on LinkedIn Data around supply and demand for skills and in-depth analysis on jobs connected to career paths and opportunity. A useful set of reference points include the report on jobs on the rise in 2024 (https://www.linkedin.com/pulse/linkedin-jobs-rise-2024-25-uk-roles-growing-demand-linkedin-news-uk-x0oje/), and one emerging theme on the Green Skills reports on current and future demand in the UK that impacts across sectors and regions – https://economicgraph.linkedin.com/content/dam/me/economicgraph/en-us/global-green-skills-report/global-green-skills-report-pdf/linkedin-uk-green-skills-report.pdf
Employers don’t employ skills: they employ workers with knowledge, skills, and personal attributes. Reifying skills as does this post and much other commentary on employers’ demands alienates workers and fragments their work.
Indeed, through there’s an ASSumption that Graduates posses ‘knowledge’ (many sadly don’t) and that someone who’s been through the University sausage machine will have ‘skills’ (an even smaller number in my direct experience). Thus the bigger picture is University Graduates are often harder to employ and train in skilled work for a company than those who’ve undertaken vocational training or a ‘traditional’ apprenticeship, and too many Graduates ‘personal attributes’ fall way short too. But then much of what comes from the Wonks isn’t about real skills and working but about leveraging Universities positions to take advantage of potential funding opportunities.