


When ministers in the last Westminster in government responded to a question on the state of student financial support in England, they tended to include a reference to support on offer directly from universities.
So for example, last October when former universities minister Robert Halfon was asked about a 650 per cent uptick in student food bank users at the University of Kent, he was keen to point out to Rosie Duffield MP that the other large university in the city had help on offer:
One of her universities, Canterbury Christ Church University, provides a £600 bursary to students.
He didn’t mention that, like many other universities’ bursary schemes, it only applies if your household income is of £25,000 per year or less.
Nor did he mention that it has been £600 since before the inflation crisis, and that the family income threshold has also been stuck at £25,000 despite wage growth.
I urge anyone who is worried about their circumstances to speak to their university.
Ever since the introduction of tuition fees into England’s system, there has been an assumption that at least some of the money should be spent on student financial support over and above that provided by the national statutory schemes.
Some argue that local decision making (aka institutional autonomy) is better at designing schemes that get the money to where it’s really needed.
Others argue that redistributing fee income within a provider rather than across the country means that financial support is based not on need, but on the number of other students at your university that need it.
Who’s right?
Looking back
In the olden days, each year the Office for Fair Access (now merged into the Office for Students) would tell us, at a provider level, how many “OFFA countable” students each provider had, and how much they were spending on hardship, bursaries, scholarships and fee waivers.
It allowed us to see how generous providers were being with their “additional” (top-up) fee income, and it highlighted that the providers who did the heavy lifting on access were often the ones who could afford the least per head in student financial support.
Over the years though, direct student financial support fell somewhat out of fashion.
Research found that bursaries weren’t impacting applications – well no, because information on what was on offer was so hard to find. Another OFFA project found no real link between retention and bursaries between 2006 and 2011 – and then everyone ran the lines on that graph into this decade.
Relentless pressure to evaluate and look for impact – pressure that continues to this day – saw providers worry less about the student experience “buffer” and more about their raw entry, continuation and completion rates.
And maybe it mattered a bit less in the middle of the last decade. Inflation was stubbornly low. And when George Osborne scrapped grants, he increased the value of the maintenance loan substantially.
It’s also long been the case that students studying at home – who make up a big proportion of those WP entrants – have had an accidentally more generous statutory maintenance entitlement than those away from home when considered through the optic of their respective costs.
Eventually provider-level reporting and transparency on access agreement student financial support disappeared as OfS’ obsession with outcomes allowed providers to double down on “what works” rather than virtue-signalling through expenditure.
But now we’re in a prolonged cost of living crisis.
Where are we now
The downside with where we’re at is that we now don’t know what’s being spent – and the more the government has been expecting universities to make up the shortfalls locally, the more we need to know.
And we absolutely need to know if universities have taken the opportunity of a different kind of regulation to hide a reduction in their expenditure on student financial support.
So to help us to understand what’s been going on, for the third year running we’ve managed to wheedle out of OfS some data under an FOI request.
Basically, ever since the OFFA days HESA has been collecting data on the amounts of student financial support, and the number of students that helps, for each university in England – and here we have that data over the past few years.
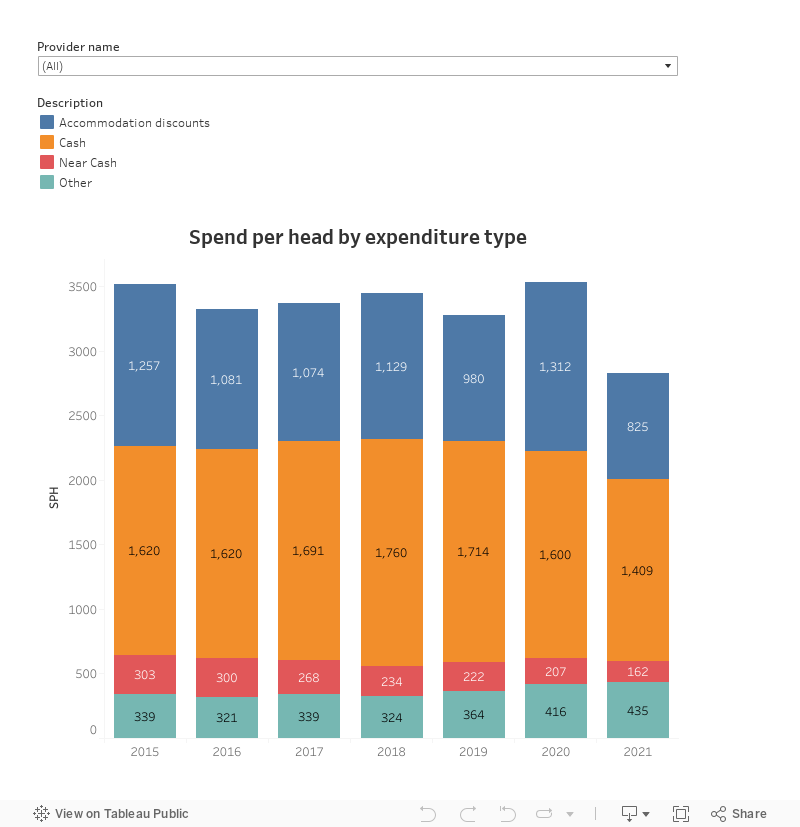
It covers four different types of spend on student financial support:
- Cash: This covers any bursary/scholarship/award that is paid to students, where there is no restriction on the use of the award
- Near cash: This includes any voucher schemes or prepaid cards awarded to students where there are defined outlets or services for which the voucher/card can be used
- Accommodation discounts: This includes discounted accommodation in university halls / residences
- Other: This includes all in-kind or cash support that is not included in the above categories and includes, but is not limited to, travel costs, laboratory costs, printer credits, equipment paid for, subsidised field trips and subsidised meal costs
We’re not 100 per cent convinced about the data quality, this doesn’t tell us how much money is going to disadvantaged students, it doesn’t tell us about need, and it only covers home domiciled undergraduates (and below, in terms of level of study). But it is, nevertheless, fascinating. You can see the numbers for each provider in England here:
Have you won the postcode lottery?
If we nationally just look at cash help, in 2022/23 just over £483m went to just under 331k students – a spend per head of £1,462 – almost the same as last year’s £1,415 per head.
But dive a little deeper and you find deepening disparities. In the Russell Group the £ per head was £2,319 – about £300 up on the previous year. Across MillionPlus providers that figure was £699 – down from £722 the year before.
Interestingly, per student helped, the Russell Group spent the same in cash help per student as it in 2019. Maybe inflation doesn’t apply in elite universities, or maybe they’re getting worse at recruiting those on low incomes. Meanwhile back in 2019, the cash spend per student helped across MillionPlus universities has almost halved – from £1309 in 2019/20 to £699 in 2022/23.
I’m not saying that any university is flush with cash – but what we see is almost certainly an artefact of redistributing fee income around a provider rather than around a country, and appears to result in manifest unfairness.
Some will point out that it might be better just to look at what’s been going on under the auspices of formal, declarable access and participation work. HESA finance data now includes a look at expenditure – but not the number of students that expenditure covers, nor the total amounts invested pre-pandemic, and nor the amounts allocated in premium funding, all of which would aid meaningful comparison.
The big squeeze
What this does all do is remind us that when ministers point students who need money at universities and say “ask them”, for whatever reason those universities are handing out less than ever in real terms – and the amount of help students will get appears to vary wildly between providers.
As long as institutional autonomy (coupled with vague expectations) trumps all other cards, we won’t really know whether any of the amounts – from an individual student award right up to the amount being spent by the sector nationally – are too much, or too little.
And if the only way to measure that is the number of students that drop out rather than the number that have an utterly miserable time and an impossibly thin, do-only-what-you-absolutely-have-to-survive student experience, the sector really is in danger of missing what matters and determining “what works”.


