UCAS Data: 2013 Cycle
UCAS have now published their mid-December data on the 2013 cycle, and the press coverage has been mainly downbeat, perhaps because UCAS has not tried the faintly ludicrous ‘late surge’ spin that they put on the equivalent data last year. But there are several reasons why we need to be cautious about drawing hasty conclusions from the data released so far.
This article is more than 10 years old
Data|
Mark is founder and Editor in Chief of Wonkhe
UCAS have now published their mid-December data on the 2013 cycle, and the press coverage has been mainly downbeat, perhaps because UCAS has not tried the faintly ludicrous ‘late surge’ spin that they put on the equivalent data last year.
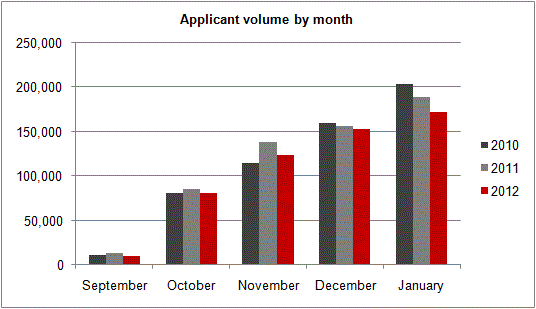
We need to place caveats on these data. The UCAS deadline is 15 January for almost all courses. There is no particular benefit in applying long before that deadline and the typical year would see more applications received in January than in any preceding month.
Source: UCAS
It follows from this that you can see quite large swings in the data between December and January, and these don’t necessarily signify anything very much. In this context the 5.6% year-on-year fall in total applicants as at 17 December is not, to my mind, very big news. Certainly the year-on-year drop in applications my institution had in mid-December has been reversed over Christmas. We are now running ahead year-on-year but I don’t get excited: we may be behind again by the time January 15th comes.
The other reason that we shouldn’t draw hasty conclusions from these data is that raw shortages of applicants were never the issue in the 2012 cycle. The UCAS end-of-cycle report showed that there were 653,600 applicants and 464,900 acceptances. Whilst a few of those 190,000-odd unplaced applicants may have been unable to meet the entrance criteria of any institution anywhere, most of them could have secured places if they wished to. There have always been significant numbers of applicants who choose not to engage with Clearing, or withdraw from the process at some stage, but in 2012 this behaviour was particularly pronounced.
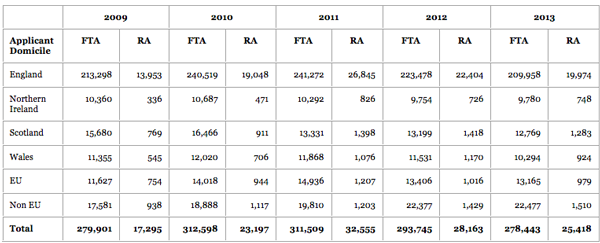
It’s interesting, therefore, that re-appliers are actually down year-on-year even more than first-time applicants:
Total applicants for all courses (2009-2013) by domicile of applicant and by first time applicant (FTA) or re-applier (RA)
Source: UCAS
Given the very strong rising trend in re-applications before 2012, the clear reasons why many applicants (anyone with ABB at A-level for a start) might have chosen to re-apply in 2013 rather than engage with Clearing 2012, and the relatively poor engagement actually seen in Clearing 2012, we might have hoped for a bounce in re-applications in 2013. The data show nothing of the kind. This factor alone accounts for over a third of the overall shortfall in 2013 applicants, year-on-year.
Another reason to expect a bounce in the current year is the impact of deferred entry. As you may remember, about 14,000 fewer applicants deferred their entry into the 2012 year than did so the year before. Put another way, about 9,000 more students deferred entry out of 2012 than into it. What we can’t yet know, of course, is how many applicants are going to defer their entry this current cycle.
It is pushing these early data too far to say that we have positive evidence of further falls in demand, but whilst we had good reason to expect a bounce, we have not yet seen evidence of one. We should know more soon.
This post originally appeared at HE Planning Blog
Related articles

Can a dashboard solve higher education planning?
David Kernohan | Data | 16/09/26

Everything you ever wanted to know about TRAC
David Kernohan | Data | 18/08/26

A bumper crop of higher education entrants, but is university becoming less popular among the better off?
David Kernohan | Data | 13/08/26

The NSS shows us that students still seem to like higher education
David Kernohan | Data | 9/07/26

What can GCSE performance tell us about salaries aged 27?
David Kernohan | Data | 25/06/26

Graduate Outcomes, 2023–24
David Kernohan | Data | 5/06/26