


It’s probably a mistake to subject desperate election promises to detailed scrutiny.
Last week’s Conservative pledge to boost apprenticeships with funding realised from the annual promise to clamp down on “rip-off degrees” barely moved the needle during a busy week of campaigning.
It’s fair to predict it may dissolve before we get the manifesto – long before any serious implementation thinking begins.
But a combination of the existing B3 metrics (continuation, completion, and progression) and “earnings potential” (I suspect the forthcoming Longitudinal Education Outcomes – LEO – variant) is the latest proposed way to identify those poor quality courses, and we can do that after a fashion with existing data for full-time, first degree students.
My analysis this morning demonstrates just how devastating this could be for the sector. There are large, well known, providers that could see more than 70 per cent of undergraduate places lost. Losses would be concentrated in providers that do most to contribute to the skills base in their local area. These are the very providers most likely to be involved in supporting the delivery of degree apprenticeships.
Significant teaching capacity would be cut in health and social care, social policy, psychology, media and communications, applied sciences, business, and the arts. The broad brush approach to “courses” would mean that a great deal of excellent provision would be lost.
Caveat central
“After a fashion” does a lot of lifting here. My primary finding in trying to make this happen is that the data is not, and likely never will be up to the job.
To start with, though various poorly briefed ministers attempted to suggest that we are indeed talking about “courses” (in the sense of a thing you can apply to, like “BSc (Hons) Data Design”) you can only really do this kind of data analysis at subject area level. Both the Office for Students and the Department for Education published data at CAH level 2, which would lump our BSc above into “computing” for the most part.
It does that for a sensible reason – when you get into course level data the numbers of students involved become so low that any statistical analysis becomes meaningless. We lump courses together into subjects as a proxy for understanding courses through data – the only way to know for sure what a course is like is to talk to the students and staff involved.
Even with subject area level data, there are some subject areas within providers where the numbers of students are too small to be published. This makes any analysis incomplete even if you have up to the minute data – we are working with lagging indicators (you can’t know how many students complete the course until the course is complete, you can’t know where a graduate ends up five years after graduation until five years after they graduate…) and course and subjects will wax and wane during that period. Providers may choose to start provision in a new area, or end provision in an old one, at any moment – not least for reasons to do with the quality and value of what is being taught.
Then we need to think about changes in the wider world. Quite a lot of newish graduates may have earned rather little during the (latest) 2020-21 tax year. Many may have been on furlough (at 80 per cent of their nominal salary), others may not have been able to find a job at all during a huge pandemic driven downturn in economic activity. Others may have drifted away from study during a very confusing and scary time for all of us. Not even Rishi Sunak could blame these factors entirely on providers.
Numeric thresholds
The Conservative press release suggests a 13 per cent cut in the student population, the precise parameters of the courses involved “will be a matter for the independent regulator” – though the heavy hints are that this should be done based on B3 and salary.
The way OfS has worked with B3 thus far is to set a “numeric threshold” – an arbitrary line in the sand below which provision is deemed problematic on one of three scales. For full time first degree students this currently works out in a way that puts you in nominal trouble if:
- Less than 80 per cent of students continue on their course
- Less than 75 per cent of students complete their course
- Less than 60 per cent of students progress to a graduate job or further study
If you decided to simplify this with a compound metric (add continuation, completion, and progression rates and divide by three), the relevant numeric threshold would be a little under 72 per cent. I know that this is dumb, but bear with me.
We can apply a similar approach to LEO salary data – in this instance it might make sense to set a numeric threshold at the median annual income for all workers between 22 and 29 (five years after graduation would make most graduates 26 years old, so this feels fair) . For the 2020-21 tax year (the latest LEO that is available), this was £23,525.
Applying our threshold to the B3 compound metric and the LEO median earnings to currently available data shows that courses involving 0.76 per cent of full time undergraduate students fail to meet both B3 and salary thresholds. A further 3.26 per cent are on courses that meet the salary bar but not the B3 bar, with an additional 8.8 per cent on courses above the B3 threshold and not the salary one.
Clearly these thresholds aren’t going to cut the mustard.
Raising the bar
To get to around 13 per cent we need to raise the annual earnings threshold to £26,400, and the compound B3 bar to 79.8 per cent.
This is based on trying to raise both to a similar extent – there would be other ways to do this if you favoured increasing one over the other, and the tool I’ve built allows you to try this in various permutations. This puts 13.17 per cent of the student population (around 78,000 students) on courses under both thresholds. To be clear this is a huge increase in both thresholds – far above the standards that currently exist.
Here’s what that looks like:
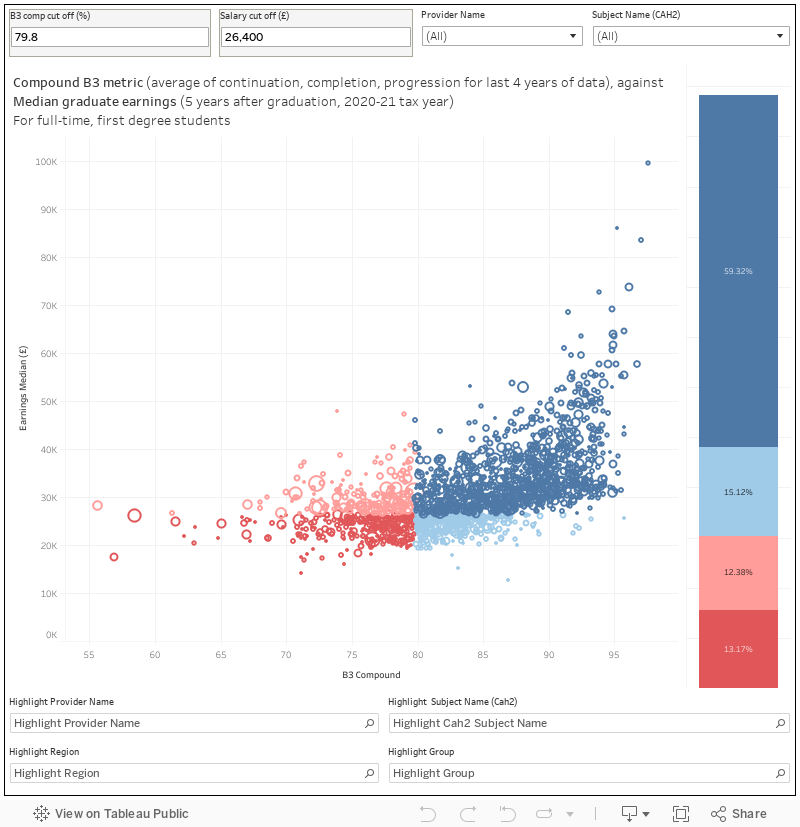
This is a complex set of calculations, so apologies that the chart reacts slowly to filter and parameter changes. At the top of the chart you can enter new values into the grey boxes for B3 (increments of 0.1 percentage point) and earnings (increments of £100). The two filters allow you to see impacts on a particular provider or subject area. The main chart area shows subject areas within providers (“courses”) on earnings median (LEO, five years after graduation, 2020-21 tax year) and compound B3 (completion, continuation, progression for the latest available multi year period, divided by three) axes. On B3 I’ve used the “taught or registered” population.
I’ve used colours to mark the boundaries. Courses coloured red are below both thresholds, those coloured pink are below the B3 threshold but not the salary threshold, the pale blue are below the salary threshold but not the B3 threshold, while dark blue are above both. The size of the dots denotes an approximation of the number of students who might be on each course (this is done via the B3 data denominators, so should be seen as indicative only).
The bar on the right shows the proportion of student places in each of the four groups of courses. But default this shows the whole sector, but using the filters at the top allows you to look by either provider or subject area.
Right at the bottom of the dashboards you can highlight by provider, subject, mission group (my usual expanded set), and region within England. The highlighters work much faster than the filters, so are better suited for browsing many permutations at speed.
I have only included courses where the four required pieces of data (continuation, completion, progression, earnings 5 years after graduation) were available. This means that many smaller areas are omitted entirely, and this will clearly have an impact on which courses are in which group and the overall proportions.
Unpicking the mess
What shines through is that this is not a sensible policy for a country with aspirations of global leadership in productivity and innovation. A cut in higher education places, even if partially covered by a rise in degree apprenticeships (a largely unproven model of higher study that has thus far been taken by people already in well-paid employment) makes no sense while international competitors are making pains to grow their sector, and the base from which research and development can emerge.
But even if it did make any kind of sense, the data simply isn’t there to make these kinds of decisions with any sort of confidence. Drawing arbitrary thresholds using large and diverse blobs of superannuated student data is more akin to demolition than surgery. Even if there are “poor quality courses” that providers are comfortable delivering year on year with the blessing of students and professional bodies, removing them would take out a great deal of world class provision.
It is not enough to know that the party that proposed these plans is (as the polls currently stand) from a government that can implement them. Ideas like this are an outgrowth of the way that quality assurance has shifted from understanding teaching to seeing well-to-do graduates secure better jobs than their less advantaged peers as an indicator of excellence. Future governments would do well to look at nonsense like this and take decisive steps to ensure that painful decisions, where they need to be made, are supported by better information and a greater, and more human, understanding.
This is fantastic analysis – really useful!
I like “more akin to demolition than surgery”. Thank you for the analysis.