Student engagement has bounced back. Or has it?
4 in 10 students caring for others ought to prompt policy action – but is it true? Jim Dickinson searches for satisfaction in a survey on student engagement.
This article is more than 3 years old
Comment|

Jim Dickinson
Jim is an Associate Editor (SUs) at Wonkhe
Good news! Apparently, students are now engaging with their undergraduate courses as much as they did prior to the pandemic.
I know it might not feel like that but look - numbers never lie!
Students also reported interacting with staff more often during 2022 than during any year since 2018, 47 per cent of students said they had worked with fellow students “often” or “very often” - only 36 per cent said that in 2021 - and fewer students considered leaving university than during the previous three years.
That said, more have a part time job, and 37 per cent of students were managing caring responsibilities alongside their studies last year.
Hold on. Really?
When you have a piece of polling out in the field, I was always taught to be prepared to be surprised when the results come in.
So on one level, when Advance HE’s press notice came in for the national round up of the results from the UK Engagement Survey, I was disappointed to not be surprised that more students are working term time and more are caring for others - those are, after all, findings that I keep hearing from small(er) scale studies being carried out by SUs and others.
But 37 per cent? Up from 18 per cent in 2015? That’s the kind of number that causes you to raise questions before you jump on the socials or tap out your blog. What kind of caring responsibilities were defined in the questions? How much caring are they doing? And when Advance HE says “students”, who does it mean - and did it mean the same thing back in 2015?
Supposed to fire my imagination
Measuring “satisfaction” has all sorts of drawbacks - some of of which are discussed in our Editor Debbie McVitty’s piece on the site - and so many have argued that it’s better to try to find out what the experience is really like. You know the sort of thing - what students do with their time, and what they have been encouraged to do, and so on.
The UK Engagement Survey is the closest we have to a national tool for that. Based on the National Survey of Student Engagement (NSSE) that is widely used in the US, it gives us an understanding of how students experience their courses, how engaged they feel by the teaching and how supported they are in their learning and development. It also looks at skills development - a group of questions ascertain how much the overall student experience has contributed to the development of 12 specified skills.
Since it was first piloted by Advance HE’s predecessor organisation back in 2013, as well as providing rich insights locally, it has indicated interesting things nationally - back in 2016, for example, a statistically significant relationship was found between high levels of accredited professional development and strong UKES scores on how students interact with staff and reflect on their learning.
So when you discover that almost 4 in 10 students are now caring for others alongside their study, you sit up and notice.
How white my shirts can be
I’m assuming (although I don’t know) that the question is as it was in 2015 - asking students to indicate how many hours they spent undertaking different activities across seven categories - this finding being the aggregate of those that said anything other than zero. And for the avoidance of doubt, we’re talking (all years) undergraduates here.
In the 2015 data, it was indeed the case that only 18 per cent spent any time “caring”, along with 59 per cent participating in extra-curricular or co-curricular activities, 43 per cent working for pay (59 per cent now), 26 per cent doing volunteer work and 82 per cent saying they spent more than 0 hours commuting to campus.
But the 2015 data wasn’t weighted - and 70 per cent of the sample were 21 and under, 96 per cent were full time, 87.2 per cent were UK domiciled and 63 per cent female. That not necessarily being representative of students at large might prevent you from drawing national conclusions - but the bigger question when you’re making claims about changes over time is if the sample is comparable.
The first red flag is that we’ve gone from 24 participating institutions to 16; from 24,387 respondents to 10,915 and therefore from an average of 1016 respondents per provider to 682. Then a glance at the age profile of respondents raises your next red flag - in 2022 the proportion of those aged 22 or over was 50 per cent, versus 30 per cent in 2015.
Even if you ignore (at your peril) all the other differences - by ethnicity, gender, institution type, subject area and so on – and you assume that those that are 22 and over are more likely to have caring responsibilities and more likely to work for pay, once you reweight those appropriately you’re much of the way towards the 2022 figures already.
He's telling me more and more
Suddenly, not only do you end up deeply mistrustful of the headline finding, but you end up mistrustful of the resultant narrative too. It may well be that:
...more students than ever are balancing caring responsibilities and paid work with their courses – something which is likely to reflect the current economic and health situation. The need for work that institutions have initiated to support mental health and mitigate the cost of living crisis remains clear”
…but we are some distance from being able to rely on the finding that generates the need for the work.
The reality is that some groups of students are more likely to respond to a survey than others, and some types of provider are more likely to participate than others.
As student and provider participation has dropped over the years it has become harder to reconcile this with student characteristics at a sector level.
And so for this reason we can be sure that results are accurate for those participating, and we can suggest that they may be indicative of wider sector trends, but we cannot draw firm conclusions on aggregate as we can with something like NSS.
What we could do is some cross-tabulation, identifying if particular things (like say part-time work or caring responsibilities or other aspects of the survey) are markedly different for different student characteristics.
We could also look at the relationship between different types of engagement - does taking part in volunteering impact time spent on studies, and so on.
But the accompanying report is noticeably light on that kind of material, the cross-tabs are not available at the time of writing, and instead a whole host of time-series assertions are accompanied by speculation as to why things have changed when what’s changed may well be the sample rather than the engagement.
Supposed to fire my imagination
It’s not all pointless. Students from social science and arts subjects reported greater engagement with staff than students who were studying STEM (science, technology, engineering, and mathematics) subjects - with a 17 percentage point difference between the subject with the highest engagement (business and management) and the subjects with the lowest engagement (engineering and technology and psychology) unlikely to be explainable by the particular mix of providers taking part.
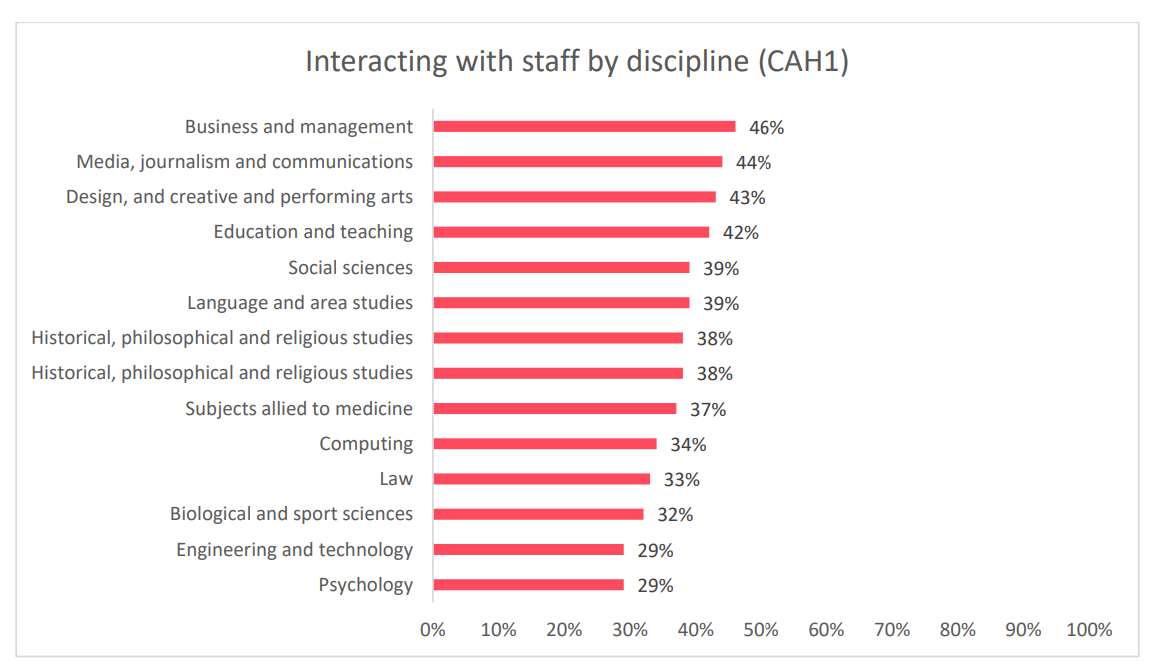
And given that there’s a headline finding of “less than 50 per cent of students across all subjects reported frequently interacting with staff members”, Advance HE is probably right to say that “further opportunities for students and staff to interact with one another could be explored.”
All the discussion on “learning with other students” is time series stuff, but “engagement by mode of delivery” is interesting. The numbers suggest that students who were mostly taught online reported lower levels of engagement in critical thinking than students who were mostly taught in person or using a blend of the two approaches.
They also suggest that students who were taught using a blended approach reported greater engagement with research and inquiry activities than students who were mainly taught in person or virtually.
They’re findings that I’d like to see controlled for at least by subject - but at least generate hypotheses for further investigation.
Stuff on skills development and careers also suffers from “here’s what’s changed since 2019” speculation, but when just 50 per cent of students overall feel their student experience contributed to their career skill development, even if the sample is a bit off you’d want there to be some national action to address it - even if that wasn’t necessarily “employability skills development directly incorporated into courses could be further explored”, as suggested in the report.
And it is indeed “surprising” that there were much higher levels of engagement in students developing their career skills when they were taught online in comparison to being taught in person or using a blended approach.
But I suspect that “virtual delivery may allow students extra time to concentrate on strengthening their CV and direct career credentials” is a stretch - and just makes me yearn for a proper set of qualitative findings to accompany the numbers rather than jumping straight to conclusions (and, potentially, misjudged or poorly targeted actions).
About some useless information
When we get to the section on extra-curriculars, we don’t get any of the cross tab stuff that we’ve seen in previous years - back in 2015 for example we discovered juicy stuff like the differences in levels of positivity for skills development items, by whether or not students participate in co-curricular and extra-curricular activities.
Bu, taking us back to the start, we do get the actual numbers for time spent completing extra-curricular activities by age of student - and guess what. It’s 46 per cent (21 and under) versus 71 per cent (22 and over) on working for pay; and on “caring”, it’s 16 per cent versus 56 per cent.
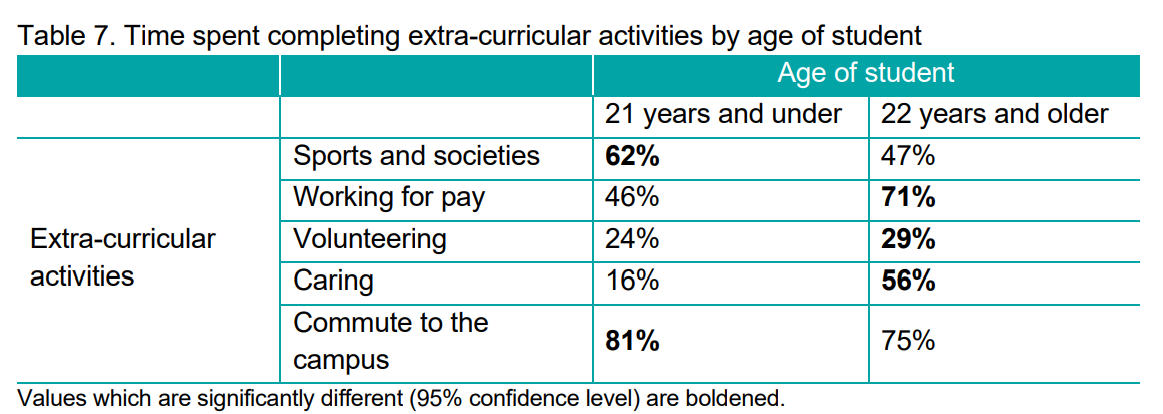
So it’s probably right that “courses could be made more accessible by ensuring lectures are recorded and available online for students to catch up”, and it’s also likely right that “last minute timetable changes should be avoided to reduce disengagement from the course.” But comparing overall caring and working to previous years? Not so much.
In many ways, while the headlines for this group are interesting - and there really is missed opportunity on characteristics and cross-tab analysis here - what this ought to remind us of is the limitations of a numbers and metrics driven approach.
Even if the report had controlled for characteristics and subject, or at least allowed me to - if I worked in a university I’d still be wanting to understand more about why the numbers were the way they were so that I didn’t do the wrong thing with the ever more limited budget and staff patience available to me.
It remains the case that over in the NSS, we have donkey’s years of detailed data on the volume of students that find their assessment to be unfair, and yet still we tend towards surface level speculation on why that is and what, therefore, might be done about it.
It turns out that whether we’re talking about satisfaction or engagement, surveys don’t automatically lead to understanding, data can’t replace student representation, and student voice is more essential than ever in explaining the deluge of numbers that we find ourselves under.