Higher education data nerds (myself arguably included) get a nice Christmas present today with the publication of UCAS’s End of Cycle Report for 2016. There are far too many findings in the 140+ page report to cover in full, so I’ve tried to pick out what I think might be some of the most interesting developments.
As ever, UCAS’s reporting has on admissions has significant implications for universities seeking to stay financially afloat in the competitive higher education market, and of course for those seeking to make higher education access fairer and more equitable. There will be further findings of interest to come early next year when UCAS releases further breakdowns of the data by institution and equality characteristics on January 26th (save the date).
UCAS has also introduced a few useful innovations this year that can deepen the sector’s understanding of the data. As well as introducing a new interactive data plotter to explore entry rates and trends through time, UCAS has also developed a new ‘multiple equality measure’. This new measure reclassifies applicants by their relative disadvantage in accessing higher education by combining multiple factors: socio-economic background, local area, sex, school type and ethnicity. The measure shows there is still significant progress to be made in equalising access to higher education, and that progress made in recent years looks like it is slowing.
1. The overall market is flatlining, and looks set to decline
The long-expected pop in the recruitment bubble of recent years looks like it might be beginning, with the kind of growth in overall acceptances that we have become used to in recent years coming to an abrupt end this year – a minuscule 0.4% growth.
However, this masks substantial variance in different subsections of the market and across the UK. Acceptances from England have indeed stopped growing, but in Northern Ireland, we see an increase of 5% and in Scotland of 3%.
There is also variance in age-groups and international domicile. Despite a decrease in the 18-year-old population, there was a 1.5% increase in acceptances from this group, while over 25s saw a 1.7% decrease. Recruitment from the EU is up 7%, but from elsewhere outside the UK acceptances are down 2.3%.
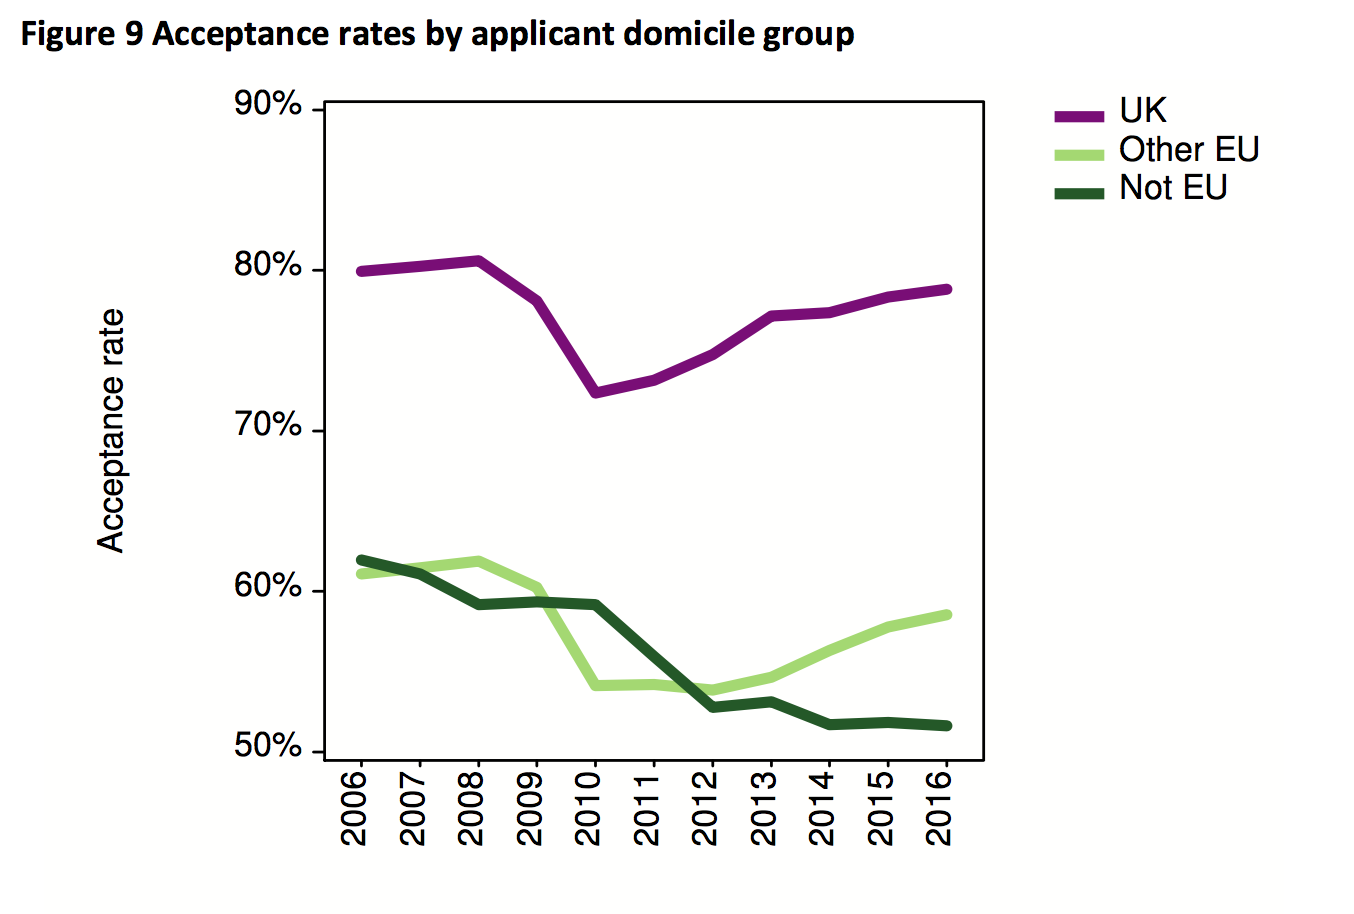
Overall this means that two of the most significant growth areas of the market this year – 18-year-olds and EU students – are areas which many believe will fall in the next few years. These current growth areas are currently masking poor-performance when it comes to mature and international recruitment – two areas where universities would no doubt like to grow, but where government policy increasingly appears to frustrate them in doing so.
The fall hasn’t come yet, but all signs suggest that we should brace for impact.
2. Trends in EU recruitment vary by country
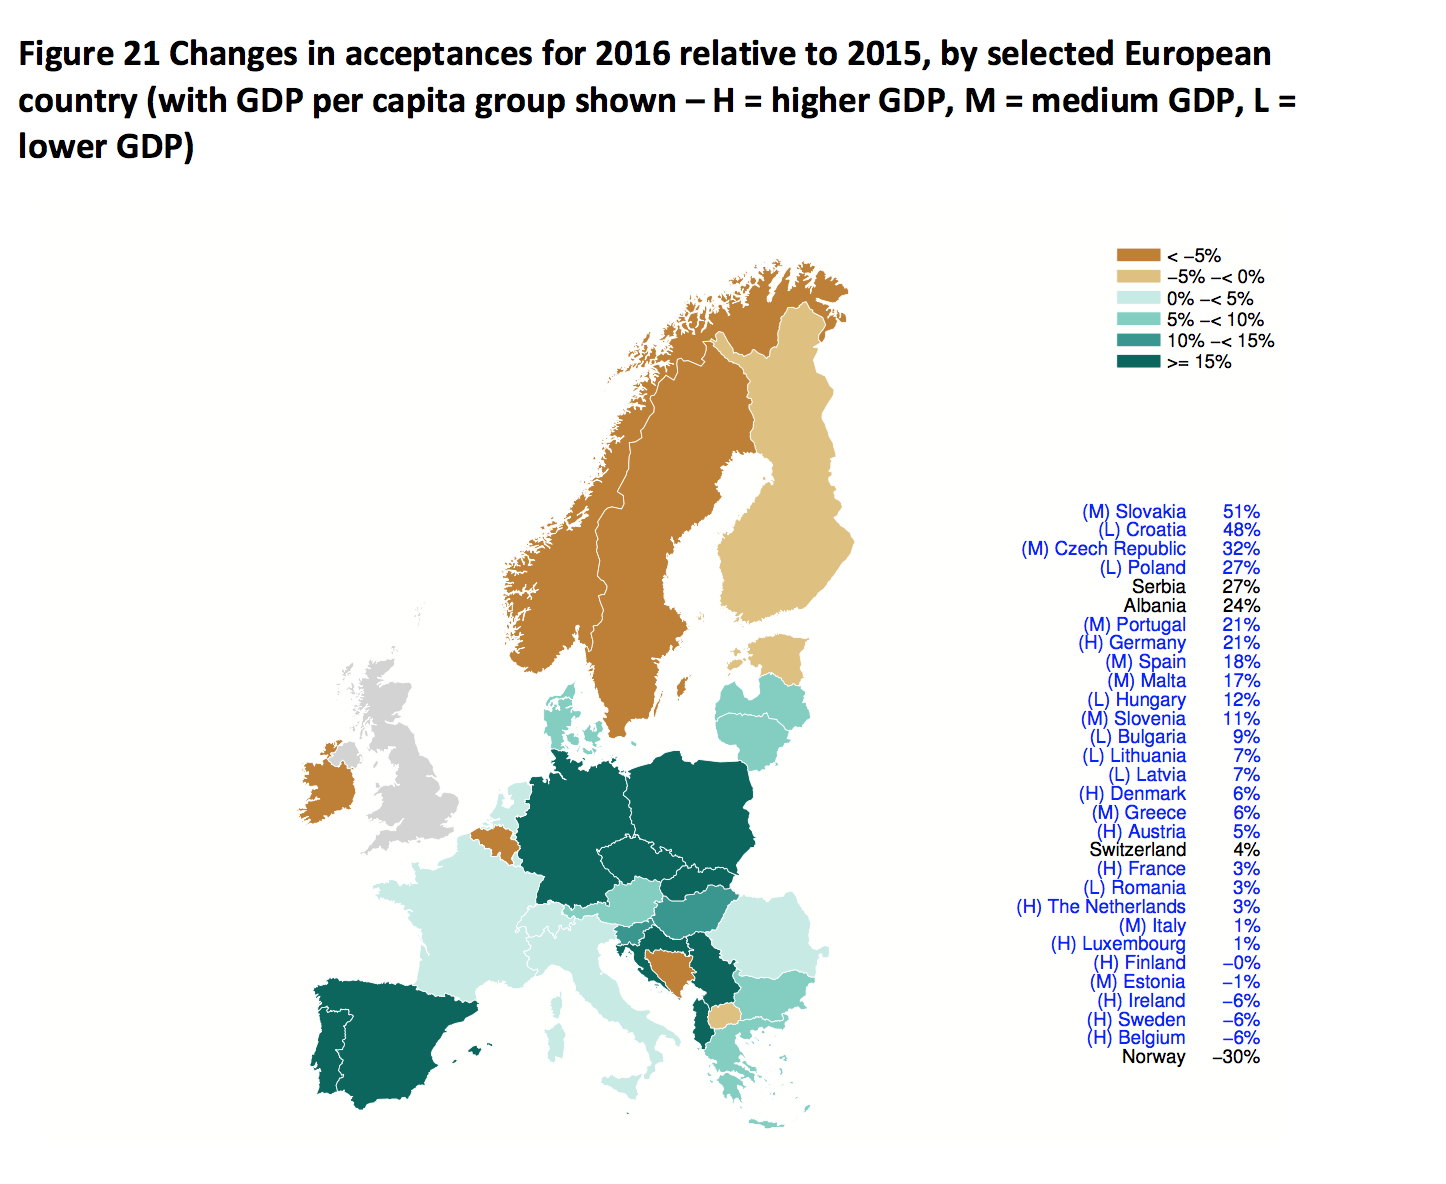
In what could be a last pre-Brexit hurrah, acceptances from the EU are up by 7% this year, following a trend from the past few cycles. UCAS has helpfully provided a breakdown of the changing trends by country, which shows substantial variance in trends within EU countries. Universities will have to be wise to these country-by-country variations as they aim to salvage what they can of EU recruitment in the likely post-Brexit crash.
UCAS’s map shows very large growth in recruitment from many former Eastern Bloc countries and Germany, and a decline in recruitment from Scandinavia, Ireland and Belgium. However, the largest absolute sources of EU recruitment remain France, Italy, Romania, Germany, and Spain.
3. Higher education participation and the Brexit vote
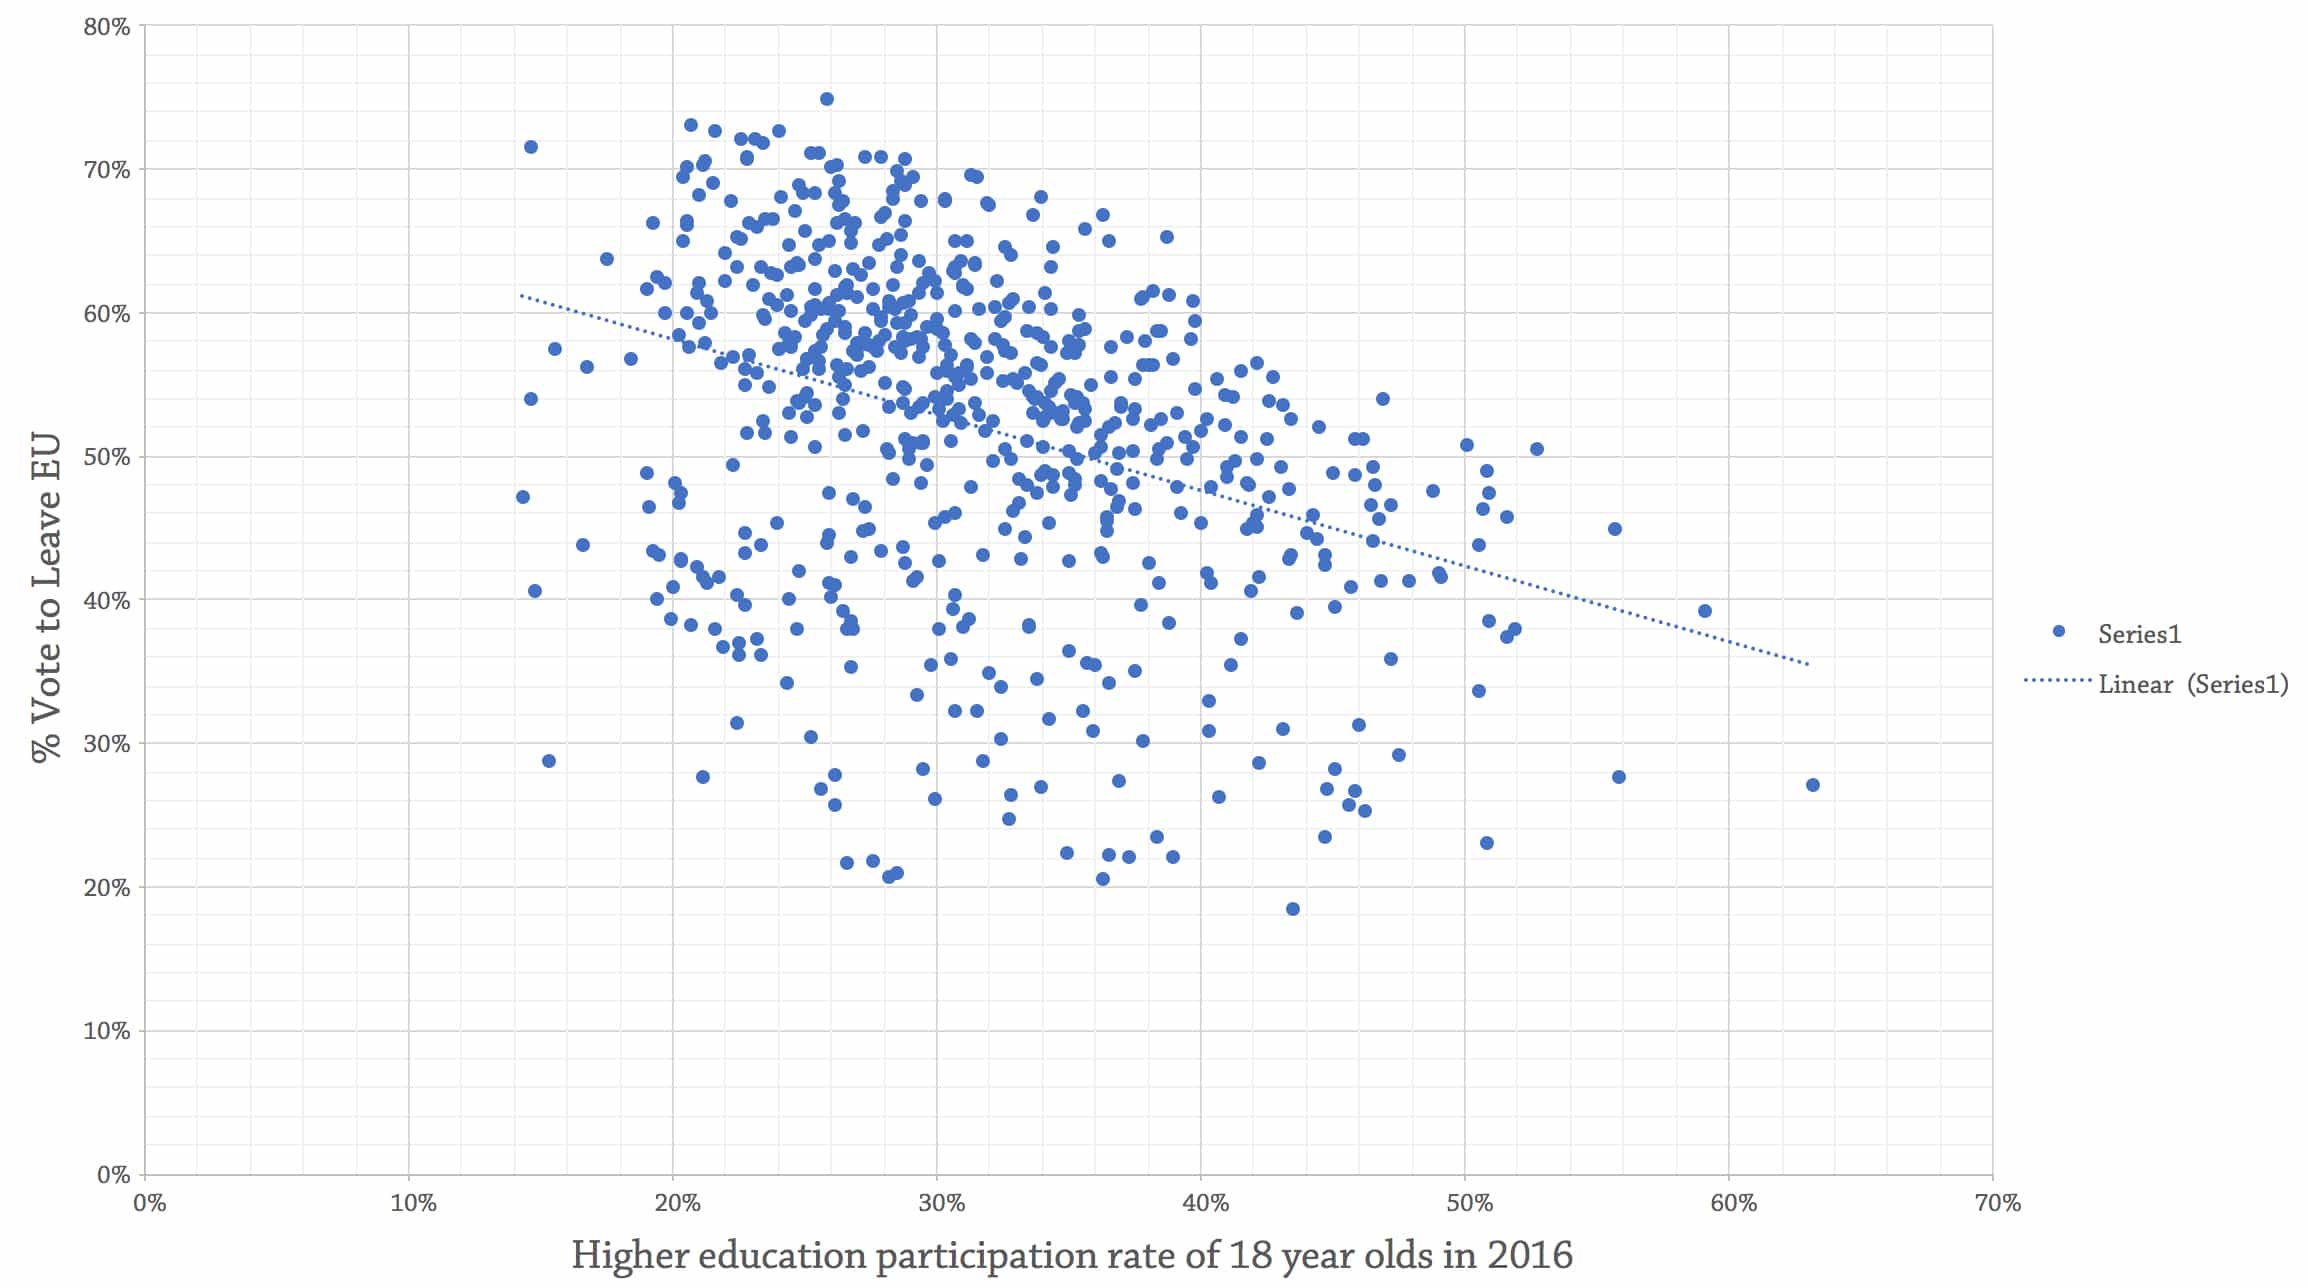
Using the excellent estimates provided by Dr Chris Hanretty of UEA, we can match UCAS’s helpful breakdown of participation of 18-year-olds in higher education by parliamentary constituency with estimates of the EU referendum results in each such constituency. Unfortunately, there are no available estimates for the referendum vote in Northern Irish constituencies, as the result was announced in one go by the whole province.
Hanretty’s estimates are partly based upon higher education participation as a variable that predicted voting patterns in the EU, and so there is a small degree of tautology to this analysis. Nonetheless, the results are enlightening and conclusive: there is a clear relationship between low higher education participation and the strength of the Brexit vote, confirming already known and well-trodden arguments on this subject.
Parliamentary constituencies by EU vote and 18-year-old HE participation in 2016
4. Progress in widening participation had little impact on the Brexit vote
Perhaps more enlightening, and worthy of further investigation, is the relationship between the change in higher education participation over the last ten years and the Brexit vote. Many areas that have seen some of the most dramatic increases in 18-year-old participation in higher education still had very high Leave votes.
Parliamentary constituencies by EU vote and change in 18-year-old HE participation 2006-2016
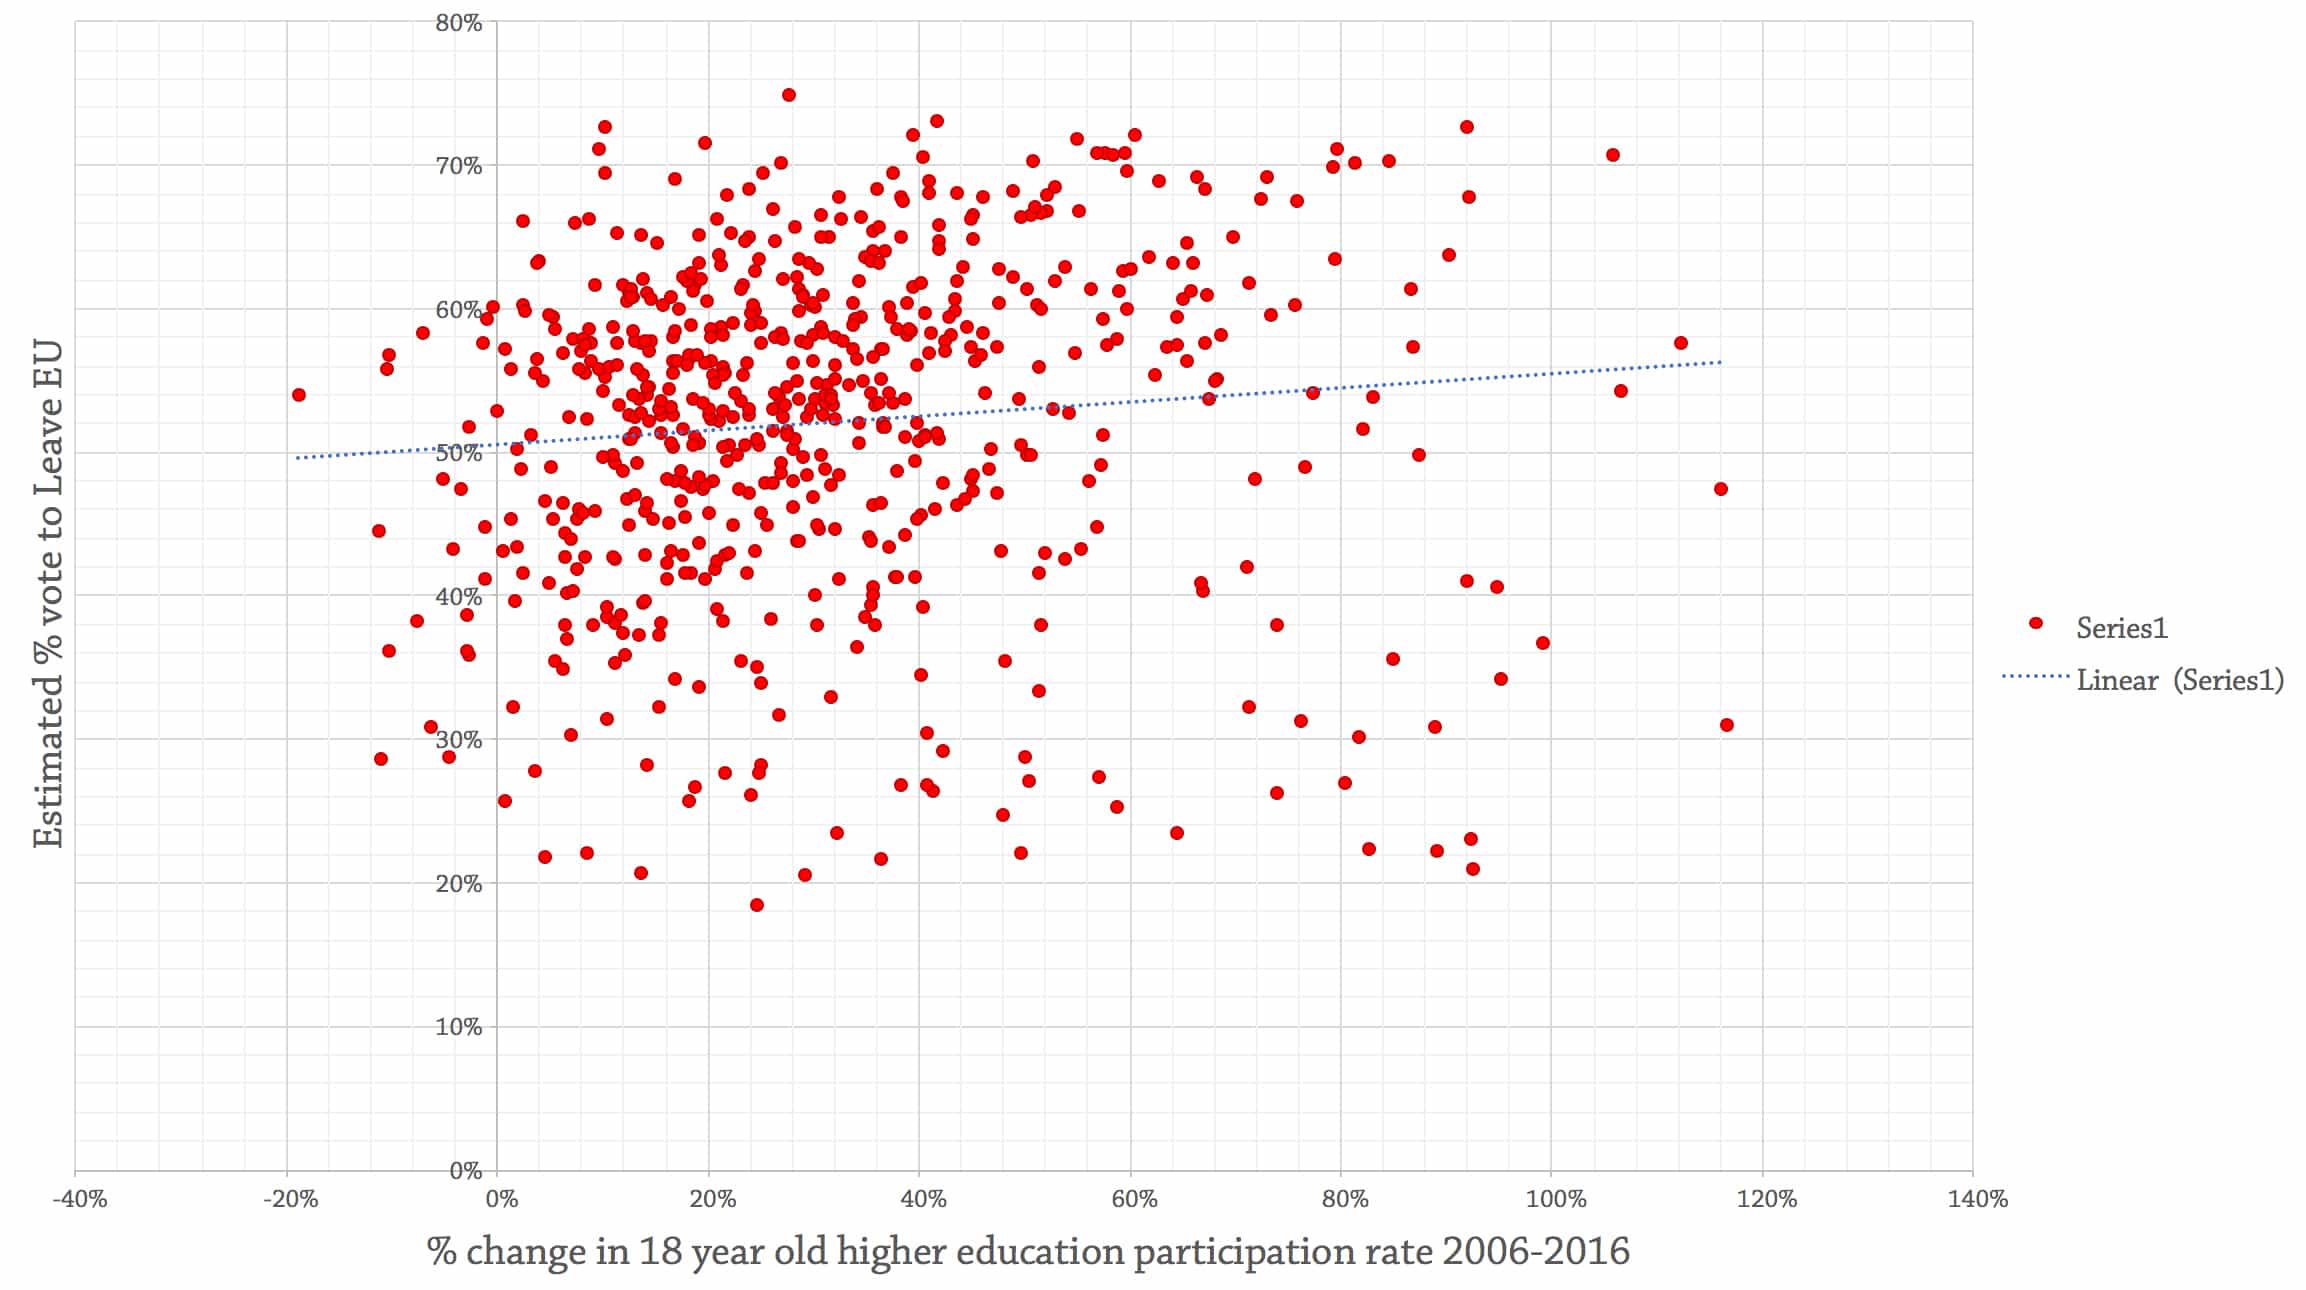
The former mining community of Wentworth and Dearne in South Yorkshire has seen its higher education participation rate roughly double in a decade to 28.8%, just below the English average (32.5%). Yet it still had a Leave vote of 70%. It’s a similar story in many other areas with a strong Leave vote, such as Blackpool South, Kingston-upon-Hull East, Sheffield Brightside and Hillsborough, Thurrock, and Grimsby, all of which have had substantial increases in higher education participation in the last ten years (though all remain below the English average).
One hypothesis for this trend may be that the increased numbers of young people accessing higher education in these areas are less likely to have returned home after graduation. It also demonstrates the limited impact of widening higher education participation on these areas themselves. Simply getting more young people from Wentworth and Dearne through the university door may not be tackling the long-term challenges to local economies and opportunities that many identify as a cause of the Brexit vote.
The data on changing participation rates also point towards the uneven spread of progress in widening access across the country. The constituencies that have seen the most dramatic growth in participation is an odd mix of affluent London areas with already high participation (Battersea, Hammersmith); poorer areas of large cities (Leeds Central, Poplar and Limehouse, Glasgow North East, Birmingham Hodge Hill, Manchester Central, Nottingham North); and isolated northern communities that voted for Brexit like those mentioned above.
There are also areas of the country where higher education participation has actually decreased. This too is a strange combination of areas: metropolitan anomalies with still very high participation (Finchley and Golders Green, London and Westminster, Sheffield Hallam, Edinburgh West), Celtic rural areas (Banff and Buchan, Preseli Pembrokeshire, Gordon, Brecon and Radnorshire, Berwickshire, Roxburgh and Selkirk, Angus), and poorer areas of Scotland (Paisley and Renfrewshire North, Dundee East).
5. Downward pressure has stopped at high tariff institutions
While the rapid increase in offer making over recent years has slowed, offer making is still at a record high once again. Students with ABB+ are 65% likely to get the full five offers, and a third of all applicants get five offers to chose from. It has never been easier for an individual student to get an offer from a university, and the challenge of converting offers into accepted places has never been harder or less predictable.
In recent years, the impulse to expand in competitive market has led to higher tariff providers dropping their entry requirements and accepting the subsequent trade-off in league tables which use tariff as a metric. This ‘downward pressure’ on the rest of the market – particularly on medium tariff institutions – appears to have gone as far as it can. Instead, the pressure is now being further applied by medium tariff institutions on lower tariff universities, with medium tariffs receiving more applications and lower tariffs receiving less.
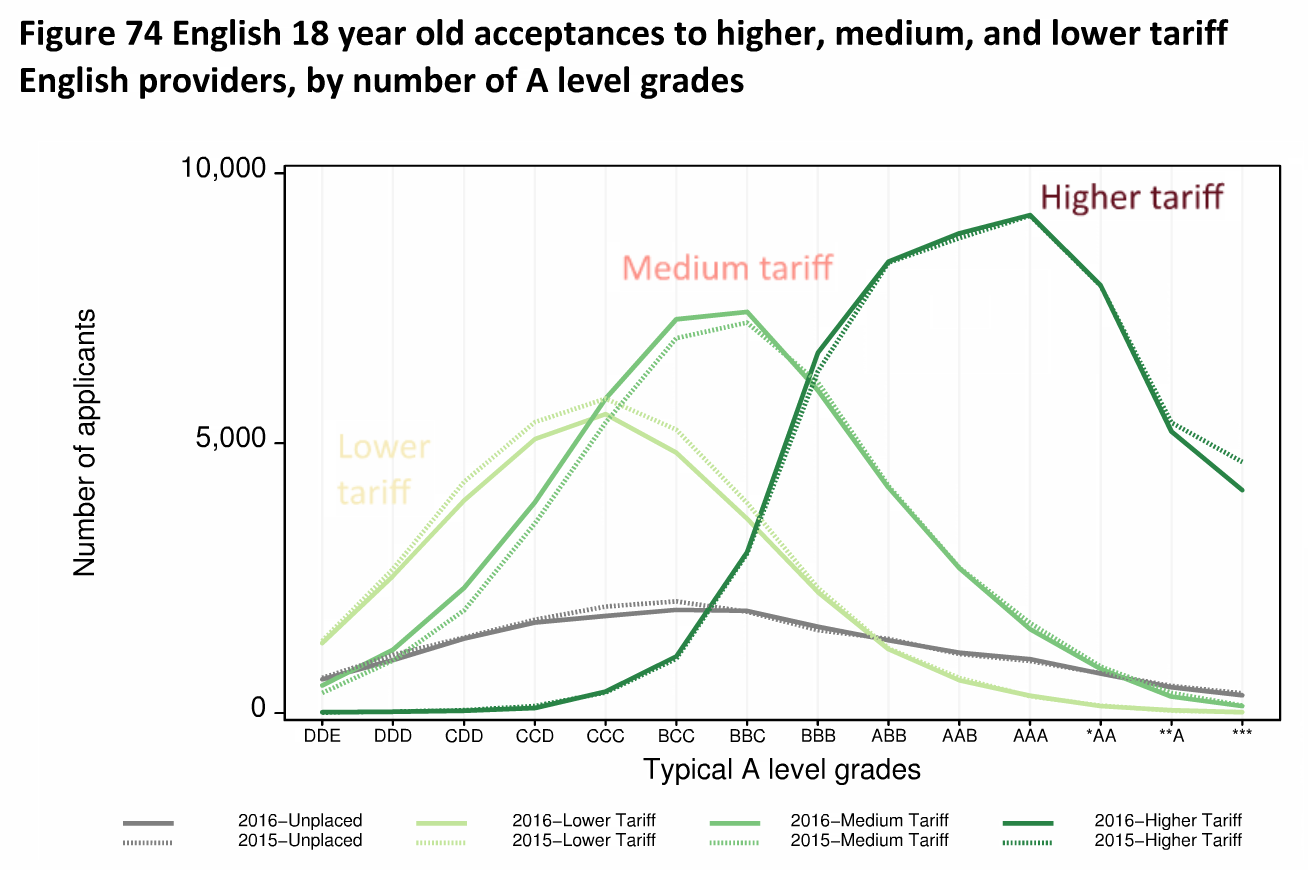
Lower tariff institutions’ acceptances are down 2.9% this year but are up for both medium tariff (3.2%) and higher tariff (2.8%) universities. If overall expansion of the market stalls (see above) then several lower tariff institutions could find themselves running out of room at the ‘bottom’ end.
6. Low tariff institutions are recruiting fewer of the poorest students
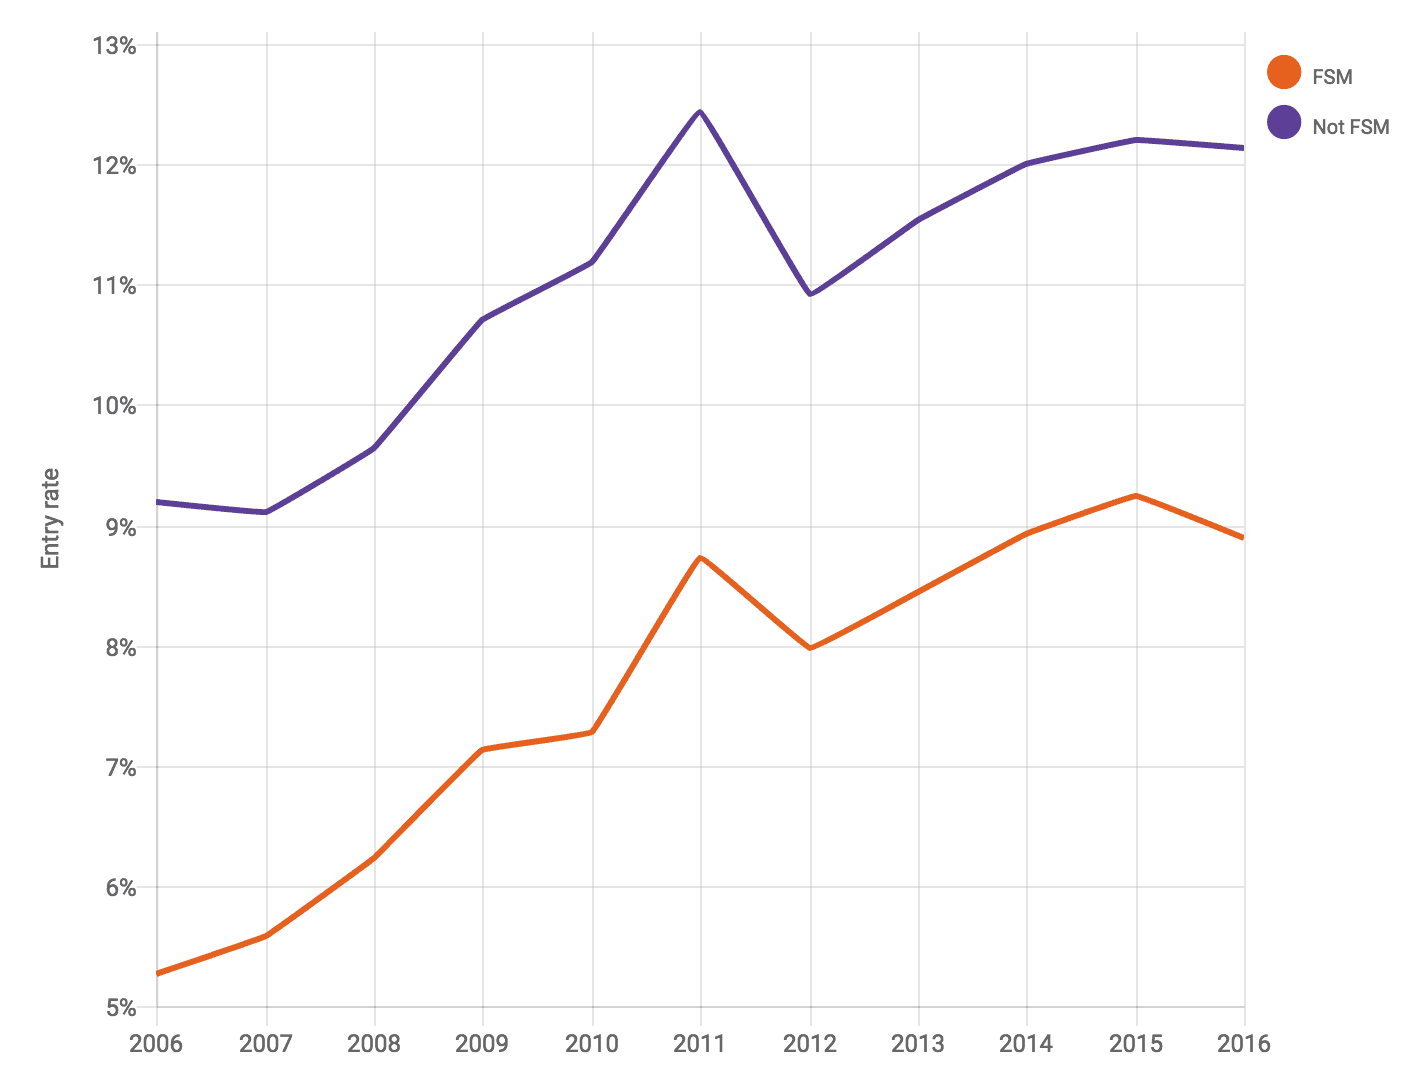
This squeeze on lower tariff providers could be having particularly worrying implications for widening participation and ensuring higher education access for the most disadvantaged groups. The entry rate for Free School Meal (FSM) applicants to lower tariff universities is actually down this year.
Entry rate to lower tariff higher education institutions of free school meal and non-free school meal applicants
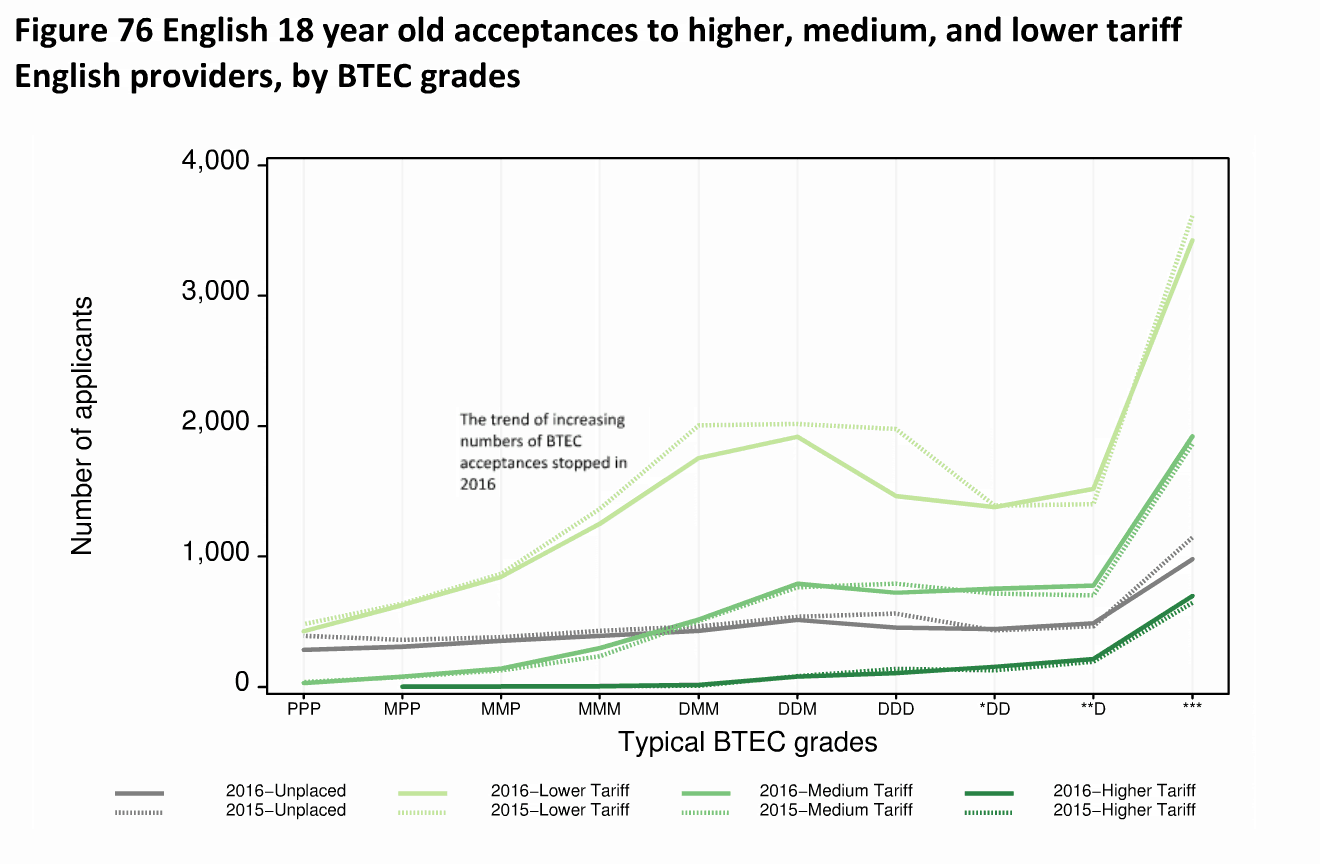
One possible explanation for this is the decline in acceptances of applicants whose main level 3 qualification is a BTEC. These students had been rising rapidly in number until last year, and may have been one hidden reason for the growing number of relatively disadvantaged students entering higher education, particularly and lower and medium tariff providers.
7. Progress in equalising access is slowing
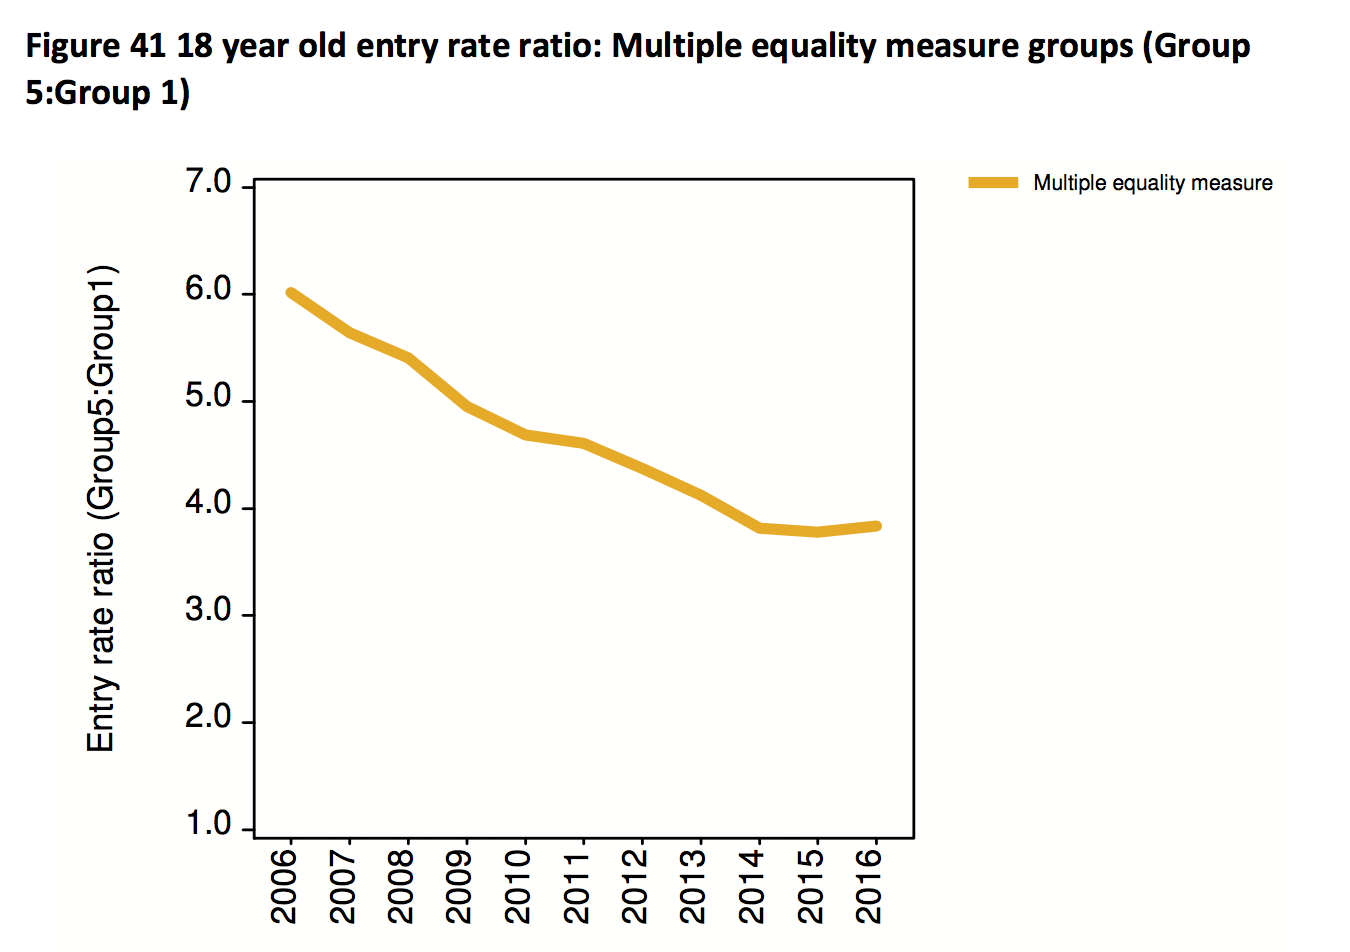
These trends also reflect a slowdown in the equalisation of access to higher education that had characterised the years between 2006 and 2014. UCAS’s new ‘multiple equality measure’ (MEM) groups will no doubt give widening participation teams plenty to chew over, especially now the entry rate ratio between the most likely to and the least likely to enter university has now flatlined for two cycles at 3.8. This is despite that ratio falling slightly at higher tariff institutions (from 11 to 10.7) and medium tariff institutions (from 3.6 to 3.5).
8 – Scottish institution are becoming less likely to offer places to Scottish applicants
Continuing a trend since 2014, Scottish applicants to Scottish universities are now significantly less likely to get an offer than English and Northern Irish applicants to Scottish universities. As the below graph shows, the offer rate by Scottish providers to Scottish applicants is close to the low point it reached in 2011.
Several explanations may abound for this, including the performance of Scottish schools and the funding pressures on Scottish universities, which receive more income for English students (who pay fees) than Scottish ones (who do not). There is also the significant caveat that a substantial proportion of higher education delivery in Scotland is at sub-degree level and taught in colleges, much of which is not covered by UCAS. Most importantly though is the cap on Scottish places required to manage the government’s continued subsidy of tuition – the declining offer rate would suggest that demand may be beginning to outstrip supply.
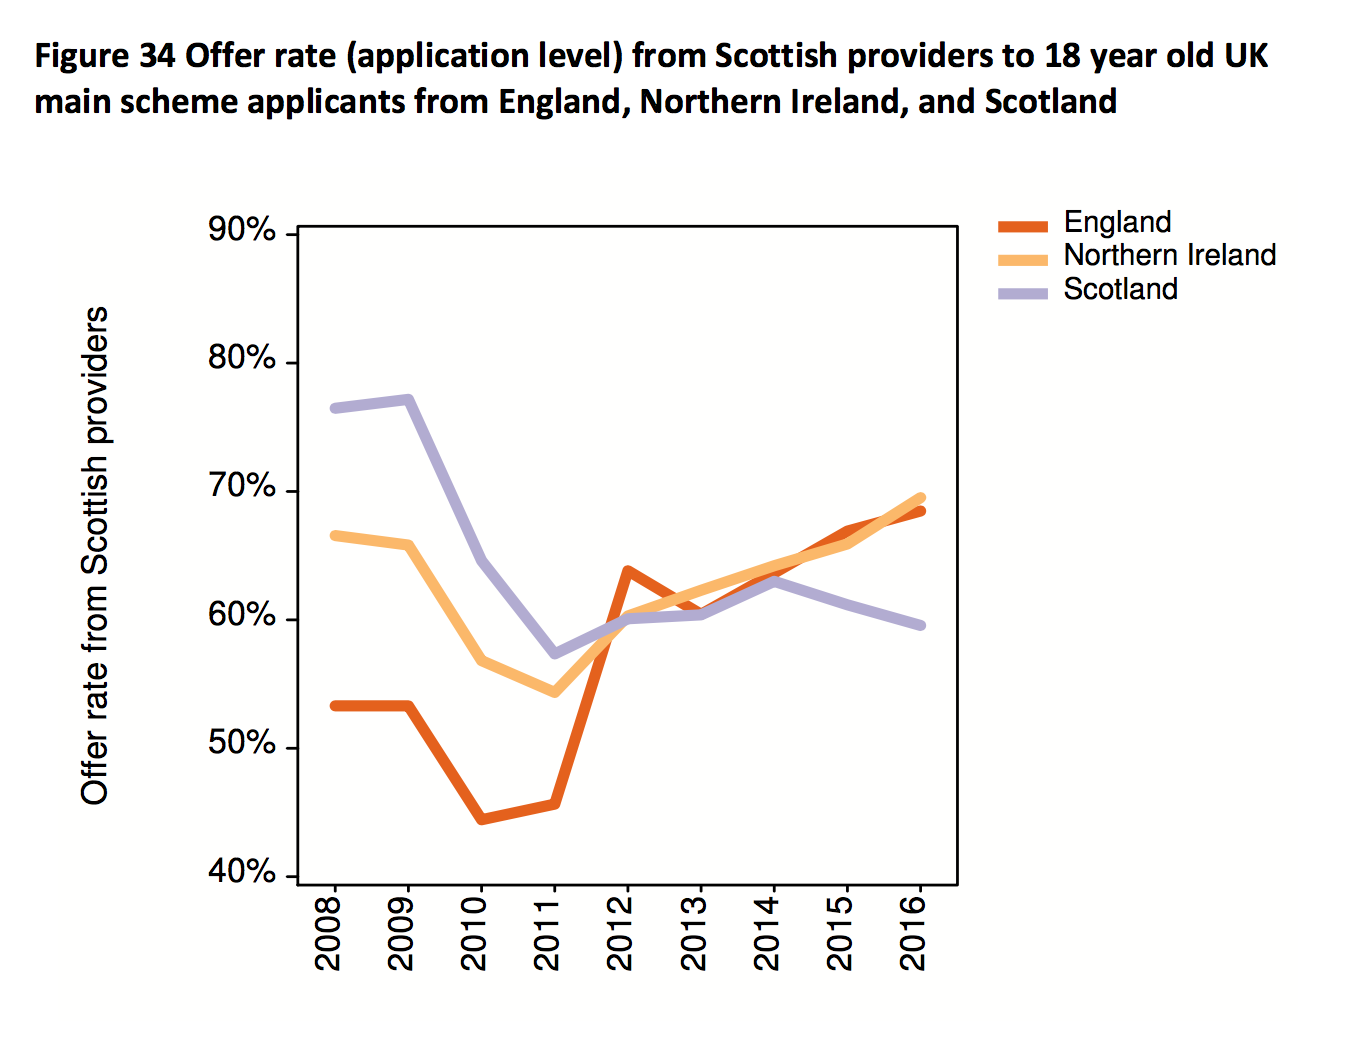
Nonetheless, the trend should worry that Scottish government and appears to run counter to its nationalist credentials. Education reform has been made a priority of the government but has become unstuck in plans for schools reform and is struggling to find the funds to extend student maintenance support.
Don’t panic
The flatlining of overall recruitment and progress in equalising access will no doubt give many universities some cause for concern, not least with rumours circulating the sector of deflated demand in the current (2017) admissions cycle. However, at least as far as the current cycle goes, it is too soon to tell whether demand is significantly lower when the vast majority of applications are made at a very late point. We will know more in January.
Nonetheless, stability in the undergraduate admissions market looks far away. The sheer number of variables at play makes it incredibly difficult to interpret and navigate the market, and the declining numbers entering lower tariff institutions (primarily caused by market pressures) appears to be slowing progress in widening participation. Reconciling the often contradictory objectives of widening participation and market success will continue to be a big strategic challenge for universities in the coming years.
With thanks to the press and data teams at UCAS. All graphs provided by UCAS, with the exception of those containing the EU referendum result.
Article edited at 10am on 15/12/16 to account for the cap on Scottish places at Scottish universities.


I must express some scepticism about the use of data in section 4 to try to correlate parliamentary constituency votes on Brexit with University admissions. Firstly the parliamentary constituency estimate of the referendum vote is itself a very rough estimate, based on extrapolation of nearly six year old population census data with turnout of voters at local authority level in the referendum and national exit poll data about how people claim to have voted in the referendum. The polling companies have been shown to be very wrong recently in some of their estimations of voter behaviour from polling evidence and… Read more »