


The Office for Students releases a surprisingly large amount of data for a regulator that is supported by a separate “designated data body”.
Some of it is painfully regulatory in nature – the stuff of nightmares for registrars and planning teams that are not diligently pre-preparing versions of the OfS’ bespoke splits in real time (which feels like kind of a burden thing, but never mind).
Other parts of it feel like they might be regulatory, but are actually descriptive. No matter how bad your provider looks on any of the characteristics, or access and participation, indicators it is not these that spark the letter or the knock on the door. But they still speak eloquently about the wider state of the sector, and of particular providers within it.
Despite appearances, it is this descriptive data that is likely to preoccupy ministers and policymakers. It tells us about the changing size and shape of the sector, and of the improvement to life chances it does and does not offer particular groups of students.
Outcomes characteristics
How well do particular groups of students perform against the three standard OfS outcomes measures (continuation, completion, progression) plus another (attainment) that is very much in direct control of individual providers?
It’s a very pertinent question given the government’s HE Reform agenda language on access and participation – and the very best way to answer it is via an OfS data release. Rather than just the traditional student characteristics – age, ethnicity, the various area based measures – we get a range of rarities: household residual income, socioeconomic status, parental higher education experience. And these come alongside greatly expanded data on ethnicity (15 categories) and detail on age.
Even better, as well as comparing full time and part-time students, we can look at the performance of students by detailed (or indeed broad) subject areas – and at a range of levels of study.
We learn that students from better off (residual income at £42,601 or greater) are more likely to progress to a positive outcome – but so are students of nursing. Neither of these at the level of medical students, or distance learning students – but very slightly above Jewish students. The lowest scoring group on progression is currently students taught via subcontractual arrangements – but there are also detriments for students with communication-related disabilities, students from Bangladeshi backgrounds, and students with “other” sexual orientations.
In some cases there are likely explanatory factors and probably intersections – in others it is anyone’s guess. Again and again, we see a positive relationship between parental income or status and doing well at higher education: but it is also very likely that progression across the whole of society would show a similar pattern.
On this chart you can select your lifecycle stage on the top left-hand side, and use the study characteristics drop down to drill into modes of study or subject – there’s also an ability to exclude sub-contractual provision outside of registered provider via the population filter. At the bottom you can set domicile (note that most characteristics are available only for UK students) and level of study (again note that some measures are limited to undergraduates). The characteristics themselves are seen as the individual blobs for each year: mouse over to find similar blobs in other years or use the student characteristic filter or sub-characteristic highlighter to find ones that you want.
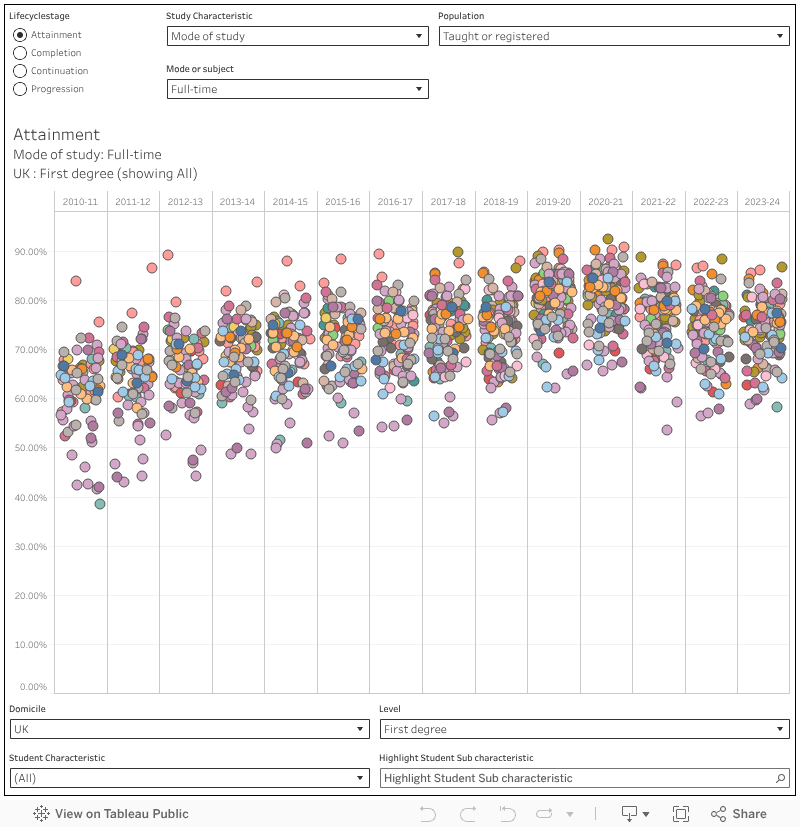
The “attainment” life cycle stage refers to the proportion of undergraduate qualifiers that achieve a first or upper second for their first degree. It’s not something we tend to see outside of the “unexplained first” lens, and it is very interesting to apply the detailed student characteristics to what amounts to awarding rates.
It remains strikingly difficult to achieve a first or upper second while being Black. Only 60 per cent of UK full time first degree students managed this in 2023-24 which compares well to nearer 50 per cent a decade ago, but not so well with the 80 per cent of their white peers. The awarding gap remains stark and persistent.
Deprivation appears to be having a growing impact on continuation – again for UK full time first degree students, the gap between the most (IMD Q1, 83.3 per cent) and least (Q5 93.1 per cent) deprived backgrounds has grown in recent years. And the subject filters add another level of variation – in medicine the different is tiny, but in natural sciences it is very large.
Population characteristics
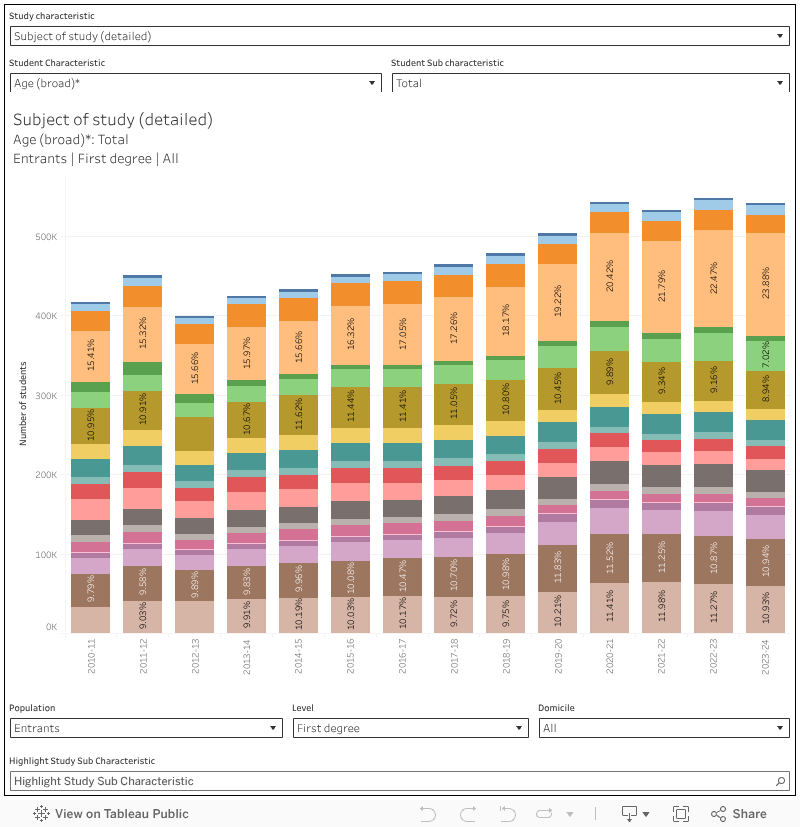
There are numerators (number of students where data is included) and denominators (number of students with those characteristics) within the outcomes dashboard, but sometimes we just need to get a sense of the makeup of the entire sector – focusing on entrants, qualifiers, or all students.
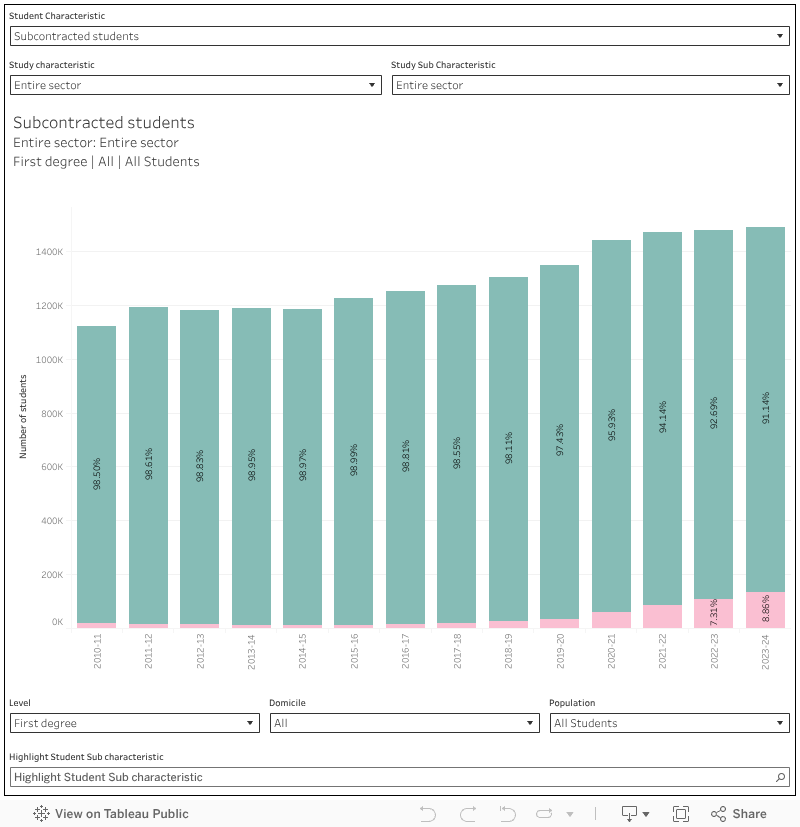
We learn that nearly 10 per cent of UK first degree students are taught within a subcontractual arrangement – rising to more than 36 per cent in business subjects. Counter-intuitively, the proportion of UK students studying other undergraduate courses (your level 4 and 5 provision) has fallen in previous years – 18 per cent of these students were taught via sub contractual arrangements in 2010, and just 13 per cent (of a far lower total) now. Again, the only rise is in business provision – sub-contractual teaching is offered to nearly a quarter of non-degree undergraduates from UK domiciles there.
More than a third (33.14 per cent) of UK medicine or dentistry undergraduates are from managerial or professional backgrounds, a higher proportion than any other subject area, even though this has declined slightly in recent years.
Two visualisations here – the first shows student characteristics as colours on the bars (use the filter at the top) and allows you to filter what you see by mode or subject area using the filters on the second row. At the bottom you can further filter by level of study, domicile, or population (all, entrants, or qualifiers). The percentages include students where the characteristic is “not applicable” or where there is “no response” – this is different from (but I think clearer than) the OfS presentation.
The second chance puts subject or mode as the colours, and allows you to look at the make up of particular student characteristic groups on this basis. This is a little bit of a hack, so you need to set the sub characteristic as “total” in order to alter the main characteristic group.
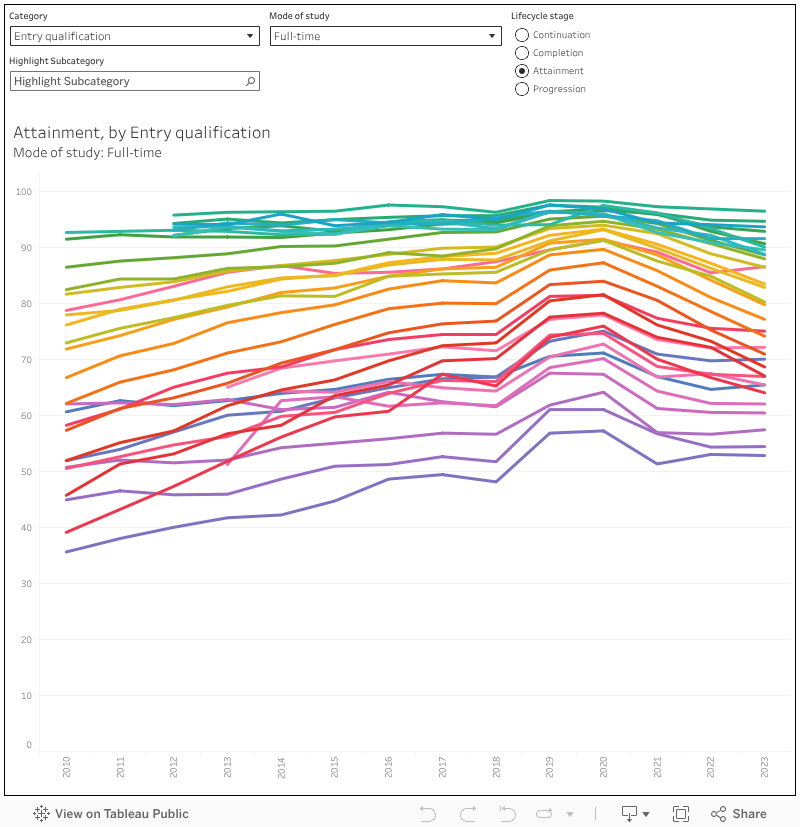
Entry qualification and subject
Overall, UK undergraduate business students are less likely to continue, complete, attain a good degree, or a positive progression outcome than their peers in any other subject area – and this gap has widened over time. There is now a 1.5 percentage point progression gap between business students and creative or performing arts students: on average a creative degree is more likely to get you into a job or further study than one in business, and this has been the case since 2018.
And there is still a link between level 3 qualifications and positive performance at every point of the higher education life cycle. The data here isn’t perfect – there’s no way to control for the well documented link between better level 3 performance (more As and A*s, less Cs, Ds and BTECs) and socioeconomic status or disadvantage. Seventy two per cent of the best performing BTEC students were awarded a first or upper second, 96 per cent of the best performing A level students.
This is all taken from a specific plot of characteristics (entry qualification and subject) data – unfortunately for us it contains information on those two topic only, and you can’t even cross plot them.
What OfS makes of all this
Two key findings documents published alongside this release detail the regulatory observations. The across-the-board decline in continuation appears to have been halted, with an improvement in 2022-23 – but mature entrants are still around 9 percentage points less likely to continue.
We get recognition of the persistent gap in performance at all levels other than progression between women (who tend to do better) and men (who tend to do worse). And of the counterintuitive continuation benefits experienced by disabled students. And we do get a note on the Black attainment gap I noted above.
Again, this isn’t the regulatory action end of OfS’ data operations – so we are unlikely to see investigations or fines related to particularly poor performance on some of these characteristics within individual providers. Findings like these at a sector level suggest problems at a structural rather than institutional level, and as is increasingly being made plain we are not really set up to deal with structural higher education issues in England – indeed, these two reports and millions of rows of data do not even merit a press release.
We do get data on some of these issues at provider level via the access and participation dashboards, and we’ll dive into those elsewhere.
Once again the awarding gap between black and white students is mentioned without any mention of the corresponding access gap (in the other direction). Of state school pupils aged 18, in 2024 the percentage of blacks who go to university is 48% whereas for whites is it 29.8%.
60% of 48% is 28.8% and 80% of 29.8% is 23.8%. So a larger percentage of black pupils (28.8%) will go on to achieve a first or an upper second than white pupils. (23.8%).
Data source:
https://www.ethnicity-facts-figures.service.gov.uk/education-skills-and-training/higher-education/entry-rates-into-higher-education/latest/