


Just over a year ago on the site, I went hunting for performance.
I was looking to see how universities had done against the targets that universities had agreed with the Office for Students (OfS) in their 2020–21 to 2024–25 access and participation plans.
Back then, I restricted the analysis to the Russell Group – partly for manageability, partly because the mismatch between that group’s promises and its performance was the story that OfS itself had told when it launched the plans.
The results, measured against 2022–23 data, were pretty worrying.
Since then, two things have happened. OfS has updated its access and participation data dashboard to cover 2023–24 – the penultimate year of most of those plans.
And OfS has continued not to publish any monitoring of performance against the targets it signed off – the last monitoring data it released, in September 2022, covered the 2020–21 academic year.
So this time I’ve done the whole thing. Every target in every plan from that wave – 102 providers, 945 targets in total – extracted, matched where possible to a measure on the dashboard, and compared with the milestone that the provider agreed with the regulator for 2023–24, and with the provider’s own baseline.
Of the 945, some 777 could be assessed via the dashboard – the rest rely on internal data, surveys or measures the dashboard doesn’t cover.
The usual caveats apply. Where a plan was ambiguous about the students in scope, I’ve matched to the closest dashboard measure (usually full-time, all undergraduates), and for many targets the plan’s baseline year now falls outside the dashboard’s published series – although running the numbers only on the cleanest matches produces near-identical results.
The results
Of the 777 assessable targets, 488 – 63 per cent – missed the 2023–24 milestone that the provider had agreed with OfS.
Worse, 207 of them – more than one in four – showed performance in 2023–24 that was behind the baseline in the plan. In other words, on over a quarter of the commitments that providers made, and that OfS approved and was supposed to be monitoring, things did not just improve too slowly. They went backwards.
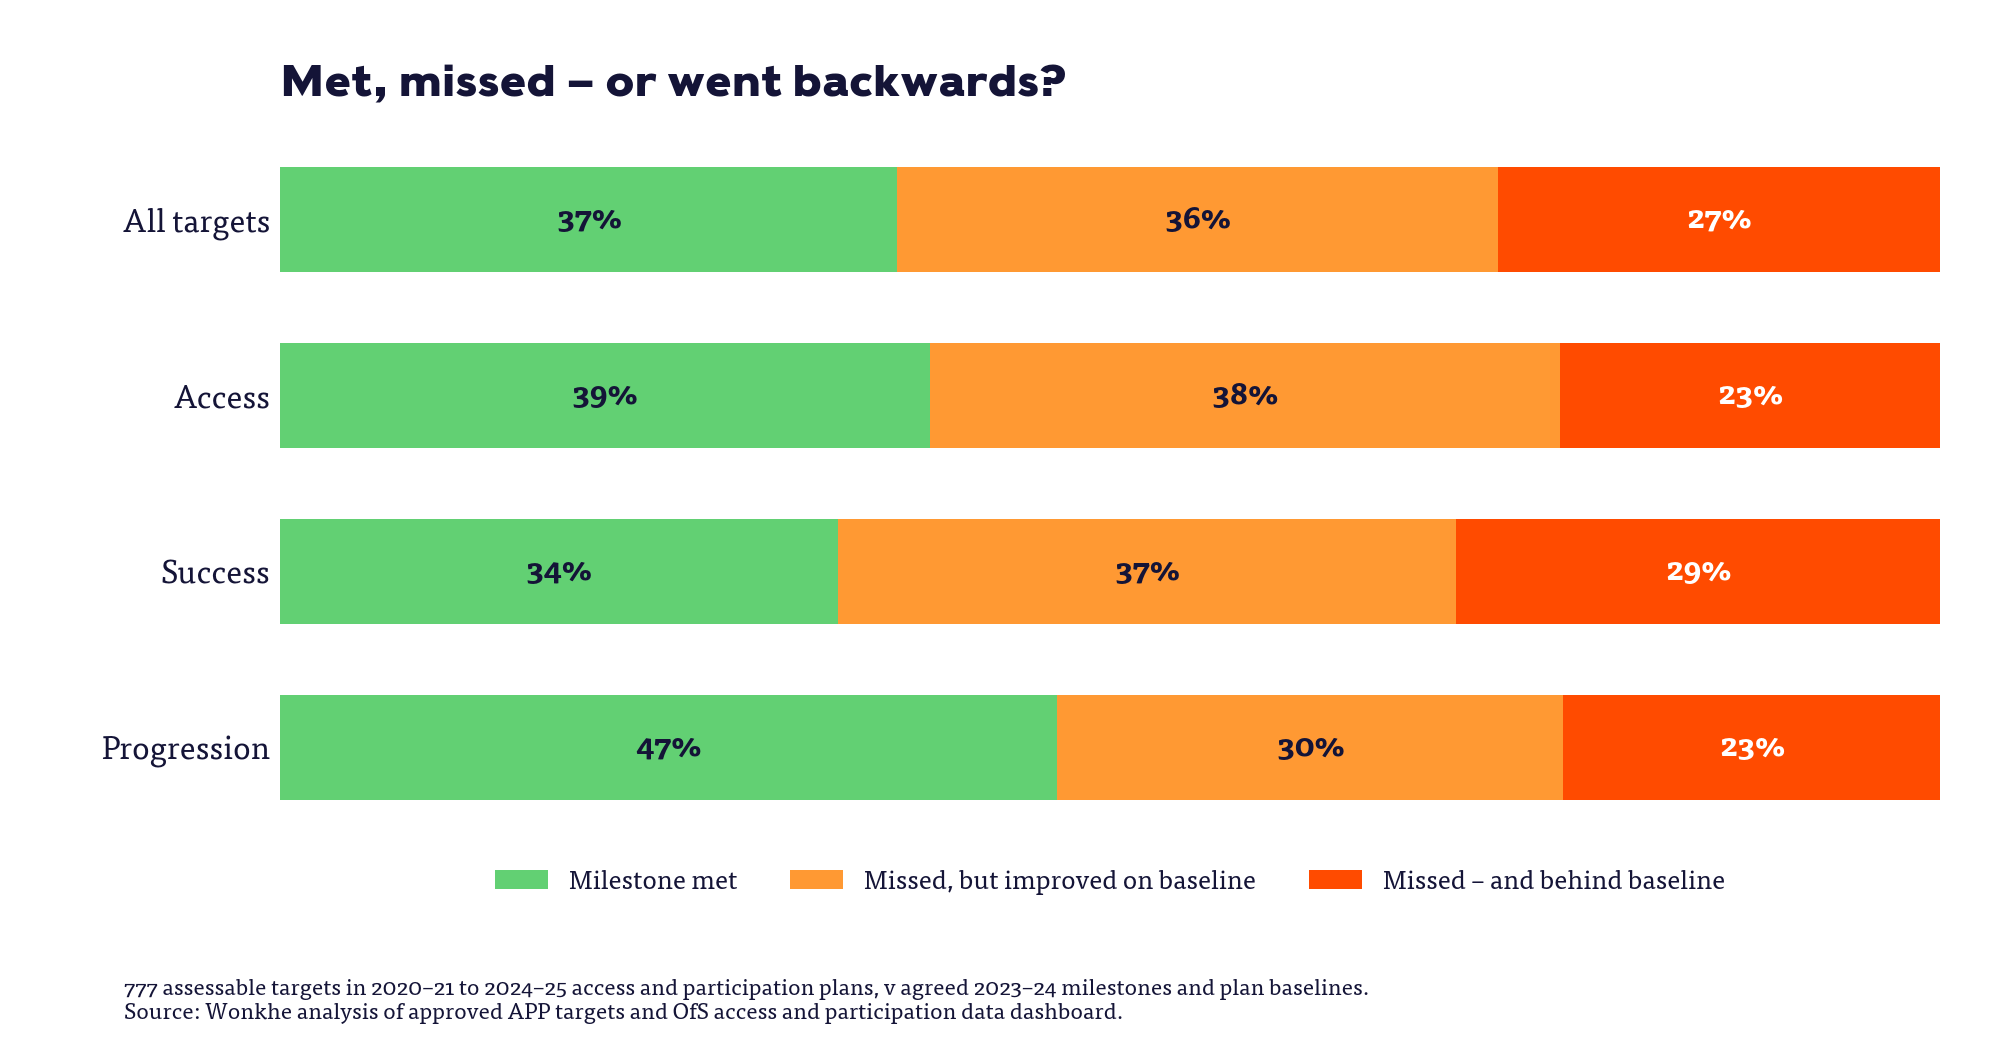
The pattern holds across the student lifecycle. On access, 61 per cent of assessable targets were behind milestone, and 23 per cent behind baseline. On student success – continuation, completion and attainment, the largest category with 470 assessable targets – 66 per cent were behind milestone and 29 per cent behind baseline. Progression fares “best”, with (only) 53 per cent behind milestone.
And lest anyone assume the sector-wide picture is being dragged down by a particular type of provider – the Russell Group’s figures are almost exactly the sector average, with 63 per cent of its assessable targets behind milestone and 24 per cent behind baseline.
Who was let down
Splitting by the groups of students the targets were supposed to help is where it gets properly miserable.
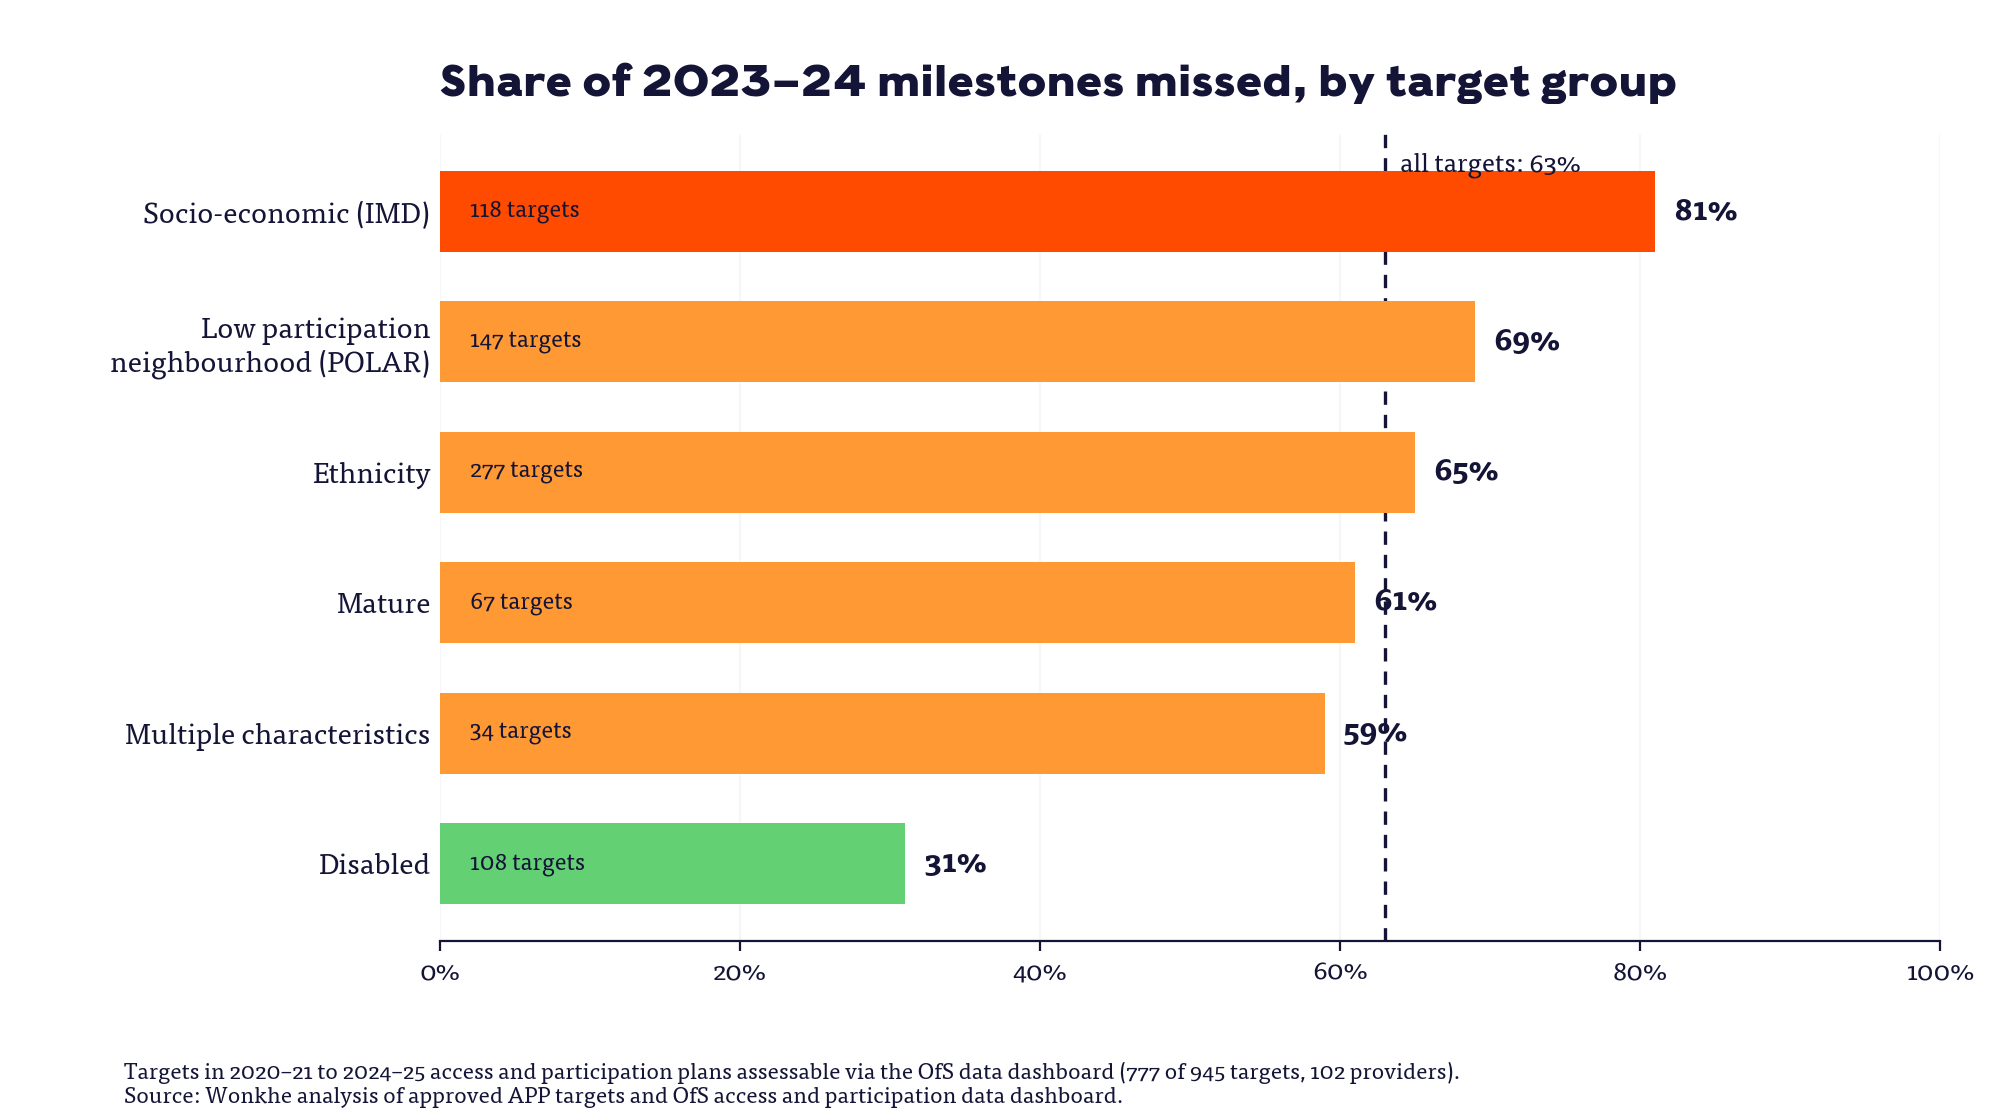
The worst performance is on socio-economic disadvantage – overwhelmingly targets on gaps between IMD quintile 1 and quintile 5 students. Of 118 assessable targets, 81 per cent missed their milestone, and close to a third were behind baseline.
On low participation neighbourhoods – the POLAR measures that drove so much of the rhetoric when these plans were launched – 69 per cent of 147 targets were behind milestone.
On ethnicity, 65 per cent of 277 targets were missed. The signature commitment of that era – closing the gap between the proportion of white and Black students awarded a first or 2:1 – shows up in 83 separate provider targets, and three quarters of them missed their 2023–24 milestone.
Mature students supply the most consistent story of decline – of the fifteen assessable access targets on mature students, twelve missed their milestone, and ten were behind their baseline. Given what we know about the collapse in mature and part-time numbers, that will surprise nobody – but every one of those targets was signed off by a regulator that ought to have been adjusting for changes in the risk environment.
The one bright spot is disability. Only 31 per cent of the 108 assessable targets on disabled students were missed, and fewer than one in ten were behind baseline – driven substantially by the growth in students declaring a disability, particularly mental health conditions. Whether rising declaration reflects widened access or better disclosure is a question for another day.
At provider level, 83 of the 102 providers with assessable targets missed at least half of them. Seven providers – on my matching, at least – missed every single assessable milestone in their plan.
A classless failure
If you’re expecting mission group analysis to reveal heroes and villains, prepare for disappointment. Sorting the 102 providers into five rough groups – the (English) Russell Group, other pre-92 universities, post-92s, universities that gained their title after 2000, and small and specialist providers – produces a remarkably narrow spread on the headline measure.
Every single group missed somewhere between 57 and 68 per cent of its milestones, and in every group the clear majority of providers missed at least half of theirs – 18 of 20 in the Russell Group, 18 of 21 pre-92s, 25 of 31 post-92s, 13 of 19 newer universities, and nine of 11 small and specialists. The failure, unusually for this sector, was classless.
But break it down by getting in, getting on and getting out, and the groups start to tell quite different stories.
Getting in
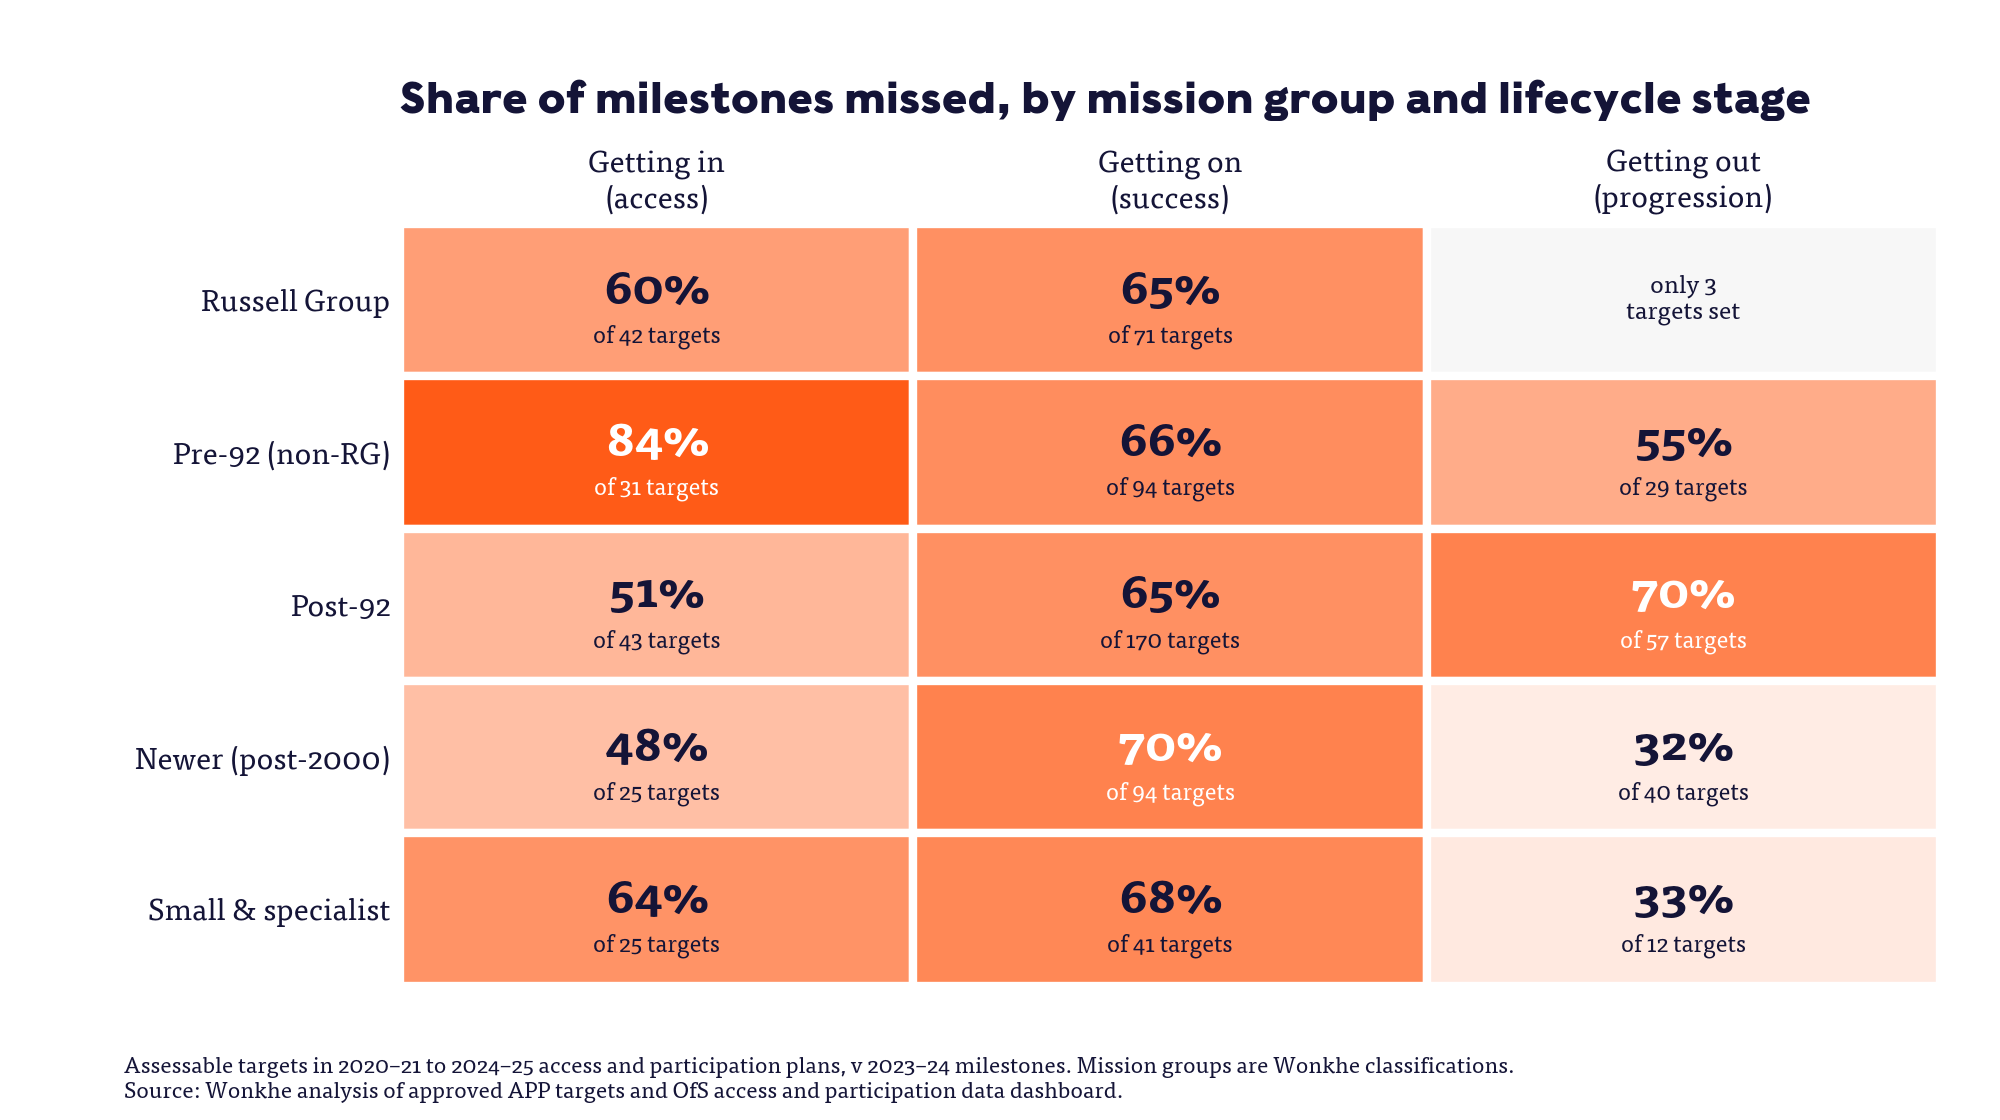
On access, the group in real trouble is the pre-92s outside the Russell Group – who missed 84 per cent of their access milestones, with over a third of their access targets behind baseline.
The Russell Group missed 60 per cent of its access targets too, but only 12 per cent were behind baseline – it moved in the right direction, just nowhere near fast enough.
The squeezed middle didn’t just move too slowly, it went backwards – and that’s consistent with its traditional recruitment ground being raided from above as higher-tariff providers expanded. All the moles, it turns out, got whacked at once.
The post-92s and newer universities did rather better here, missing around half.
Getting on
Student success – continuation, completion and attainment – is the great leveller. Every single group missed between 65 and 70 per cent of its success milestones, and in four of the five groups around three in ten success targets were behind baseline.
Whatever a provider’s history, tariff or mission, the thing it promised most confidently – that students would be more likely to stay, complete and attain well – is the thing the whole sector delivered least.
Getting out
Progression is where the groups diverge most. The newer universities and the small and specialists missed only around a third of their progression milestones, with barely any behind baseline – comfortably the strongest cell in the whole analysis.
The post-92s, by contrast, missed 70 per cent of theirs. And the Russell Group barely features – of its 116 assessable targets, just three concerned progression.
Make of that what you will – the group whose graduates command the strongest labour market outcomes largely declined to be measured on them.
And by student group
Cutting by student characteristic instead adds a final twist. On ethnicity, it’s the older universities that went backwards – 38 per cent of both Russell Group and pre-92 ethnicity targets were behind baseline, against 23 per cent at newer universities and just six per cent at small and specialists.
On socio-economic disadvantage, everyone failed – every group missed at least two thirds of its IMD-based targets, with the post-92s worst at 86 per cent. On mature students, half the pre-92s’ targets were behind baseline – nobody’s good news story.
And disability was the bright spot everywhere except the Russell Group, which missed 45 per cent of its disability milestones while every other group managed far better.
Whatever explains all of this, it isn’t a particular corner of the sector letting the side down – and nor did any corner of the sector escape. It’s the design of the whole exercise.
Remember the fanfare?
When OfS launched this wave of plans in January 2020, it did so with a press release promising that “the access gap at England’s most selective universities will almost halve in the next five years” – along with a set of national pledges specific enough to check.
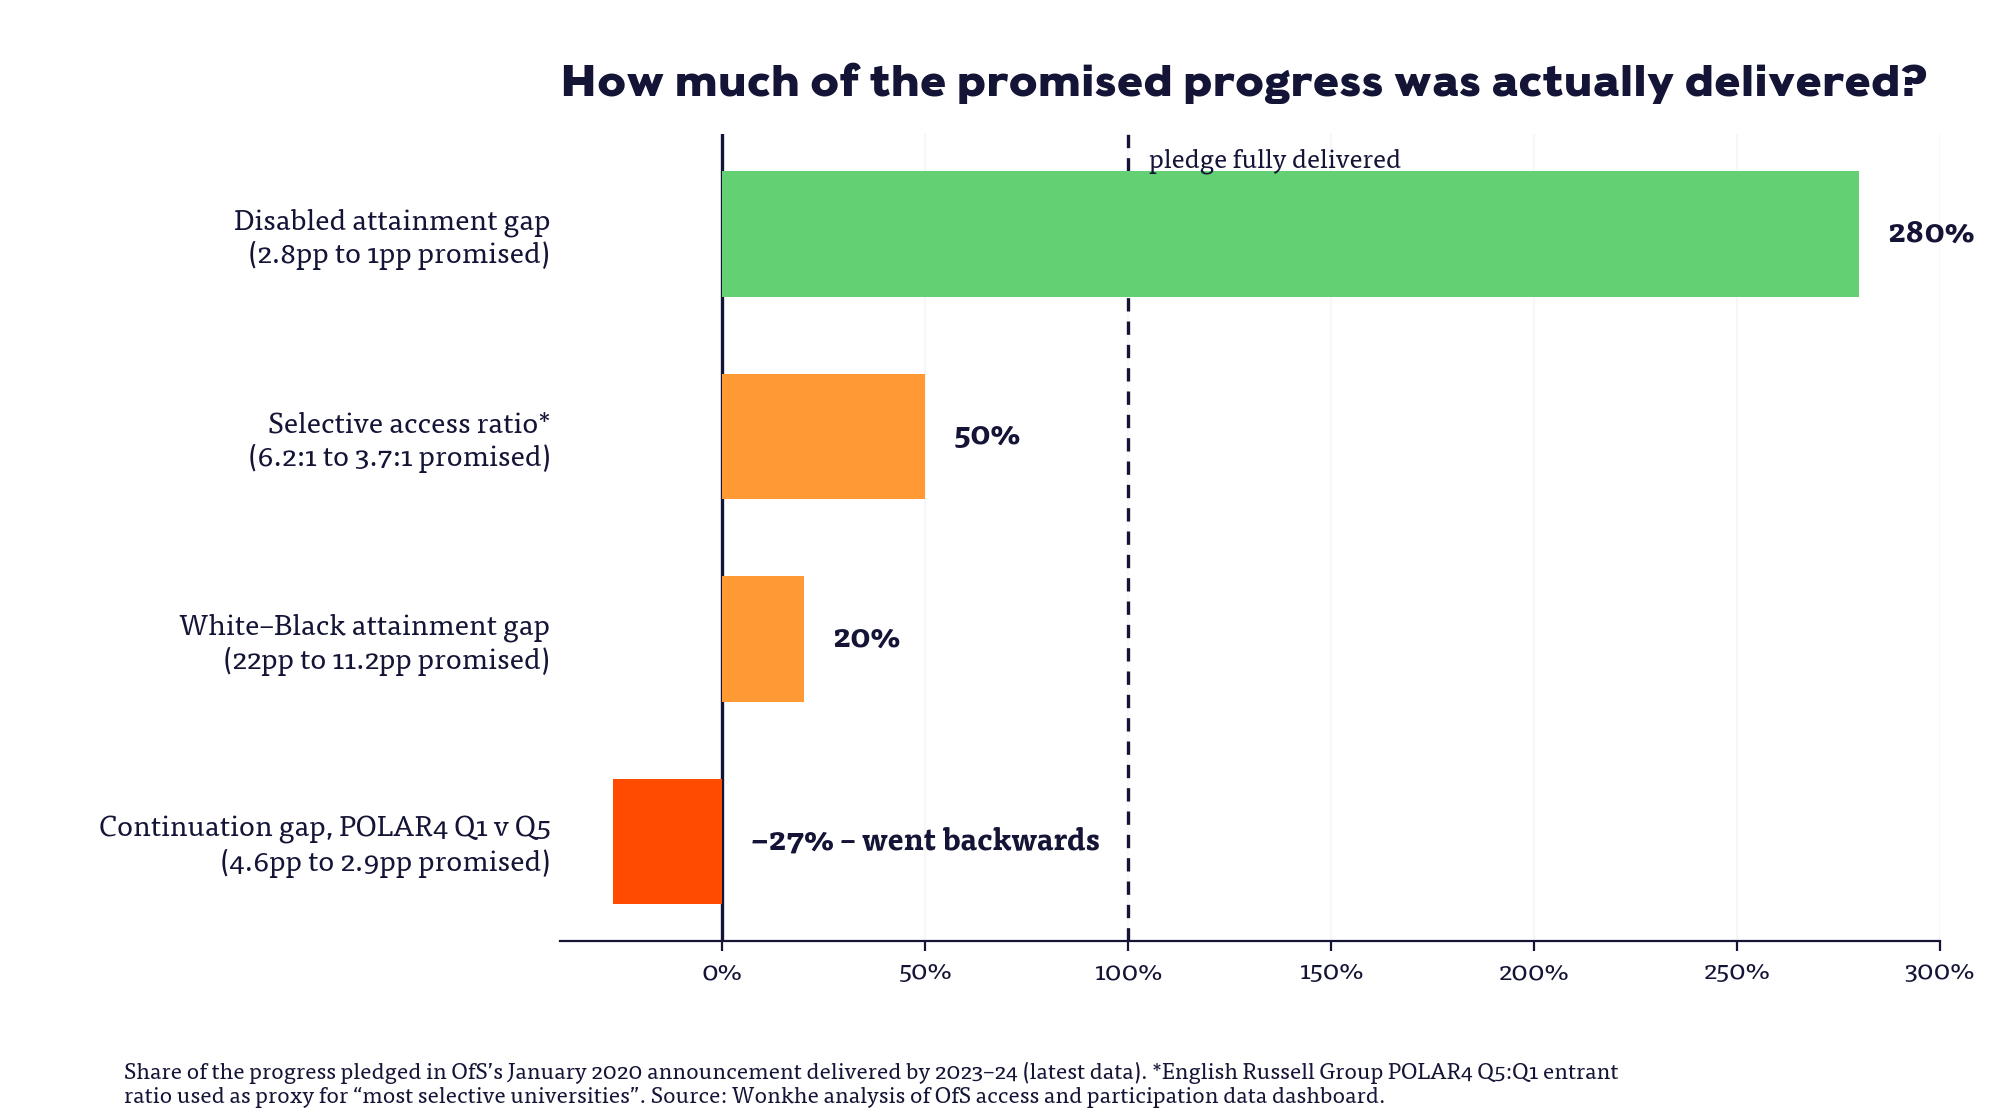
Young people from the most advantaged areas were then over six times as likely to attend the most selective universities as those from the most disadvantaged. At the rates of progress forecast under the plans, the ratio would be “less than 4:1 by 2025” – and eliminated entirely within 20 years.
Taking the English Russell Group as the proxy, the ratio of POLAR4 quintile 5 to quintile 1 full-time undergraduate entrants stood at 7.0 in 2018–19, fell to 5.3 by 2022–23 – and then rose again, to 5.6, in 2023–24. Roughly a third of the promised progress, now heading the wrong way.
That halving was supposed to mean “around 6,500 extra students from the most disadvantaged areas attending these universities each year from 2024–25 onwards”. Russell Group quintile 1 entrants rose from around 4,700 in 2018–19 to a peak of 7,200 in 2021–22 – and then fell for two consecutive years, to around 6,400 in 2023–24. A net gain of about 1,700, and shrinking.
The gap in dropout rates between students from the most and least represented groups “would fall from 4.6 to 2.9 percentage points”. Aggregating across every provider in the dashboard, the full-time continuation gap was 4.8 percentage points for 2017–18 entrants. For 2022–23 entrants – the latest available – it was 5.3. Not just short of the pledge, but wider than when the plans began.
The gap between the proportion of white and Black students awarded a first or 2:1 “would drop from 22 to 11.2 percentage points”. It was 22.6 points in 2018–19. After an artificial narrowing during the pandemic’s no-detriment years, it was back at 22.4 by 2022–23, and stood at 20.3 in 2023–24. Six years bought roughly two of the promised eleven points.
And the disabled attainment gap would fall “from 2.8 to only 1 percentage point”. Here – and only here – the pledge was met, and then some. Disabled students now out-attain students with no known disability by over a percentage point, consistent with disability being the one target group where most providers hit their milestones.
One pledge out of four (plus a bonus), then. The press release also promised that OfS had “put in place a range of measures to hold universities and colleges to account on the commitments they have made”. Oh aye?
What the market did next
If you want the mechanism underneath all of this, look at UCAS acceptances by tariff group. Between 2016 and 2025, accepted applicants at higher tariff providers rose from around 149,000 to around 190,000 – with the steepest climb coming after 2023. Over the same period, lower tariff providers collapsed from around 197,000 to around 158,000. Medium tariff barely moved. The two lines cross like a pair of scissors – and everything in this analysis is caught between the blades.
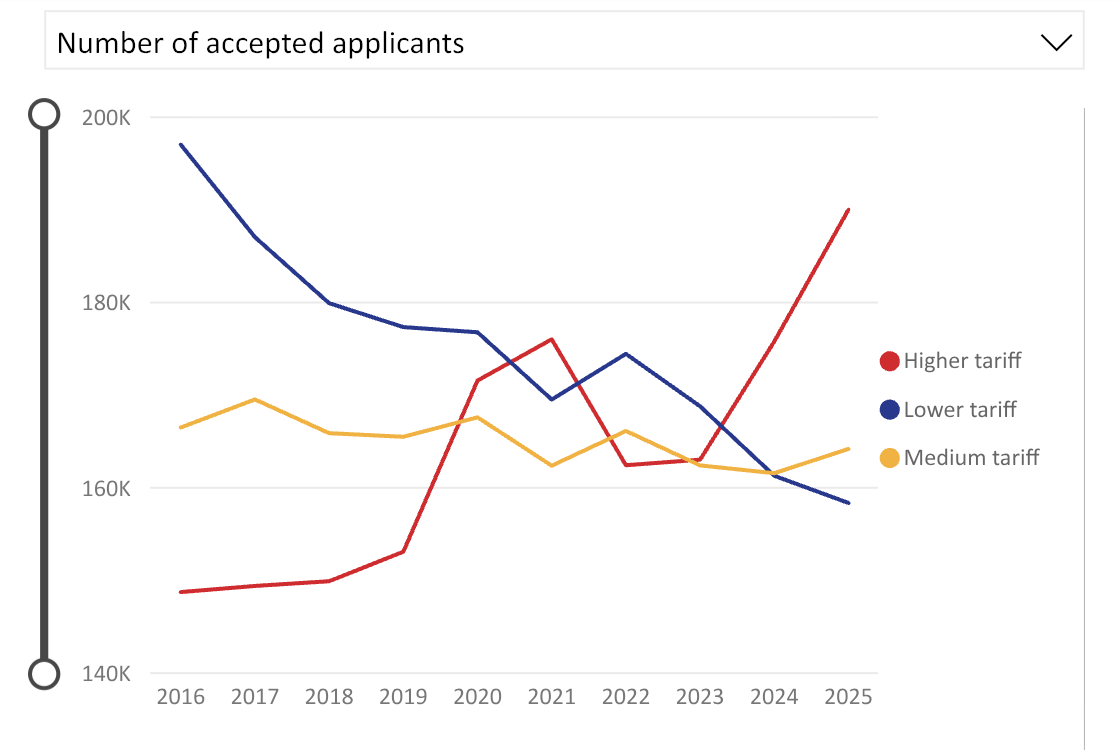
It tells us that the high tariff end of the sector found tens of thousands of places over exactly the period covered by these plans – capacity of a sort that was said to be impossible when the “mutant algorithm” hit in 2020.
But while overall acceptances surged, those providers’ POLAR quintile 1 entrant numbers peaked in 2021–22 and then fell for two consecutive years. The expansion happened. It just wasn’t for the students the plans were supposed to be about – which is how you grow by forty thousand and still watch your access ratio get worse.
It also reframes the pre-92s’ catastrophic access performance. Missing 84 per cent of access milestones, with a third of targets behind baseline, isn’t best understood as 21 separate institutional failures – it’s the downstream shadow of that expansion.
When the top of the market grows that fast, somebody loses the students, and the UCAS chart shows who. The same logic runs on into the success targets – providers losing a big slice of their intake see both the composition of their student body and the money available to support it move against them at once, which is at least part of why continuation, completion and attainment targets fell over so uniformly across the sector.
And it’s the strongest indictment of the regulatory design on offer. Access and participation plans regulate providers one at a time – but this is a system-level dynamic that no individual provider controls, that no target anywhere accounts for, and that OfS has no instrument to touch.
Worse, the steepest part of that higher tariff line is 2024 and 2025 – after the last year the dashboard can currently see. Whatever the final-year data eventually shows, the forces that broke this wave of targets are accelerating into the next one.
The dog that still hasn’t barked
Last year I noted that this sort of performance is the kind of thing we might have expected to result in fines, or specific conditions of registration – and that as far as anyone could tell, nothing beyond enhanced monitoring had been applied, and even then we didn’t know to whom.
A year on, with the evidence now covering the penultimate year of the plans and the whole sector, the silence is more remarkable still. There has been no published monitoring of any of these targets for any year after 2020–21. There is no public record of regulatory action taken against any provider for missing them.
The plans have simply been superseded – a new wave, running to 2028–29, agreed under new guidance, a new risk register, and a new director for fair access and participation.
The plans in this analysis were agreed under Chris Millward’s regime, which ended in 2021 – before a single year of monitoring data on them was ever published. John Blake arrived, tore up the guidance, built the Equality of Opportunity Risk Register, agreed a whole new wave of plans running to 2028–29 – and has now left too, with the first proper data on his plans still years away.
If the pattern holds, a third director will be along presently, with a third set of priorities, a third framework – and a third set of predecessor commitments gathering dust. The data lag means no director for fair access and participation ever faces the results of what they signed off, and no set of targets survives long enough to embarrass anyone. It’s regulation as a relay race in which the baton is dropped, deliberately, at every handover.
Which is the danger I flagged last time. When long-term plans outlast the regime that agreed them, the expectations and targets get sidelined and forgotten – letting poor performers off the hook. On this evidence, that is no longer a risk. It is a description of what has happened.
It also compounds the aggregation problem. No provider was ever set the target of not getting worse on the measures it didn’t pick – and now we know that even on the measures providers did pick, and had approved, and were nominally accountable for, most went unmet, a quarter went backwards, and nothing happened.
The final year of these plans – 2024–25 – won’t be assessable until the dashboard’s next update. On current form, by the time we can see whether the sector delivered any of what it promised for the full plan period, we’ll be halfway through the next one. If the annual fee cap uplift now on the table is supposed to come with strings attached on access and outcomes, both the Department for Education and OfS might first want to explain what happened to the last set of strings.
Because on the evidence of 945 targets, the answer appears to be – nothing at all.










Fantastic analysis , (as always). It’s fascinating to me how this has all been missed by the OfS.
It would be interesting to see the latest data.
Or , I guess we’ll have to wait for the 2028 – 10 years of APP – special report to tell us basically what you have said here.
‘A third director will be along presently, with a third set of priorities, a third framework – and a third set of predecessor commitments gathering dust.’
This is spot on – as someone who works at a provider – OfS pushed us really hard at the time these APPs were being written to make our targets very (almost unrealistically) ambitious then never bothered to monitor them!
From what I understand the APP team at OfS is now tiny, so the lack of monitoring is probably also due to the small resource devoted to APPs in OfS.
Yep, can’t really argue with that, but would echo Vicky’s comments about being pushed to set ambitious targets, particularly on awarding gaps.
One quick point to mention though, the graphic highlighting failure rates by mission group seems to have been duplicated where there should be the rates by demographic group (under ‘who was let down’), would be good to see that if it could be amended, thanks.