


Participation in higher education remains an aspirational outcome for young people. But what can it tell you about the wider character of an area?
More often seen in work on widening access to HE, and as one of five quintiles, POLAR is an area based measure of young participation at mid-level super output areas, which can be mapped (approximately) to Westminster parliamentary constituencies. I did this a while ago, with a little bit of help from the ONS.
Identifying aspiration
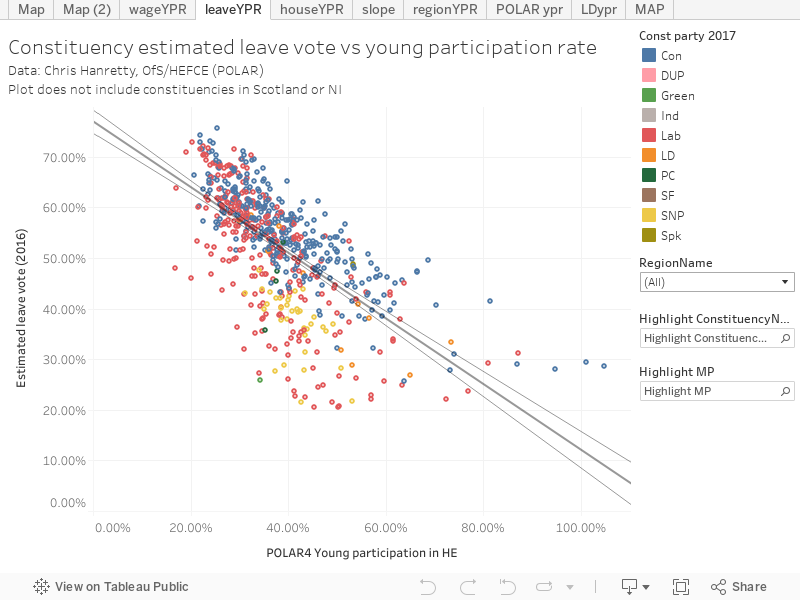
One startling finding I made at that point was the close correlation between young participation in HE and the estimated (via Chris Hanretty’s superb work) leave vote percentage in the 2016 referendum. For this first set of graphs I’m looking only at constituencies in England and Wales.
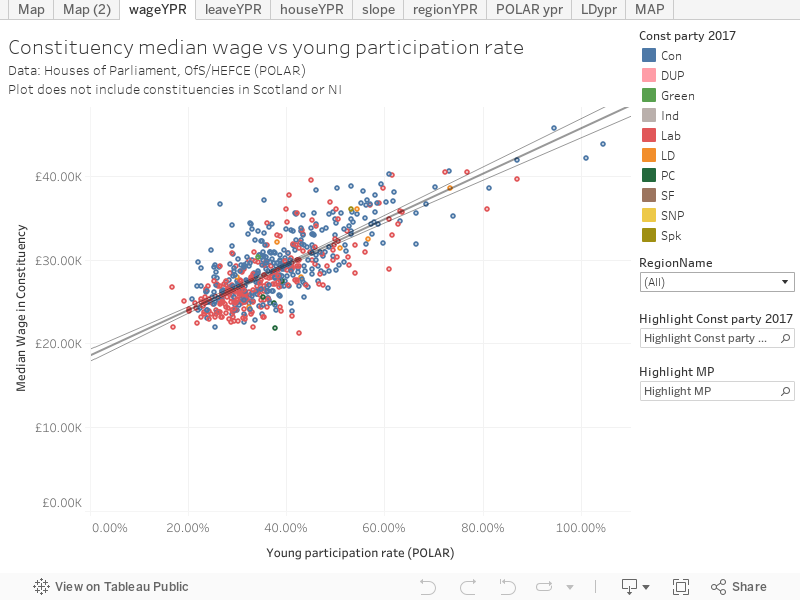
And there is a very clear relationship between participation rates and average wages:
And also there’s a less pronounced but still interesting relationship between participation rates and median house prices in the constituency:
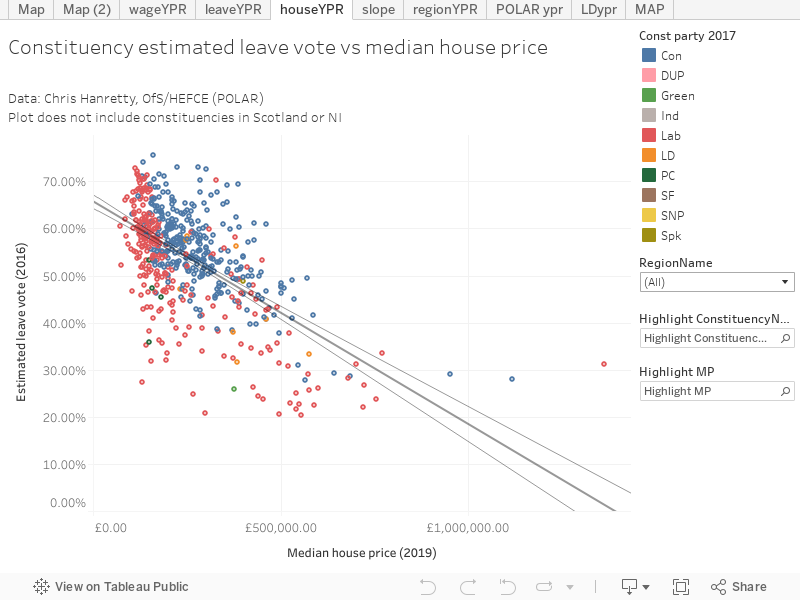
However, young participation rate is a better prediction of a leave vote than either average wage or house prices – so it feels like we are looking at something more attitudinal than economic about each locality.
Is there a party effect?
But we’re into November now, and I was reliably assured by Her Majesty’s Government that brexit would be done by this point. With an election on the way, I wondered if this effect would translate to party preferences. I started by looking at young participation in HE by region and party – adding Scotland in to our analysis:
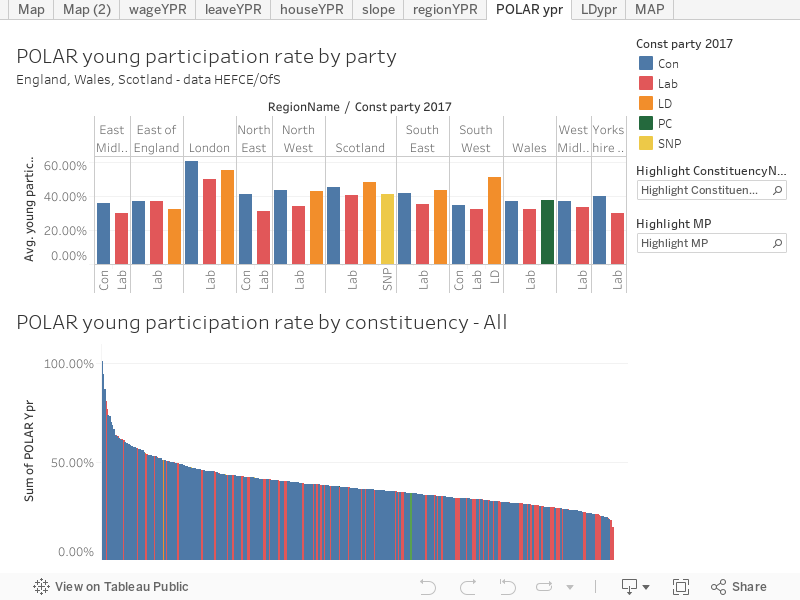
At first glance, there’s something interesting going on with the Liberal Democrats. In London, Scotland, the South East, and the South West constituencies represented by a Liberal Democrat MP tend to have a higher participation rate. And, perhaps surprisingly, there tends not to be a relationship between young participation and Labour held constituencies.
You can click a bar on the top graph, above, to see a detailed by constituency view in the bottom graph. Though the pattern doesn’t hold all over the country, a in a fair number of regions you will see Conservative MPs in constituencies with a high participation rate – a notable finding given the likely brexit stance of such areas. If you take majorities into the equation you would perhaps have the beginnings of an interesting predictive model. In fact, let’s make a small prediction: given the increasingly brexity nature of the Conservative party I’d peg Richmond Park, Chipping Barnet, Stirling, and Pudsey as Conservative losses.
Over to you!
Here’s a map showing English and Welsh constituencies (I don’t have all the data for Scotland or any of the data for NI) – with range filters for all of the variables I’ve talked about in this article. You can use these filters to explore the data for constituencies you think are interesting – will the young participation rate effect make a difference in your constituency?