


UK higher education providers placed 462,585 applicants in 2017 – a fall of 0.5% (-2,555) from the year before.
Although black applicants make up a traditionally low proportion of the overall figures, the proportion of black applicants placed has steadily increased since 2012. The latest statistics (for the academic year 2016-17) suggest that this trend has continued in the latest admissions cycle. Black applicants made up 8.3% (38,225) of the placed total in 2017, up from last year’s 8.1% (37,820). By comparison, this year Asian applicants had a 12% share of the total (54,715), and just under three-quarters of all placed applicants were white (72%).
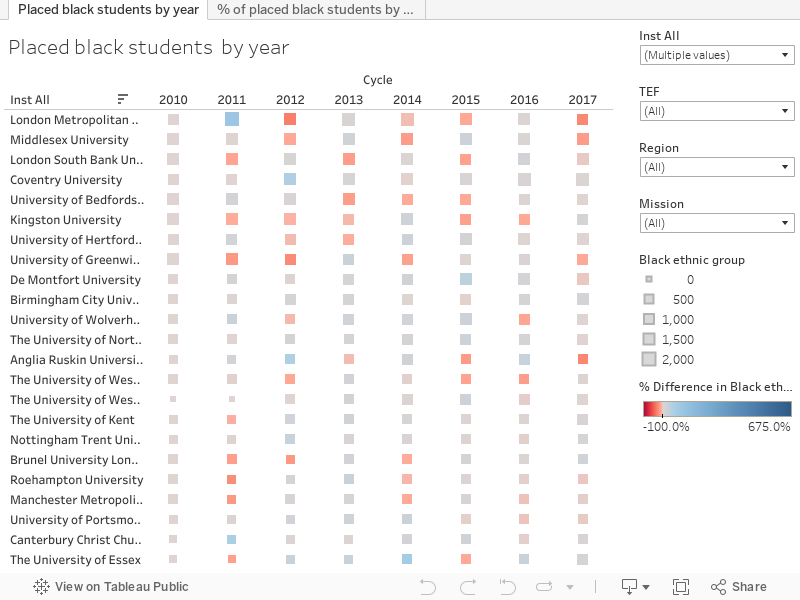
There are few strong trends across mission groups, TEF awards, or regions. Institutional trends were more notable: there are a handful of institutions that have placed among the highest number of black applicants over the last few years and many others that traditionally place very few black applicants.
There were few large swings in the proportion of placed black applicants. What may look like huge swings in the numbers of placed black applicants at a number of providers are often due to the small numbers of black students already studying at those providers – even a few people can have a noticeable effect on percentage changes compared with the year before.
Notes on the data
What are “placed applicants”? UCAS defines them as follows:
“Applicants placed for entry into higher education at the provider through one of their choices, including any choices made through Extra, or via Adjustment, Clearing or RPA.”
There are still a number of factors that can influence whether or not applicants who are given a place (and accept it) actually end up studying at the HEI in question. However, this is broadly the best statistic to use for the number of applicants who actually end up studying at a university. Data here refers only to UK-domiciled applicants. Applicants placed at University of East London were omitted from the initial UCAS data and so do not enter this analysis.
Institutions with the highest proportions
The five institutions that placed the highest proportion of black students in the academic year ending 2017 were:
- London Metropolitan University (38.2%)
- London South Bank University (34.7%)
- University of Bedfordshire (34.67%)
- University of Northampton (33.9%)
- University of West London (33.9%)
These institutions were the only ones to have placed a proportion of black applicants above a third of their overall placed applicant population. None noted a large swing from previous years, and all of the institutions have consistently placed large proportions of black applicants from their totals since 2012. Four of the five institutions are members of the MillionPlus mission group. Of the mission groups, MillionPlus had the widest range of proportions, with institutions placing black applicants anywhere between 0.7% to 38.2% of total placed applicants.
There was slightly less variation among University Alliance institutions. Kingston University increased the proportion of black placed applicants to 24.2% (+110 students), an increase of 4.22 percentage points compared with the previous year.
King’s College London leads the Russell Group, with 10.8% placed black students, up from 7.9% last year. In general, year-on-year variations were small, with a roughly even split between the number of Russell Group institutions that increased and decreased the proportion of placed black applicants in the year ending 2017, compared with the previous year.
Institutions with the lowest proportions
The five institutions that placed the smallest proportion of black students in the academic year ending 2017 were:
- Harper Adams University (0.0%)
- Ulster University (0.3%)
- Queen’s University Belfast (0.4%)
- Aberystwyth University (0.6%)
- University of Edinburgh (0.7%)
Similarly, there were no large swings in the proportion of black applicants placed at these institutions: black applicants generally made up less than 1% of the total placed applicants at these providers over the last five years.
Opposite trends in the nations
Two-thirds of the 15 Scottish institutions on UCAS records increased their proportion of black placed applicants compared with last year. However, the Scottish institution with the highest proportion of placed black applicants was Heriot-Watt University Edinburgh, with just 3.1%.
In Wales, the highest proportion of black placed applicants was recorded at Cardiff Metropolitan University, with black applicants making up 4.3% of the placed total. However, the proportion of black applicants fell at all but one Welsh institution – the University of Wales Trinity St David recorded a modest increase of half a percentage point on the previous year.
Variations across England
London-based institutions recorded higher-than-average proportions, with few significant trends across the rest of the nation. The range among institutions in the North was lower than average, with the highest proportion being 16.1% placed black applicants at the University of Bolton. The South also recorded lower-than-average proportions, with most institutions placing black applicants at less than 10% of their total.
A few universities – Buckinghamshire New University (20.2%), the University of Kent (16.2%), and Canterbury Christ Church University (17.8%) – bucked this trend. Given the likelihood that many institutions recruit a high proportion of students from their local area, it would be useful to compare these results with the proportions of black prospective students in different regions across the country.
Few correlations
On the whole, there are few significant correlations between mission groups, types of institution, regions, and even cities once we isolate black applicants. It is notable that even the size of institutions doesn’t directly relate to the number of black applicants placed – although the institutions that placed the highest numbers were larger, many other large institutions placed fewer than 100 black applicants. Instead, it appears that some providers have a culture of placing a relatively high number of black applicants, whereas most others are consistently further behind.
Next steps
An important next step would be to look at the numbers of black applicants to these different providers – I suspect that providers known for recruiting higher numbers of black applicants would also receive more applications in future from those of black backgrounds. Word of mouth, institutional culture and brand are all likely to play a part.
We need to be careful about drawing conclusions from data on black applicants because so many of the numbers are so small – that this is the case highlights exactly why this group needs to be analysed in the first place.
Supporting Tableau wizardry performed by David “interactive” Kernohan.


“The 2011 UK census found 13% (992,000) people identified as Black/African/Caribbean/Black British, suggesting there is still work to do.” – This sentence is a misquote, your source stats are referring to (13% of) foreign-born people only.
Edited – thank you.