


This article covers broad trends in results and university place acceptances. It’s not something you need to read if you are, or are supporting, someone on results day or with applying to university. This might be helpful though. I am adding “clearing updates” for the key points of clearing, midway down this piece. Other charts refer to the situation on JCQ results day (14 August 2025).
Though it is a perilous time to be a university one thing that is holding up seems to be undergraduate applications.
It is a bumper year – good news for students, who are more likely to be starting on the course and at the provider they really want to be at this autumn, and good news for the sector, who may have started believing the narrative that university is declining in popularity.
But we do need to separate things out – performance, both by students in achieving qualifications, by providers in running increasingly efficient and attractive recruitment operations, does mask some underlying issues. We’ve somehow reached a situation where study is becoming less affordable for students (especially relating to living costs, and especially affecting students from less advantaged backgrounds) and for universities (with the real value of fees far below 2012 levels, and changes in the market seeing growth among traditionally selective providers).
Today’s results are spectacular news for the higher education sector, but it surely must be clear to everyone that we are beginning to run out of road.
UCAS acceptances
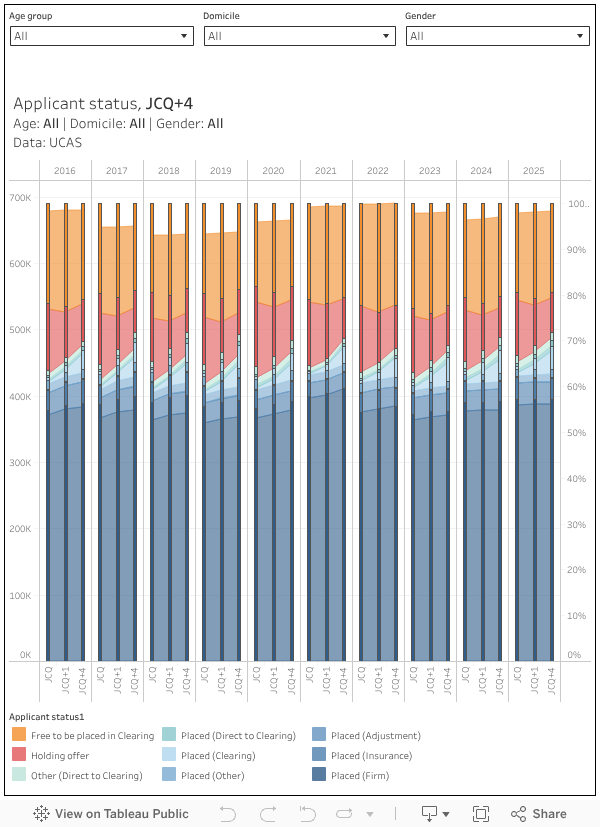
A record number of 18 year old applicants has yielded a record number and proportion (excepting 2021) taking up their firm offers in 2025. Just under 250,000 applicants (representing 63.51 per cent of all 18 year olds applying via UCAS) have started JCQ results day knowing that the university and course they had set their heart on will be where they will study next year.
Couple this with a recovery in insurance places being taken up, and we have a historically low proportion of 18 year olds entering clearing. Just 15.15 per cent of applicants are currently in clearing, plus another 12.8 per cent still holding offers but yet to confirm.
The picture is slightly different if you look at all ages – mature applicants are more likely to be in clearing than their younger counterparts – although a non-pandemic record proportion (57.25 per cent) of all students are taking up firm offers.
That said, it is going to be a hugely competitive few days for admissions teams, but correspondingly good news for applicants looking for a place: there will be more courses looking for students.

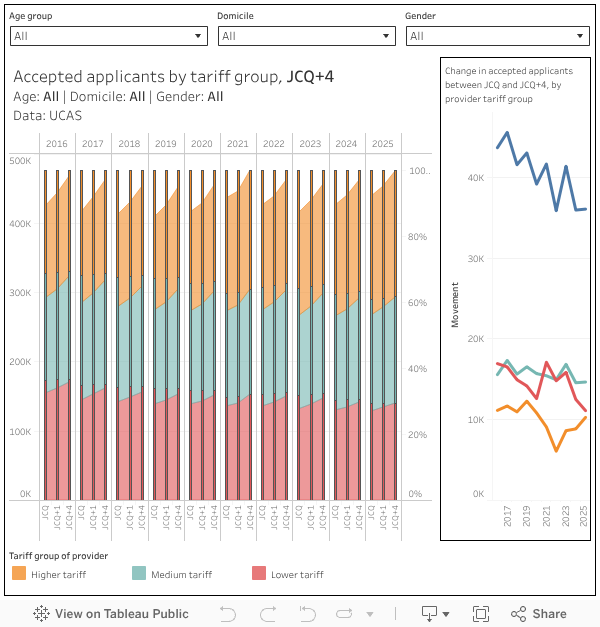
The sector will have an eye on the distribution of students across types of provider, and will see another entry in a time series that shows the growth of high tariff providers. A record 39 per cent of students who have accepted places on JCQ results day have done so at a high tariff provider – just 29.3 per cent will be starting at a low tariff provider (a record low). What’s “high tariff” these days? Anything above about 125.8 tariff points, according to DfE – but note that UCAS uses its own, proprietary and secret, measure that might be a bit different.

The entry rate for the most disadvantaged quintile of 18 year olds in England was 22.9 per cent – the highest proportion on record, but still a long way off the 44.5 per cent of the most advantaged quintile that will start university this autumn. Expect clearing activity to shift this slightly.

We also have data on subject area choices (at the top level of the common academic hierarchy). Of those students who have already accepted a place, business and medicine-related courses continue to grow in attractiveness – there’s been an increase in social sciences, engineering, and law (continuing a post-pandemic trend) and a sharp drop in interest for computing courses.

It is worth remembering that this represents just the first flush of acceptances – a historically large number of students, but far from the totality of this cohort. Most of the action in clearing happens early, and we’ll be covering that on Wonkhe over the next few days.
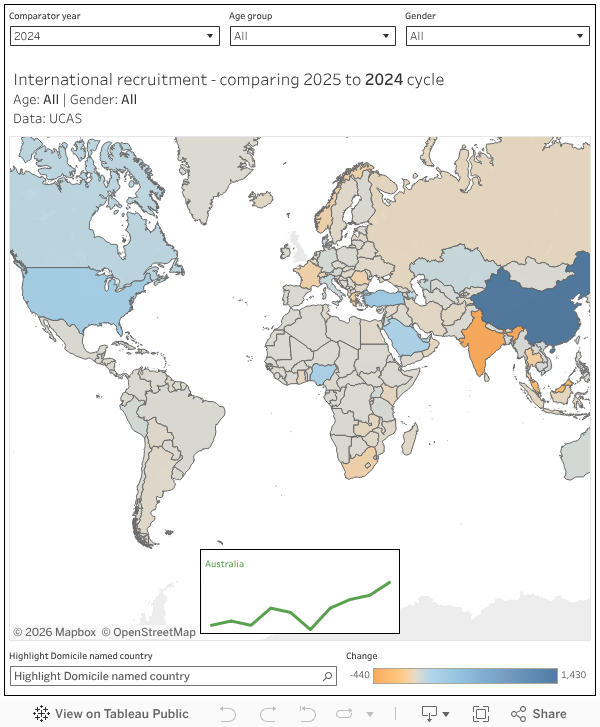
International acceptances
Not all international recruitment flows through UCAS or conforms to what is (for most of the world) artificial deadlines like JCQ, so this is by necessity an incomplete picture. But, again in contrast to prevailing narratives, numbers are up – there were 52,640 acceptances (up 2.9 per cent on last year) in 2025. We see strong year on year growth in China (up 14.6 per cent), the US (up 10.38 per cent), and Turkey (up 21.71 per cent). India is declining (down 9.42 per cent) and Nigeria is starting to recover (up 20.83 per cent) but still a long way off the peaks of 2022 and 2023.
Clearing update
This section was updated on 18 August 2025, with data from that day.
Just under 17,000 applicants were placed through clearing in the first 24 hours of activity, the largest number on record at this point of the cycle. Just under 9,400 applicants have entered clearing since results day, suggesting that slightly less are “trading up” than last year – though among English 18 year-olds 390 have declined a firm offer and 410 an insurance offer.
JCQ+4 shows clearing placements broadly in line with last year – and the classic pattern of those who choose to enter clearing finding a place quickly. Just over 131,000 students remain in clearing (just under 60,000 18 year olds), the lowest since 2020.
There will be a careful eye on where these students are heading. A larger number have found places at high tariff providers in the first 24 hours than in any year since 2020 – only a few hundred fewer than those placed at the lower tariff providers that have traditionally drawn from clearing. The performance continued over the weekend
A level results
A level performance (for students in England, Northern Ireland, and Wales) generally tends to see movements below the margin of error, as the methodology underpinning the award of marks contains elements of norm-referenced methodologies). The pandemic years (2020, 2021, 2022) are the exceptions here due to changes in the grading process.
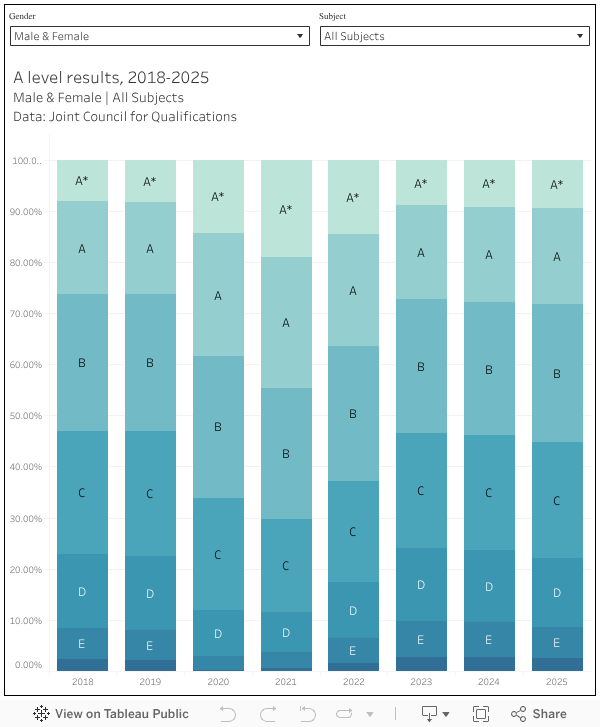
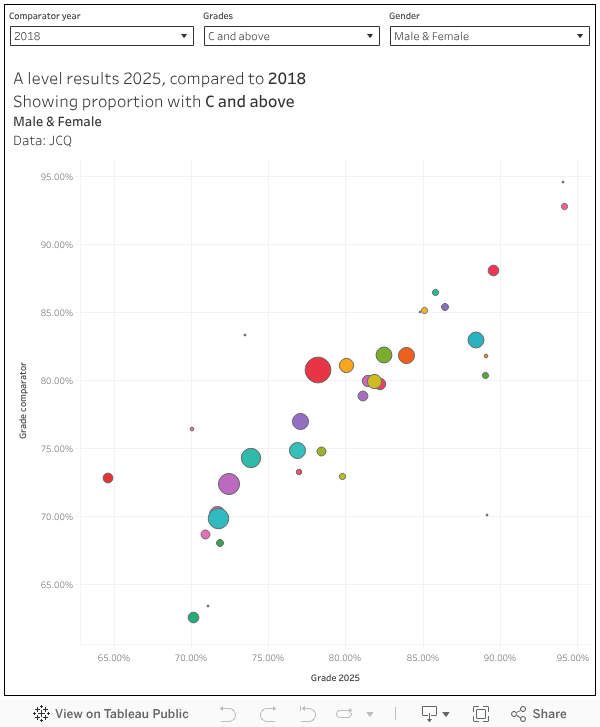
That said, there are some interesting underlying trends. Overall performance in 2025 is up (nearly 78 per cent got C and above this year, compared to 76.3 per cent last year) – this is based on a smaller (entries were down 0.5 per cent) and academically stronger (the popularity of vocational routes is growing, this was the first cohort to have non-compensated GCSE grades) group of students.
And, as always, there is huge variation by subject. Law remains the most difficult A level to achieve C and above in – just 64.6 per cent managed this in 2025, compared to 88.4 per cent in art and design disciplines. And law has got harder over time – in 2018 the proportion was 72.7 per cent.
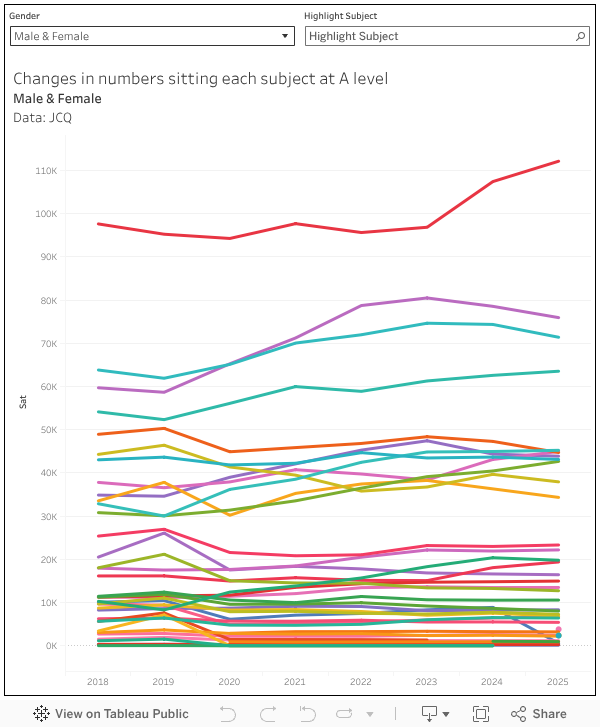
Law still remains moderately popular (there were just under 15,000 entries in 2025, up 1 per cent on last year) but is a long way behind the “big four”: maths (112,000, 4.4 per cent), psychology (76,000, down 3.3 per cent), biology (71,000, down 4 per cent), and chemistry (63,500, up 1.5 per cent).
What of the more than 250,000 level 3 vocational and technical qualifications awarded by JCQ today? The majority of these are what JCQ call “applied generals” (BTECs and the like) – there were 220,553 awarded, compared to 12,000 T levels.
Business and social policy qualifications are the dominant subject groups here (both had around 44,000 entries each). For the (most popular) medium sized qualifications – worth one-and-a-half A levels – 80 per cent achieved a Merit or above, and (for those graded A* to E) 75 per cent achieved a C above.
This is the fourth year of T levels, the new style of vocational and technical level 3 qualification invented by the last government and available in England only – there are now 18 subject routes available. Of the 12,000 or so taking T levels, some 65 per cent achieved a Merit or above, 91 per cent achieved a Pass or above. The numbers are small but growing rapidly, making year on year comparisons tricky – DfE has published some data on these results that goes into a little more depth.
The Ofqual release shows, once again, that independent and selective school settings have seen the highest proportions of top A level grades, with further education colleges seeing the lowest proportions. As usual, there is no data (or seemingly, interest) in performance at special schools – and neither the main release nor the analytics dashboard feel like special needs status is worth reporting on.
this is excellent info – do you know if the high low and med tariff info in your analysis is based on the latest DfE analysis released on 31/7 or is it using the current UCAS list of high, low and medium tariff HEIs? This really matters and not sure many folks picked up the tariff info released by DfE in late July, and the data is often not the same as data featured in league tables like Guardian and CUG.
Have confirmed with the UCAS press team that this is an in-house variant, based on average tariff attainment in recent cycles, split in to roughly equal thirds. It’s not a set of groupings that are ever released. I’ve slightly tweaked the text above to reflect this.
Interesting stats, thanks. I take issue however with the idea of commenting on how difficult a subject is to get an above a grade C. If you are suggesting that certain grades are more ‘difficult’ to achieve in some subjects , then you are also suggesting that top grades are ‘easier’ to achieve in other subjects. Outcomes are more likely linked to the calibre of the students taking each subject. I suggest that Law probably attracts a wider range of abilities than say, Further Maths. Similarly with those taking Irish and other modern languages, these subjects attract a narrower ability… Read more »
It’s more a suggestion that if you chose someone sitting the exam at random you are more/less likely to choose someone getting a higher grade.
I certainly wouldn’t want to imply that any of the exams are “easy” (I wouldn’t want to take any of them!)